THE END OF ETHI think they’re about to trap all of you in the most popular alts.
Bitcoin. Ethereum. XRP. Solana. ADA. DOGE. PEPE. You name it.
The end of ETH is near.
🟩 Green = I’m buying
🟥 Red = I’m selling
Last time we predicted the drop from $4,000 to $1,400.
This time I want to see ETH under $1,000.
Good luck holding your bags when the market rug gets pulled.
I’m not here for likes — I’m here for entries. Stay sharp. 🧠📉
ETHUSD trade ideas

ETHEREUM Resistance Ahead! Sell!
Hello,Traders!
ETHEREUM is trading in a strong
Uptrend and the coin has grown
By more than 70% since the last low
So the coin is locally overbought
And after it retest the horizontal
Resistance of 4100$ we will be
Expecting a local bearish correction
Sell!
Comment and subscribe to help us grow!
Check out other forecasts below too!
Disclosure: I am part of Trade Nation's Influencer program and receive a monthly fee for using their TradingView charts in my analysis.


ETHUSD: Multi-Scale LevelsResearch Notes
Price is getting close to connected tops (after which rejections happened).
If we scale out, there is larger narrative Giving vital points of reference.
The dynamics look like part of various progressions at the same time. For example, to answer why price grew from sub-2k levels in the first place, I would pay attention to how it had been falling. Even if price breaks above white line, the ongoings cycle still inherits the prolonged timing.
Interconnection of levels with structural significance:
⬩At smaller scale, fibonacci channel adjusted to the angle of the first small cycle
⬩Scaling out the structure from previous cycle to relate to the levels of local scope.
⬩The final frame of reference covers the case where price expands breaking domestic range.

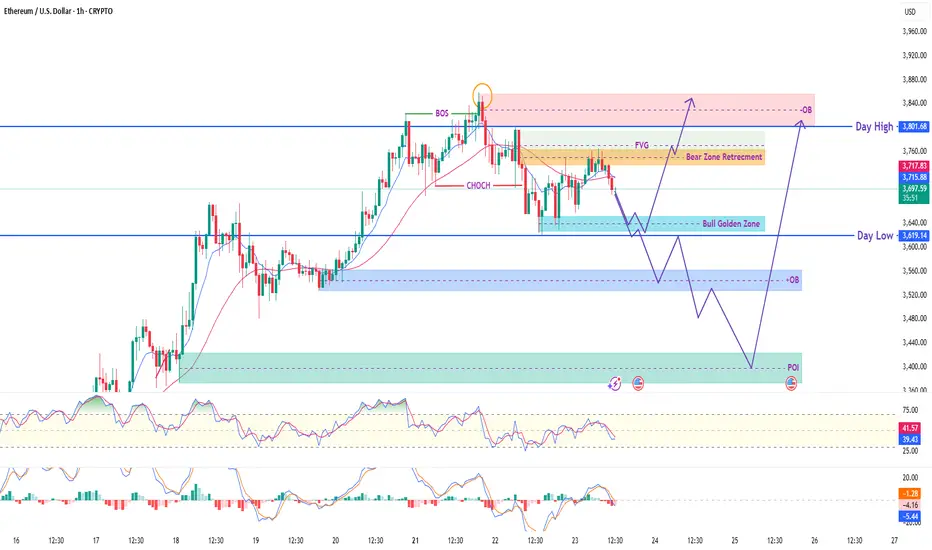
ETH/USD 1H – Smart Money Concept (SMC) Trade PlanThis chart showcases a clear Smart Money structure with precision. After a confirmed Break of Structure (BOS) and a strong Change of Character (CHOCH), the market is now in retracement mode, presenting a potential high-probability long opportunity.
📌 Trade Setup (Long Bias):
🔹 Entry Zone 1 (Primary):
3619 – 3590 → Bullish Golden Zone + OB
🔹 Entry Zone 2 (Deeper Liquidity Grab):
3530 – 3470 → Higher Timeframe OB + POI
🔸 Stop Loss (SL):
Below 3450 – to stay protected below weak low
🔹 Take Profits (TP):
✅ TP1: 3715 – Intraday Reaction
✅ TP2: 3800 – Day High
✅ TP3: 3840–3860 – Upper OB / Final Target
🔍 SMC Confluences:
✔️ BOS & CHOCH confirmed
✔️ Liquidity resting below Day Low
✔️ OB + FVG align at entry zones
✔️ Targeting liquidity above Day High and Strong OB zone
If price sweeps liquidity and gives bullish confirmation (LTF BOS or engulfing), this trade offers excellent RR potential. Ideal for smart money traders waiting for precision entries.
⚠️ Disclaimer:
This analysis is for educational purposes only. Please use proper risk management. Not financial advice.
ARKK: The Calm Before the Innovation Storm -ALTSEASON Is COMING🚀 ARKK: The Calm Before the Innovation Storm 🌪️
The markets are shifting, and disruption is about to go vertical. ARK Innovation ETF (ARKK) is quietly positioning itself for what could be the most explosive move of this decade. With high-conviction bets in AI, Bitcoin, genomics, and next-gen tech, this isn’t just a fund—it’s a launchpad for exponential growth.
This post breaks down exactly why ARKK could go parabolic—and why the smart money is already moving in. 👇
Explosive upside in 2026
ARKK is already up over 24% YTD , showing strong momentum compared to broader markets and signaling early stages of a potential parabolic move .
High-conviction concentration in game-changers
Top 10 holdings include Tesla, Roku, Zoom, Coinbase, UiPath, Block, Crispr Therapeutics, DraftKings, Shopify, and Exact Sciences. These are leaders in innovation sectors with massive upside potential .
Deep exposure to Bitcoin and digital assets
Heavy allocation to Coinbase and Block gives indirect exposure to Bitcoin . If BTC breaks into a new cycle high , ARKK stands to benefit significantly.
Positioned in exponential growth sectors
Focus on AI, genomics, EVs, fintech, robotics, and blockchain , all of which are entering accelerating adoption phases globally.
Aggressive smart-money accumulation
Cathie Wood’s team continues buying aggressively during dips, reinforcing institutional confidence in the fund’s long-term trajectory.
Technical breakout structures forming
Ascending triangle and multi-month consolidation breakouts suggest a technical setup primed for explosive upside .
Innovation supercycle aligning
ARKK's themes are aligned with major global shifts like de-dollarization, decentralized finance, and AI convergence .
High beta = massive upside leverage
With a beta above 2 , ARKK tends to outperform in bull runs , offering leveraged exposure to innovation without the need for margin.
Resurgence of top holdings
Names like Coinbase, Tesla, Shopify, and Roku are up 50%–100% YTD , driving ARKK’s NAV growth and fueling bullish sentiment .
Long-term vision with short-term catalysts
The fund projects 5x returns over the next five years , while Bitcoin halving cycles, tech innovation, and regulatory clarity serve as short-term ignition points .
Marty Boots | 17-Year Trader — smash that 👍👍, hit LIKE & SUBSCRIBE, and share your views in the comments below so we can make better trades & grow together!

ETHUSD Will Fall! Short!
Take a look at our analysis for ETHUSD.
Time Frame: 1D
Current Trend: Bearish
Sentiment: Overbought (based on 7-period RSI)
Forecast: Bearish
The market is approaching a key horizontal level 3,555.51.
Considering the today's price action, probabilities will be high to see a movement to 3,087.51.
P.S
Please, note that an oversold/overbought condition can last for a long time, and therefore being oversold/overbought doesn't mean a price rally will come soon, or at all.
Disclosure: I am part of Trade Nation's Influencer program and receive a monthly fee for using their TradingView charts in my analysis.
Like and subscribe and comment my ideas if you enjoy them!

Strategy Idea: “React, Don’t Predict” ETH at Decision ZoneHey Traders, Ethereum recently made a strong move up to around $3,600. Now it’s slowing down, and we’re at a key decision point. Two things can happen from here:
Option 1 – Pullback:
If the price drops, watch the $3,200–$3,300 zone. That area could act as support. If a strong bullish candle forms there (on the daily or 4H chart), it could be a good buying opportunity.
Option 2 – Breakout:
If ETH stays above $3,550 and breaks the recent high with strong momentum, price could move toward $3,800 or even $4,000. Only buy if the breakout is clear and strong.
Basic Plan for New Traders:
Wait for confirmation before entering
Don’t buy the top
Use stop loss to manage risk
Only risk what you can afford to lose
Be patient. No setup = no trade
Reminder:
We don’t predict, we react. Let the chart show the move, then decide. Stay safe and stick to your plan.
Don't forget to follow me, boost this content, and comment if you like this strategy idea or have any questions.
-Neo
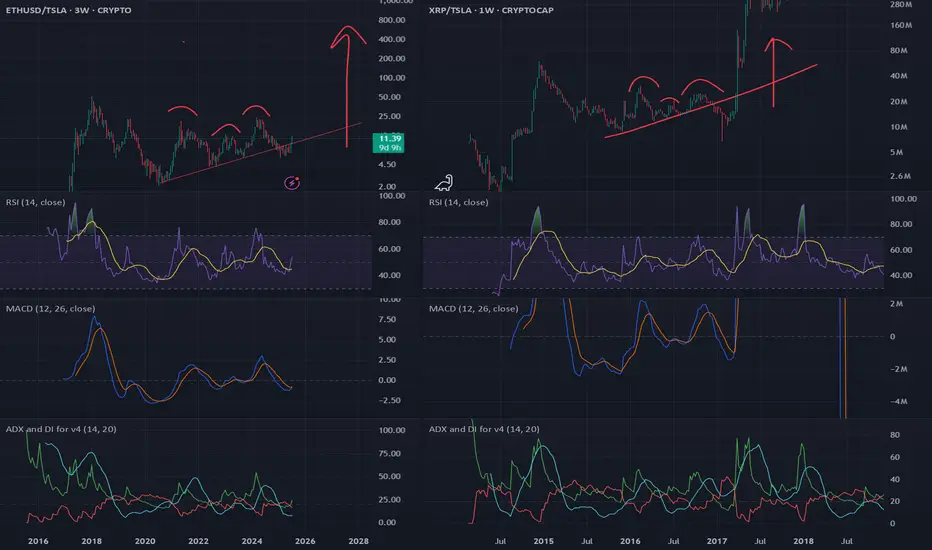
ETHEREUM Massive Triangle break-out ahead??Ethereum (ETHUSD) has been trading within a 4-year Triangle for the entirety of this Cycle. The recent post April rally has been the most aggressive since the parabolic rally that led to the Top of the previous Cycle.
The price is now almost on the top (Lower Highs trend-line) of the Triangle. A break above it, can initiate an aggressive Bullish Leg towards the 1.618 Fibonacci extension ($8000), which was the level that was marginally exceeded during ETH's first rally of this Cycle.
-------------------------------------------------------------------------------
** Please LIKE 👍, FOLLOW ✅, SHARE 🙌 and COMMENT ✍ if you enjoy this idea! Also share your ideas and charts in the comments section below! This is best way to keep it relevant, support us, keep the content here free and allow the idea to reach as many people as possible. **
-------------------------------------------------------------------------------
💸💸💸💸💸💸
👇 👇 👇 👇 👇 👇

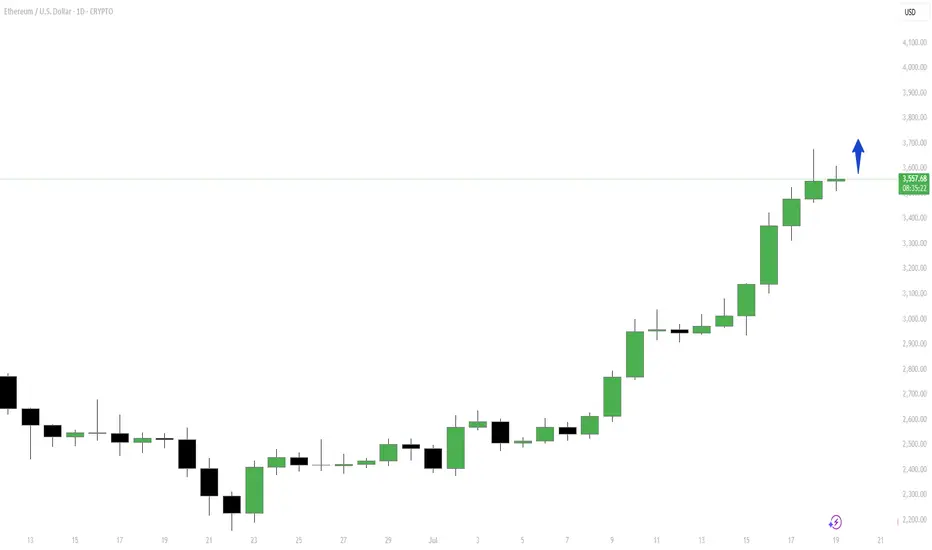
Ethereum - Finally new all time highs!🔬Ethereum ( CRYPTO:ETHUSD ) will break out now:
🔎Analysis summary:
For more than four years, Ethereum has overall been moving sideways. However now Ethereum is once again retesting previous all time highs and preparing a bullish breakout. Multiple retests are generally considered bullish so the breakout is very likely to happen any time soon.
📝Levels to watch:
$4.000
🙏🏻#LONGTERMVISION
SwingTraderPhil

ETH/USD (1H) – Smart Money OutlookCurrent price reacting near a key demand zone ($3,510–$3,525) after a confirmed BOS + CHoCH, signaling a shift in momentum.
🔍 Two Key Scenarios:
🟣 Bullish Case:
Price holds above current OB & shows bullish intent
Possible long setups targeting:
TP1: $3,600 (pullback zone)
TP2: $3,740 (bearish OB)
TP3: $3,800+ (liquidity sweep at Day High)
🟠 Bearish Case:
Clean break below $3,510 without bullish reaction
Bearish continuation toward POI zone $3,360–$3,400
📌 Key SMC Concepts Applied:
Order Blocks (OBs)
CHoCH & BOS structure shift
Liquidity Zones (SSL/Day High/Day Low)
RSI & MACD Confluence
📚 Bias: Bearish to Neutral — Wait for bullish rejection or clear break.
⚠️ Note: Trade with confirmation, not assumption. Stay disciplined!

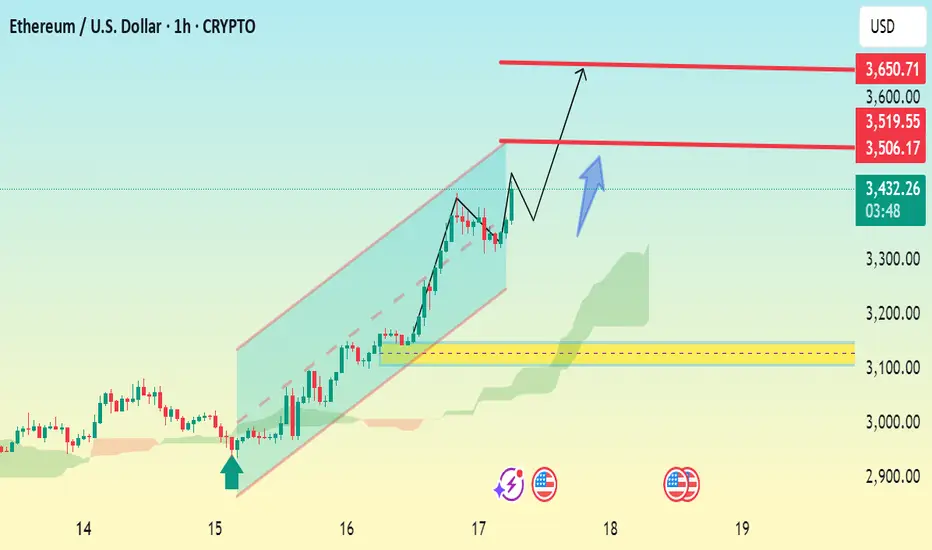
ETHUSD 1h Bullish Reversal SetupChart Analysis Summary:
Current Price:
$3,429.21 (at the time of the screenshot)
Trend:
Strong uptrend within a bullish ascending channel.
Price has been respecting the trendline and moving upward steadily.
Key Chart Patterns & Tools:
Ascending Channel: ETH is trading within an upward sloping channel, suggesting bullish momentum.
Ichimoku Cloud (green): Price is trading well above the cloud, reinforcing bullish sentiment.
Breakout Structure: The chart shows a small consolidation/pullback with a projected bullish breakout.
📈 Key Levels:
Type Price Level (USD) Notes
Current 3,429.21 Live price
Resistance 1 3,506.17 Minor resistance
Resistance 2 3,519.55 Immediate breakout target
Final Target 3,650.71 Major resistance and potential price objective
🧭 Price Action Forecast:
If ETH holds above $3,429 and breaks above $3,519.55, the path toward $3,650 remains open.
A small pullback (as indicated by the blue arrow) is expected before continuation.
As long as price remains within or near the ascending channel, the bullish scenario .
✅ Bullish Confirmation:
Break and retest of $3,519.55.
Continued support above the Ichimoku cloud.
Holding the trendline from the ascending channel.
ETH BUY SETUP ,Bought From $3720ETH BUY SETUP
Currently $3720
Bought From $3720
(Trading plan If ETH go down
to $3630 will add more longs)
Expecting target $3830 OR ABOVE
In the event of an early exit,
this analysis will be updated.
Its not a Financial advice

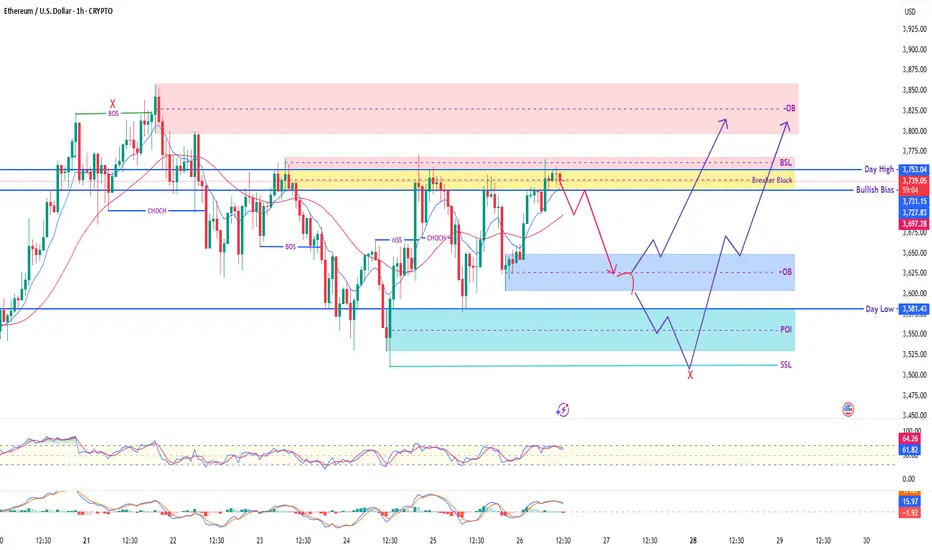
ETH/USD - Ethereum's Next Move? Decoding Price Action! Hey TradingView Family! 👋 Get ready to dive deep into our latest 1-hour Ethereum (ETH/USD) chart analysis. We're tracking some fascinating price action and key Smart Money Concepts that could dictate ETH's next big move!
What We're Seeing Right Now:
Current Price Zone: ETH is currently consolidating around the $3,730 - $3,750 area, right within a critical zone.
Breaker Block in Play: Notice the yellow 'Breaker Block' zone (around $3,700 - $3,750). This was previously support and is now being retested, acting as potential resistance. A break above could signal strength, while rejection confirms weakness.
Liquidity Magnets:
BSL (Buy Side Liquidity) 🎯: Just above us, around $3,750 - $3,770, lies a pool of buy-side liquidity. Price often targets these zones to fuel its next move.
SSL (Sell Side Liquidity) 📉: Down below, near $3,510 - $3,520, we have sell-side liquidity. This is a potential magnet if bearish momentum takes over.
Key Zones to Watch:
Upper Order Block (Red OB) 🔴: Our primary supply zone overhead, from $3,800 to $3,850. This is where we might see strong selling pressure if price reaches it. Also marked with a 'New High' for extra context.
Lower Order Block (Blue OB) 🔵: A potential demand zone below, roughly $3,600 - $3,650. This could act as strong support for a bounce.
Point of Interest (POI - Light Blue) ✨: An even deeper demand zone around $3,540 - $3,590. This area could provide robust support if price continues to drop.
Potential Scenarios (Follow the Purple Arrows! 🔮):
Bullish Path (Uptrend Continuation) 🚀: If ETH can definitively break and hold above the 'Breaker Block' and clear the BSL, we could see a strong push towards the Upper Order Block ($3,800 - $3,850). This would align with a continuation of the bullish bias we've seen.
Bearish Path (Pullback & Reversal) ⬇️: If the 'Breaker Block' holds as resistance, we might see a pullback. Price could find support at the Lower Order Block ($3,600 - $3,650) for a bounce. However, a break below this could lead to a test of our POI ($3,540 - $3,590), and potentially a sweep of the SSL ($3,510) before finding a true bottom.
Indicators Check:
RSI: Currently around 67, indicating strong momentum but approaching overbought conditions.
Stochastic: Showing an upward trend, confirming current bullish sentiment but also nearing the top.
Our 'Day High' ($3,757) and 'Day Low' ($3,581) are crucial pivot points to monitor!
Always remember to trade smart, manage your risk, and wait for confirmation. This is not financial advice. Do your own research! 🛡️📊
Don't forget to Like 👍, Comment 💬, and Follow for more detailed analyses!
#ETH #Ethereum #Crypto #Trading #TechnicalAnalysis #SmartMoneyConcepts #PriceAction #ETHUSD #TradingSetup #MarketAnalysis"
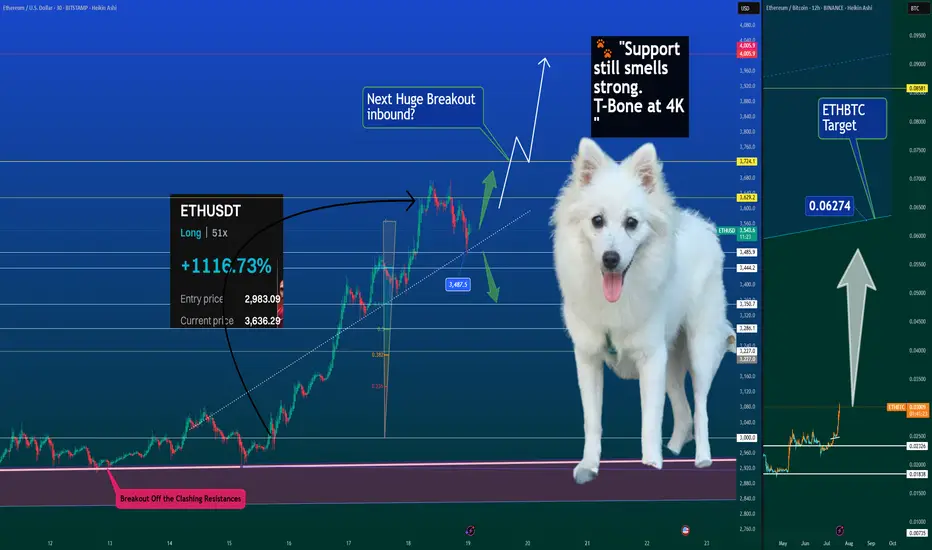
Is ETH Season Officially Here? 🚀🐾 Ethereum Breaking Out – Is ETH Season Officially Here? 📈💥
Ethereum is showing strength across the board — outperforming Bitcoin, reclaiming trendline support, and eyeing a possible breakout continuation. While macro narratives swirl (crypto legislation, rate cut vibes, political tailwinds), ETH is finally doing what ETH does best — lead.
📊 Chart Breakdown:
ETHUSDT is respecting the dotted trendline off the breakout.
Price is hovering around $3487 support, an area that aligns with Fib retracement and the last impulse base.
If bulls can maintain structure, $4000–$4050 is a natural magnet above.
📈 On the ETHBTC side, we’re aiming for the 0.06274 level — this ratio breakout is classic ETH season behavior, where Ethereum not only rises but pulls the rest of the market with it.
👀 And yes… even Elon my Dog is sniffing this one out:
🐾 "Support still smells strong. T-Bone at 4K." Then we go higher for the Cow.
📊 Order Flow Data Confirms:
Premium: Still slightly negative — market hasn’t fully rotated in.
Funding: Light and positive — sustainable, not euphoric.
Open Interest: Saw a soft reset — leverage was cleared out, opening room to rally.
Spot volume: Steady and supportive, not chasing.
🔥 +1116% ROI from the last long from $2,983.09. If you’re holding ETH — you’re holding the mic right now. Let's not drop it.
This could just be the beginning — and when ETH leads, the rest tends to follow.
Elon and the whole 🐶 Dog Team are on high alert. Breakout energy is thick.
One Love,
The FXPROFESSOR 💙
Disclosure: I am happy to be part of the Trade Nation's Influencer program and receive a monthly fee for using their TradingView charts in my analysis. Awesome broker, where the trader really comes first! 🌟🤝📈
ETH eyes on $3431.83: Golden Genesis fib may END this SurgeETH finally got a surge after a long consolidation.
But has just hit a Golden Genesis fib at $3431.83
Like hitting a brick wall, it is now staggering back.
It is PROBABLE that we orbit this fib a few times.
It is POSSIBLE that we reject here to end the surge.
It is PLAUSIBLE that we Break-n-Retest to continue.
We were here at this EXACT spot 8 months ago:
=============================================
.

ETHEREUM: THE NEW BOND OF THE DIGITAL WORLDPrice isn’t the goal. Price is the side effect.
Meanwhile, BlackRock - a black hole with a trust-backed logo - just absorbed 42,000 ETH more.
Yesterday, you may have read this "regular" headline:
BlackRock increases its Ethereum exposure to $4 billion, adding $109.5 million via ETFs.
But here’s what you missed: there are no random numbers on the market.
When a player like this moves - it’s not hype. It’s a blueprint for the future.
Ethereum is no longer an altcoin.
It’s no longer speculation. It’s a financial infrastructure, already recognized by law, exchanges, and institutions.
What does this mean?
💡 Ethereum is now a digital bond - with yield flowing from blocks.
Profit is no longer built on promises, but on the structure of the chain itself.
Trust lies not in faces, but in code.
Growth is not artificial — it’s architectural.
And here’s why this is terrifyingly beautiful:
While you sleep, they are building an era.
Each ETF purchase removes ETH from circulation - permanently. Because:
✅ This ETH is gone from the open market
✅ It won’t be panic-sold
✅ It becomes income-bearing collateral, not a speculative asset
Still waiting for an entry signal?
The big players are already in.
This is no longer crypto - this is cash flow infrastructure, embedded into the digital economy.
And when pension funds, insurers, and sovereign investors move into Ethereum - they will come via ETFs.
Not because it’s trendy, but because it’s regulated, stable, and profitable.
📉 When institutional demand meets vanishing supply - the price won’t simply rise. It will explode, not as growth, but as a structural liquidity shift.
Ethereum is:
💸 Staking = passive yield
🔗 Backbone of DeFi
🖼 Fuel for NFTs
⚙️ Millions of transactions per second
⚖️ A regulated ETF asset
This is the new digital bond system, where the bet isn’t on the dollar - it’s on ETH as an income-producing asset.
💥 While you're reading this, the game is already on.
ETFs are rewriting the rules of time-ownership.
No hype. Just filings. Just intention.
Best regards EXCAVO


Moon SoonThe Genius Act passing and other regulatory tailwinds pave the way for the US financial system and the rest of the world to slowly migrate over to blockchain infrastructure via Ethereum. The demand relative to supply imbalance will force ETH to re-rate aggressively over coming months and years

Eth next bottom before the next leg upIn a bull market the average retrace
is between .2 -.4 Fib from the bottom
of that run.
Several factors of confluence lead me
to believe Eth will hit my red T1 target,
bounce to the top of current range (green T1)
then drop to a minimum of .35 Fib = $2990

ETH/USD Long Setup Targeting $3,790ETH/USD 1H Trade Setup:
Price is currently at $3,748.5 with a long (buy) setup targeting $3,790.9. The stop loss is set at $3,725.4, aiming for a breakout to the upside within a tight consolidation range.

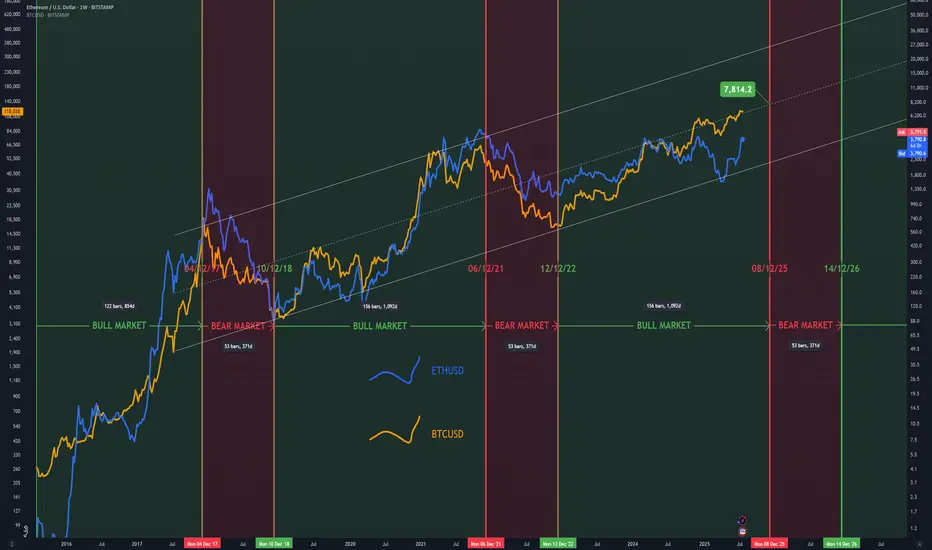
Realistic ProjectionThis is the more realistic approach for the Bull Cycle. Using both ETHUSD and BTCUSD and using their BEAR and BULL durations, this provides us with a December peak, with ETHUSD topping at the middle of the channel in the $7.5-8k range.