ETHEREUM Massive rally up ahead.Ethereum (ETHUSD) is trading on its 1M MA50, having recovered half of the Trade War losses. Still underperforming against most of its peers but as we've entered the 2nd half of the year, the traditional Bull Cycle rally is up ahead. We expect at least a 0.5 Fibonacci level test of the Channel Up, targeting 7500.
-------------------------------------------------------------------------------
** Please LIKE 👍, FOLLOW ✅, SHARE 🙌 and COMMENT ✍ if you enjoy this idea! Also share your ideas and charts in the comments section below! This is best way to keep it relevant, support us, keep the content here free and allow the idea to reach as many people as possible. **
-------------------------------------------------------------------------------
💸💸💸💸💸💸
👇 👇 👇 👇 👇 👇
ETHUSD trade ideas

ETHUSD 4H Chart | ETH Bearish SetupThis chart highlights a possible bearish breakdown scenario for Ethereum (ETHUSD) on the 4H timeframe.
🔍 Key Levels:
Breakdown Confirmation Level: $2,362
Target 1: $2,151
Target 2: $1,954
(Optional Target 3: $1,750 if added)
📉 After multiple failed attempts to break above resistance, ETH price is now testing a critical support zone. A confirmed breakdown below this level could trigger further downside towards the mentioned targets.
Ichimoku Cloud shows weakening bullish momentum, supporting the potential for a bearish move.
Use Proper Money Management

Ethereum/US Dollar 4-Hour Chart (BINANCE)4-hour price movement of Ethereum (ETH) against the US Dollar (USD) on the BINANCE exchange. The current price is $2,211.36, reflecting a decrease of $85.21 (-3.71%). The chart highlights a recent downward trend with a potential support zone between approximately $2,100 and $2,200, followed by a possible upward movement as indicated by the shaded area. The data is captured as of June 23, 2025.

ETHEREUM Risky Long! Buy!
Hello,Traders!
ETHEREUM is consolidating
Above the horizontal support
Area around 2360$ and we
Are already seeing a local
Rebound from the level
So as we are bullish biased
A further price growth
Is to be expected
Buy!
Comment and subscribe to help us grow!
Check out other forecasts below too!
Disclosure: I am part of Trade Nation's Influencer program and receive a monthly fee for using their TradingView charts in my analysis.

Ethereum - This structure decides everything!Ethereum - CRYPTO:ETHUSD - trades at a key structure:
(click chart above to see the in depth analysis👆🏻)
After Ethereum retested the previous all time high in the end of 2024, we saw quite a harsh move lower. This move was followed by an expected recovery, however Ethereum is still trading below a key structure. Either move is still possible and will shape the future of Ethereum.
Levels to watch: $2.500, $4.000
Keep your long term vision!
Philip (BasicTrading)

ETHUSD Break- Test- GO!!! Nothing Changed! 3rd EditionI have been warning about this for some time. Please visit my previous two posts for more info and updates.
Magic!
Click boost, follow, and subscribe for more. Let's get to 5,000 followers ))

Strong bearish momentum for EthereumCOINBASE:ETHUSD Expecting bearish continuation for Ethereum. Consolidation around 2100 and either a push downward to 1900 - 1800 or if peace is made with Iran and Israel, price could reverse and push back to the 2000 range. Let me know your thoughts everyone :)

You won't see ETHUSD cheaper than this, I'm buying at 3290Any price below 3300 is okay if the stop loss is still in place. The probability of this trade playing out is very high. Almost everybody is also bearish now. So I'm very comfortable in this trade
TP1 @ 2700
TP2 @ 3000
TP3 @ 5000

ETH one more Dump Before Parabolic Move!We see the 200 EMA crossing the 50 EMA which is a bearish sign, also eth is respecting the descending broadening wedge formation that has played out. I see eth doing one more dive to collect the vector zones mapped out below our current price action, and bouncing around 1900 before going absolutely insane this will be one last scary drop to shake out the weak hands and trap all the late longs from the runup from 1800 to about 2600. This will wreck all the people who bought between 2400-2800 and cause them to sell, allowing big players to buy more Eth at low prices before the altseason kicks in full gear by late summer.

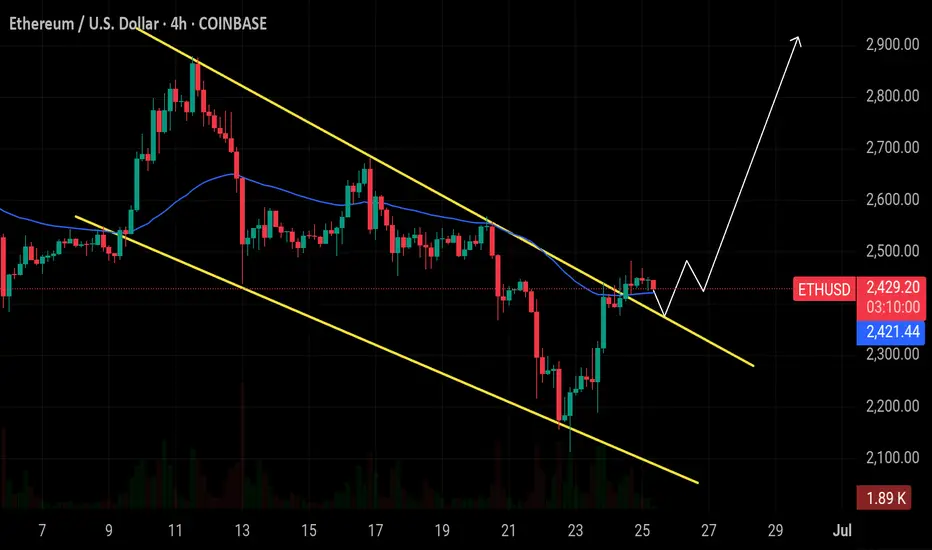
$ETH 4H Falling Wedge Breakout: Ethereum has successfully brokeCRYPTOCAP:ETH 4H Falling Wedge Breakout:
Ethereum has successfully broken out of a clear falling wedge pattern on the 4-hour timeframe, signaling a potential trend reversal from bearish to bullish. ✅
🔸 Support at $2,400 – $2,380:
After the breakout, ETH is holding above the wedge and this support area. This zone will be crucial for confirming the breakout's strength.
🔸 Upside Target: $2,800
If momentum continues, ETH could rally toward $2,600 first, followed by a move to the $2,800 level as shown by the projection in the chart.
🔸 Risk Level at $2,300:
If ETH dips below $2,300 and re-enters the wedge, it could invalidate the breakout setup and lead to downside pressure.
🔸 Outlook:
Watch for a retest of the breakout trendline (around $2,420) with bullish confirmation (like a strong wick or engulfing candle) to consider long positions. Target higher levels gradually while managing risk.
Bullish bounce off 50% Fibonacci support?The Ethereum (ETH/USD) is reacting off the pivot which has been identified as an overlap support and could bounce to the 1st resistance.
Pivot: 2,089.45
1st Support: 1,669.20
1st Resistance: 2,687.43
Risk Warning:
Trading Forex and CFDs carries a high level of risk to your capital and you should only trade with money you can afford to lose. Trading Forex and CFDs may not be suitable for all investors, so please ensure that you fully understand the risks involved and seek independent advice if necessary.
Disclaimer:
The above opinions given constitute general market commentary, and do not constitute the opinion or advice of IC Markets or any form of personal or investment advice.
Any opinions, news, research, analyses, prices, other information, or links to third-party sites contained on this website are provided on an "as-is" basis, are intended only to be informative, is not an advice nor a recommendation, nor research, or a record of our trading prices, or an offer of, or solicitation for a transaction in any financial instrument and thus should not be treated as such. The information provided does not involve any specific investment objectives, financial situation and needs of any specific person who may receive it. Please be aware, that past performance is not a reliable indicator of future performance and/or results. Past Performance or Forward-looking scenarios based upon the reasonable beliefs of the third-party provider are not a guarantee of future performance. Actual results may differ materially from those anticipated in forward-looking or past performance statements. IC Markets makes no representation or warranty and assumes no liability as to the accuracy or completeness of the information provided, nor any loss arising from any investment based on a recommendation, forecast or any information supplied by any third-party.

ETHUSD: Waiting for one last breakout.Ethereum remains neutral on its 1D technical outlook (RSI = 48.083, MACD = -39.26, ADX = 21.833), failing so far to close over its 2W MA50, where it's been rejected in the past 3 candles. The last Resistance before the price starts the parabolic rally is the P1 trendline. The price has been trading over it for the majority of this Cycle and only broke under it during the recent Tariff War. A breakout there, extends the Cycle to possibly at least a +346.99% rally from the bottom (TP = 6,200).
## If you like our free content follow our profile to get more daily ideas. ##
## Comments and likes are greatly appreciated. ##

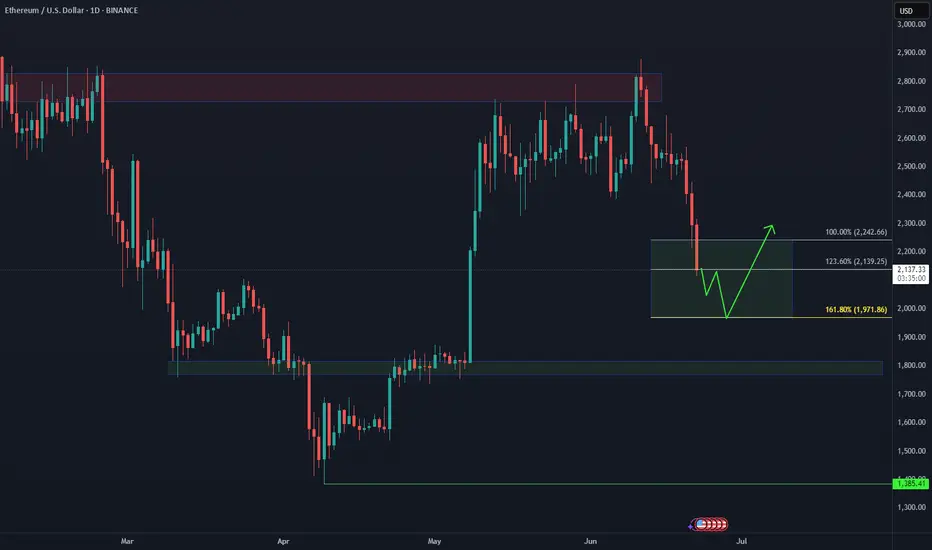
Ethereum: How Deep Into the Buying Area?📉 CRYPTO:ETHUSD is currently testing the extreme buying zone $2140–$1970 — a key area where a bullish reaction is anticipated. But if the bounce fails to materialize next week, eyes shift to the next potential demand zone near $1800.
This level aligns with prior structure and could offer a stronger base for the next leg higher — as long as the broader structure remains intact.
bearish reversal off pullback resistance?The Ethereum (ETH/USD) has rejected off the pivot and could drop to the 1st support that aligns with the 61.8% Fibonacci retracement.
Pivot: 2,483.49
1st Support: 2,289.88
1st Resistance: 2,587.09
Risk Warning:
Trading Forex and CFDs carries a high level of risk to your capital and you should only trade with money you can afford to lose. Trading Forex and CFDs may not be suitable for all investors, so please ensure that you fully understand the risks involved and seek independent advice if necessary.
Disclaimer:
The above opinions given constitute general market commentary, and do not constitute the opinion or advice of IC Markets or any form of personal or investment advice.
Any opinions, news, research, analyses, prices, other information, or links to third-party sites contained on this website are provided on an "as-is" basis, are intended only to be informative, is not an advice nor a recommendation, nor research, or a record of our trading prices, or an offer of, or solicitation for a transaction in any financial instrument and thus should not be treated as such. The information provided does not involve any specific investment objectives, financial situation and needs of any specific person who may receive it. Please be aware, that past performance is not a reliable indicator of future performance and/or results. Past Performance or Forward-looking scenarios based upon the reasonable beliefs of the third-party provider are not a guarantee of future performance. Actual results may differ materially from those anticipated in forward-looking or past performance statements. IC Markets makes no representation or warranty and assumes no liability as to the accuracy or completeness of the information provided, nor any loss arising from any investment based on a recommendation, forecast or any information supplied by any third-party.

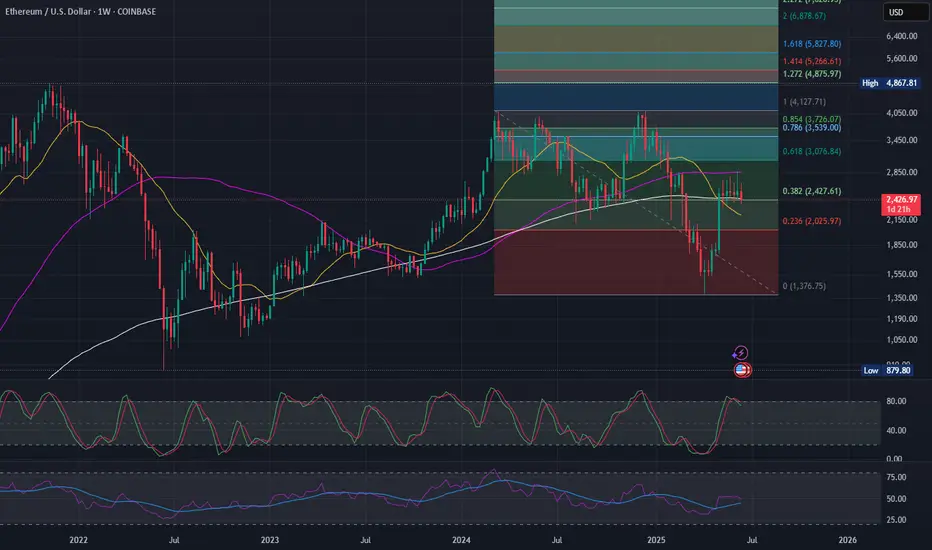
Ethereum (ETH/USD) Weekly Chart Trend Analysis Ethereum (ETH/USD) Weekly Chart Trend Analysis Using Trendline, Fibonacci, and Technical Indicators
In this article, we analyze the overall trend of Ethereum (ETH) against the U.S. Dollar (USD) based on the weekly chart using essential technical tools such as trendlines, Fibonacci retracement/extension, moving averages, and key indicators. These tools help identify support and resistance levels, price momentum, and potential medium- to long-term scenarios.
1. Trendline Analysis
In the weekly chart, the trendline shown with a dashed gray line acts as a key resistance. This line is drawn from the early 2024 high around $4,127 to the late 2024 low near $1,376. This downtrend line reflects continued bearish pressure over several months.
Recently, ETH attempted to breach this trendline. Price has touched or hovered around the line a few times, but weekly candles have not decisively closed above it. A confirmed breakout with multiple weekly closes above this trendline would signal a potential shift from a downtrend to an uptrend.
2. Fibonacci Retracement and Extension Analysis
The Fibonacci retracement tool was applied from the low of $1,376 to the high of $4,127. Key levels are:
0.236 (~$2,026): First major support level after a significant pullback. ETH bounced strongly from here.
0.382 (~$2,428): Current key resistance where price is consolidating. A close above this level would open the path to higher targets.
0.618 (~$3,077): A popular target level in bullish retracements.
1.0 (~$4,127): The previous cycle high. A breakout here would establish a Higher High pattern.
Extension levels (1.272, 1.618, 2.0): Used to project long-term bullish targets beyond the previous high. These lie at $4,875 / $5,828 / $6,878 respectively.
3. Moving Averages (EMA) Analysis
The chart features Exponential Moving Averages:
EMA 10-week (yellow): Tracks short-term trends. Currently flattening.
EMA 50-week (purple): Serves as a medium-term resistance. Price is hovering near this level.
EMA 200-week (white): A long-term structural support. ETH remains above this, indicating it has not yet entered a full bearish market phase.
Holding above the EMA 200 is a positive structural sign, while the flattening of EMA 10 may hint at short-term buying exhaustion.
4. Indicator Analysis
Stochastic RSI: Currently in the Overbought zone with a bearish crossover, indicating a possible short-term pullback.
RSI (Relative Strength Index): Formed a bullish divergence from the recent lows and is slowly climbing. However, it is still below the 55 level, suggesting the uptrend momentum is not yet fully confirmed.
5. Trend Scenarios and Strategic Outlook
Scenario 1: Bullish Continuation
Condition: Price closes above $2,428 and EMA 50.
Next Targets: $3,077 / $3,539 / $4,127
Strategy: Consider long positions on pullbacks above $2,428.
Scenario 2: Sideways Consolidation
Condition: Price remains between $2,026 and $2,850.
Strategy: Range trading — buy near $2,050 and sell near $2,800-$2,850.
Scenario 3: Bearish Breakdown
Condition: Price breaks below $2,026 and EMA 200 decisively.
Downside Targets: $1,650 / $1,500 / $1,376
Strategy: Stay in cash or open short positions with proper risk management.

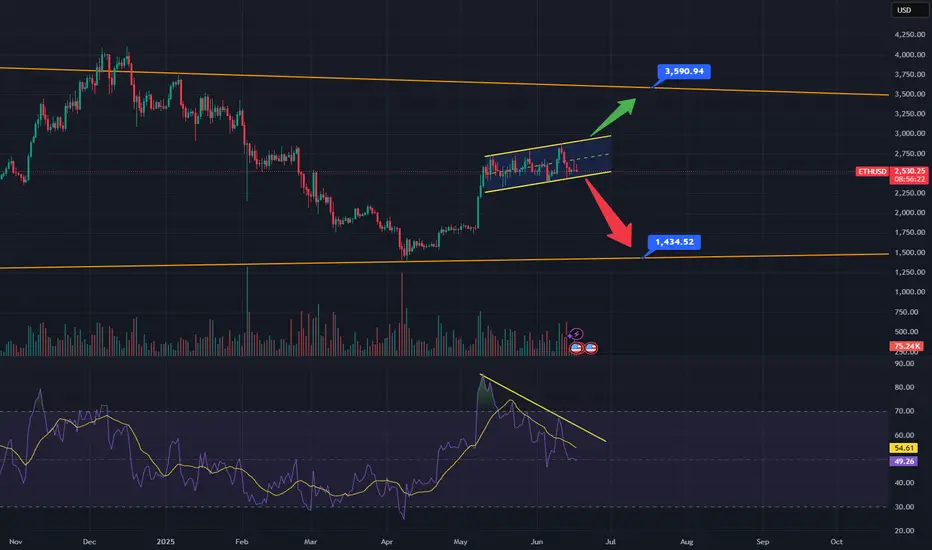
ETH: Breakout or Breakdown?As you can see ETH has been trading inside of this rising channel since the beginning of May. Rising channels favor a break to the downside, I've also highlighted some bearish divergence on the RSI which also points to a move down. The orange lines are long term weekly trend lines. The bottom orange line connects the 2022 lows through to the April lows, if price breaks down, expect a retest of the underside of the channel before moving down to the orange line around $1435. This would only be the third hit and third hits rarely breakdown. If it defies logic and breaks out above, look for it to move up to the top orange line around $3600, which connects the 2021 bull market highs through the march 24', May 24' and December 24' highs. If it comes into this area, it would be a 5th hit of a major weekly trendline, 5th hits have a very high probability of breaking out to the upside, if this happens it would be very bullish. In this scenario I would expect ETH to come down and test the top of said trendline as support before moving to new all-time highs. A Fibonacci retracement from the 2020 lows to the 2021 highs would put new price targets at $6,670 at the -0.382 as well as $7,800 at the -0.618.

ETHUSD - Bearish Breakout from Ascending Channel
On the 4H chart, ETH/USD has broken decisively below a long-standing ascending channel as well as the critical support zone at $2447.81. This breakdown indicates increased bearish pressure after a prolonged sideways movement between dynamic resistance and support.
The price is currently trading below both the trendline and previous horizontal support, confirming a bearish shift in market structure.
Key Levels:
Resistance 1: $2447.81
Resistance 2: $2554.91
Support 1: $2310.72
Support 2: $2180.05
Scenario:
If this bearish momentum persists, I expect the price to continue toward Target 1: $2310.72 and potentially extend to Target 2: $2180.05.
However, if price reclaims $2554.91, this bearish view would be invalidated, and we may see a shift back toward the upper range.
This setup offers a clean risk-to-reward profile with clearly defined invalidation and targets. Always manage your position size and risk accordingly.

ETHUSD - Could ETH hit $800 before the next bull run?ETHUSD looks very bearish in my opinion. Strong bearish divergence on the MACD. Any substantial time ETH has stayed under the MACD zeroline has lead to very bearish price action. This price recovery is currently hitting very strong resistance area. With the Israel/Iran war looming, and the deflationary crash risks with oil dumping, I'm getting very defensive sentiment at this moment. I'll be in cash until we get further confirmation on the price action.

ETH/USDT 4H – Bearish Breakout OpportunityA symmetrical triangle pattern has formed and recently broke out to the downside, indicating a potential short-selling opportunity. We've marked the Sell Entry Point and the Target Point at $2,174.07 based on the pattern projection. Price action confirms the move,
Risk management is key – trade responsibly!
👥 Share your thoughts in the comments below – I’d love to hear your opinion on this setup.
❤️ If you found this idea useful, don’t forget to like and support!

ETHUSD is moving within the 2110.00 - 2550.00 range 👀 Possible scenario:
Ethereum is trading near $2,250 after briefly dipping to $2,120. Price recovered slightly, climbing above the 23.6% Fib retracement from the $2,568 high. Whale activity signals confidence, with a $101M long opened at $2,247. Other ETPs saw $124M in weekly inflows, extending a 9-week streak to $2.2B.
Despite geopolitical tensions and cautious sentiment, ETH ETPs saw $124M in weekly inflows—marking nine straight weeks of gains. One whale opened a $101M leveraged long at $2,247, showing strong conviction. Still, 64% of top traders remain short, expecting more downside unless the Middle East crisis eases.
✅ Support and Resistance Levels
Support level is now located at 2,110.00.
Now, the resistance level is located at 2,550.00.

ETHEREUM Battling to hold its 1D MA50.Ethereum (ETHUSD) has been trading within a 5-week Channel Up pattern and in the past 2 days almost tested its 1D MA50 (blue trend-line). So far this is holding, showcasing the strong presence of buyers in that price region, which also happens to be the bottom of that Channel Up.
Ahead of a 1D Golden Cross that may potentially be formed in a week or so, this is the strongest buy signal we get since the April 09 bottom. Given also that the price is trading close to the 0.5 Fibonacci retracement level from the December 16 2024 High, the upside potential is significant. The obvious medium-term Target is that High at 4100.
-------------------------------------------------------------------------------
** Please LIKE 👍, FOLLOW ✅, SHARE 🙌 and COMMENT ✍ if you enjoy this idea! Also share your ideas and charts in the comments section below! This is best way to keep it relevant, support us, keep the content here free and allow the idea to reach as many people as possible. **
-------------------------------------------------------------------------------
💸💸💸💸💸💸
👇 👇 👇 👇 👇 👇
