ETH/USD BUY SETUP 1-HOUR Based on the chart we provided (ETH/USD 1H from TradingView), here’s a technical analysis for potential Take Profit (TP) and Stop Loss (SL) levels:
🟢 Buy Setup Analysis (From the yellow demand/support zone)
Entry Zone:
Around $2,556 – $2,563 (current price zone and consolidation before projected breakout)
Stop Loss (SL):
Just below the yellow support zone:
🔻 $2,320 – $2,350
(Safe buffer under the strong support area marked by blue arrows)
Take Profit Levels (TP):
1. 🥇 TP1: $2,600 – $2,610
Just below the resistance level formed previously (also at the consolidation zone)
2. 🥈 TP2: $2,735 – $2,745
Matches previous significant rejection point (marked by red arrows)
3. 🥉 TP3 (Max Target): $2,754 – $2,760
Major resistance area, strong supply zone
🔴 Risk Management Summary:
Parameter Value
Entry $2,556 – $2,563
SL $2,320 – $2,350
TP1 $2,600
TP2 $2,735
TP3 $2,754
🛡 Risk/Reward Ratio: At least 1:2 or better if targeting TP2 or TP3.
ETHUSD trade ideas

ETH ( Ethereum ) lovers looking strong for long term ETH -----Daily counts indicate Excellent bullish wave structure.
Both appear to be optimistic and this stock invalidation number (S L) wave 2 low
target short / long term are already shared as per charts
correction wave leg seems completed
Investing in declines is a smart move for short/ long-term players.
Buy in DIPS recommended
Long-term investors prepare for strong returns over the next two to five years.
one of best counter
Every graphic used to comprehend & LEARN & understand the theory of Elliot waves, Harmonic waves, Gann Theory, and Time theory
Every chart is for educational purposes.
We have no accountability for your profit or loss.

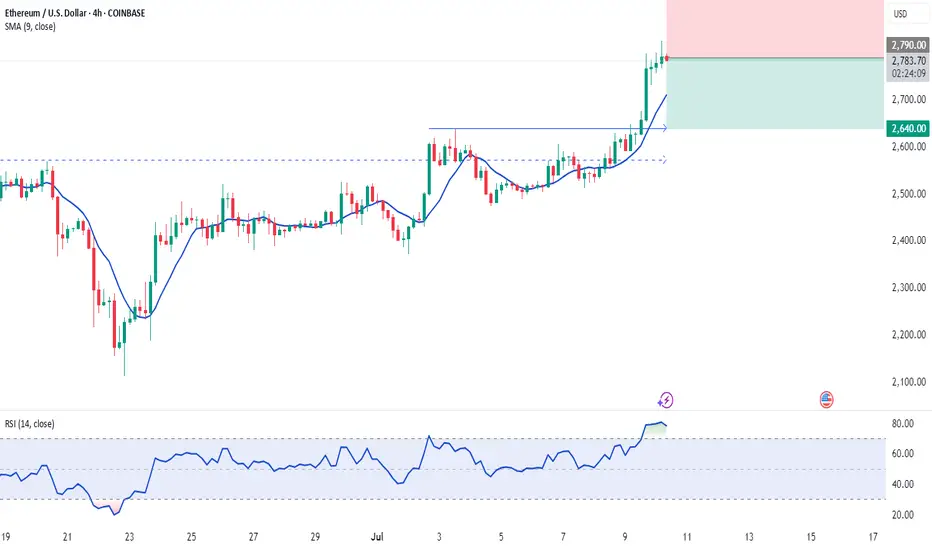
TRADING IDEA - ETHUSD SHORT
ETHUSD rose towards 2,700.00 level and reached the take profit. And even went further towards 2,800.00 resistance level despite my 2,700.00 retest predict! (pic 1)
So, congrats to everyone, who stayed long here, we took the cash!💵
I am preparing for the next trade. Here is the plan: if the price rises once again towards 2,800.0 resistance level and retests it, I will open the short position with
🔽 a pending sell stop order at 2796.84 with
❌a stop loss at 2818.86 and
🤑a take profit at 2740.05
Additionally, the RSI shows divergence on 30-m timeframe.
I suppose this to be quick trade. Will see how it will work out.
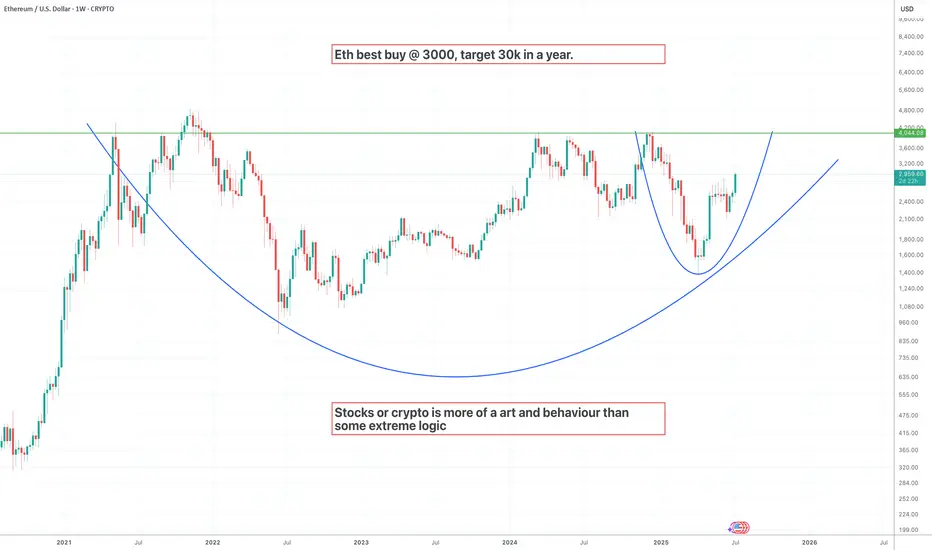
Ethusd next target 30kETH just painted the cup. Now comes the rocket. 🚀
Buy zone was $3,000 — now entering escape velocity.
🎯 Target: $30,000 within 12 months.
Crypto isn’t just logic — it’s human behavior + belief cycles.
This is art in motion. Don't blink. 👀
#Ethereum #Crypto #Altseason #BullMarket #UniproAI™
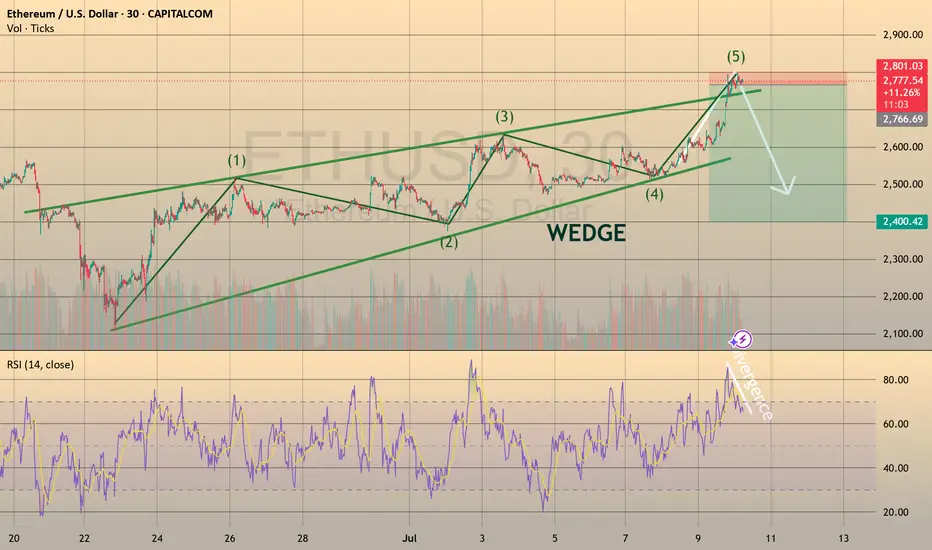
ETHUSD-SELL strategy 6 hourly chart Reg.ChannelAs usual, Crypto is highly volatile, and the crowd expectation of much higher levels, is the hype we are dealing with. Fair to say, short-term fundamentals reasons may support the current move, but technically no0w we are very overbought short-term.
Str5ategy SELL @ $ 2,940-3,000 or higher (scaling in carefully) and take profit near $ 2,725 for now.

Guys dont sell !!!It needs to go up and its, being pushed by big whales stock piling large amounts of cash.
So let it keep going. Ride it. Never sell. It will never be the same. This is the new era of ETH.
If you all go on too late for BTC, now is your chance to get on ETH and be part of the base.
It's going to recover big time. It is the best mainnet out there stable, and very versatile. It's starting to get traction more and more for its stable trajectory in the past five years.
Start loading up the truck guys.

ETH/USD Short TermA little copy paste.
Traders love their fractals... So much that they often become self-fulfilling prophecy.

ETH - Back at the Level Everyone Forgot.Everyone’s watching ETH pump right now like it’s something new. It’s not. Look closer:
This is a look back in time to the breakdown that started to slide in Jan 2025.
That clean base around $3300 was holding for months in late 2024. It failed in January Q1, dragged us to sub-$2K by March, but now we’re right back under it.
This isn’t a random pump, it’s ETH revisiting the exact area it broke down from.
• White line = previous floor that gave out
• Dotted line = current price climbing back up into that structure
A move above $2960–$3300 flips the entire structure from resistance to reclaimed floor.
Market memory’s short, but price tends to remember everything.

ETHUSD | Wyckoff Accumulation, Compression & Expansion PlaybookMapping out Ethereum’s journey through classic Wyckoff phases: from Buying Climax and Failed Test (distribution/markdown) to Spring and Accumulation (SC, creek, and “spring” event). After months of compression and failed breakout attempts, ETH unleashed its first expansion/release move, trapping late bears and rewarding patient entries.
Take note: The first expansion candle after a long coil is rarely the spot to FOMO. Best R:R comes from waiting for the retrace to the 0.618–0.786 zone, where smart money reloads and risk is tightly defined.
Key Levels:
Compression/Coil range = accumulation
Retest/retrace = sniper entry zone (purple box)
If you missed the first push, don’t chase—let the retrace come to you.
Chart markup: Wyckoff logic, supply/demand, coil/expansion, R:R zones.

ETH/SOL pair trading opGM gents, we have a nice trade setup in this pair, spotted courtesy of my RPT Reversal indicator, which you can find in my profile.
Best of luck!
Cheers,
Ivan Labrie.

ETHER PERFECT SELL FROM $2780 ,Targeting $2610 or Below ETHER PERFECT SELL FROM $2780
Targeting $2610 or Below
Next level to consider for targets $2580-70 (According to market situation)
Not a Financial advice

GO LONG ETH BEFORE "CRYPTO WEEK"Next week is "Crypto Week" in the U.S. House of Representatives. The House will consider the CLARITY Act, the Anti-CBDC Surveillance State Act, and the GENIUS Act.
Bill Helps Ethereum By...
CLARITY Act Protecting decentralized infrastructure from U.S. blacklists
Anti-CBDC Act Preserving demand for decentralized stablecoins, defending privacy
GENIUS Act Encouraging gov use of public blockchains like Ethereum
$ETH - See you later!CRYPTOCAP:ETH - See you later!
CupnHandle breakout
Volume gap up to $3400
Cupnhandle MM up to $4400+

Ethereum Breakout Is Imminent!🚀 CRYPTO:ETHUSD is approaching the June peak, and a breakout would confirm a bullish sequence in play.
Upside targets are set at $3,600 – $3,960, aligning with key Fibonacci levels and challenging the 2024 highs.

Symplegades Part II – Ethereum at the Threshold of Breakout or B⚔️🌉 Symplegades Part II – Ethereum at the Threshold of Breakout or Breakdown 💥🧭
In the previous post, we explored Ethereum’s mythical challenge — the Symplegades, or Clashing Rocks. That post resonated, and now… here comes Part II.
ETH is once again caught in a narrowing passage, this time defined by:
📌 $2,805 – $2,911 resistance overhead
📌 $2,616 – $2,565 support just below
💡 Pectra could be the fuel to break out — or just another wave that crashes on the rocks. The chart shows the potential for both:
➡️ A clean breakout could spark a move to “Destination 1” (~$4.8K)
⚠️ A rejection here might drag us back under $2.6K, even toward $2.1K and $1.8K zones
The Pectra breakout box is clear. But the market won’t hand it to us easily. It rarely does.
🧠 With Vitalik still “asleep,” it’s a tight spot. But if this move gathers momentum? We could be at the very start of Ethereum’s next wave.
📽️ The full video posted earlier today dives into this thesis and why macro + micro signals are conflicting but critical.
📊 Stay tuned — Bitcoin post is up next.
One Love,
The FXPROFESSOR 💙
Disclosure: I am happy to be part of the Trade Nation's Influencer program and receive a monthly fee for using their TradingView charts in my analysis. Awesome broker, where the trader really comes first! 🌟🤝📈

Ethereum Breakout Unleashed: Major Upside Targets in Sight The ETH/USD 2-hour chart reveals a classic ascending triangle formation, which has now been decisively broken to the upside. After consolidating within a tightening range for several sessions, Ethereum has surged past the horizontal resistance level, supported by Ichimoku cloud structure and rising trendline support. The breakout candle is strong, indicating bullish momentum and potential for further upward movement. The breakout aligns with increasing volume and market confidence. This technical setup suggests a possible rally continuation toward higher resistance zones marked above. The structure remains bullish as long as price holds above the breakout zone with minimal retracement.
Entry: 2,570
1st Target: 2660
2nd Target: 2,850

Moonboi? 👦 You have to be a LUNA-tic ''Oh Professor you are a Moonboi, you only post Long positions.''
Well Thank God everything I post (and everything you post) stays here for EVER:
Show me just ONE author with Short ideas on Luna from 110$ to 5$ (i had around 9 posts proposing shorts, needless to say you can check everything here:
and here and here
Ethereum Short positions from close to 5,000$ here:
Dip on Ethereum bough here:
I am not going to go deeper into this, there is no need, you can check how many short positions i gave on Ape from 20$ and other projects.
In a few words:
- I post what i see (and what i trade)
- In the past month I have been Bullish and switched some shorts to longs (Ethereum for example)
- I always hedge even my posts: some Long some Short
- You do your own research, what we post here is just our ideas
- Try to post something too, it's the best way to make Tradingview better! Would be happy to give you my 5 cents of advise on any chart
And yes, remember to hedge but also remember to pick a side and stick with it... like right now: I have been LONG since this:
PS. all the Gurus/experts on Twitter: post some Tradingview ideas sometime..best feature of Tradingview is that EVERYTHING stays documented.
Twitter? OMG! It's a different story! I feel SO sorry for people looking at Twitter and Youtube and expecting to get nothing more than MOSTLY BULLCRAP!
One Love,
The FXPROFESSOR

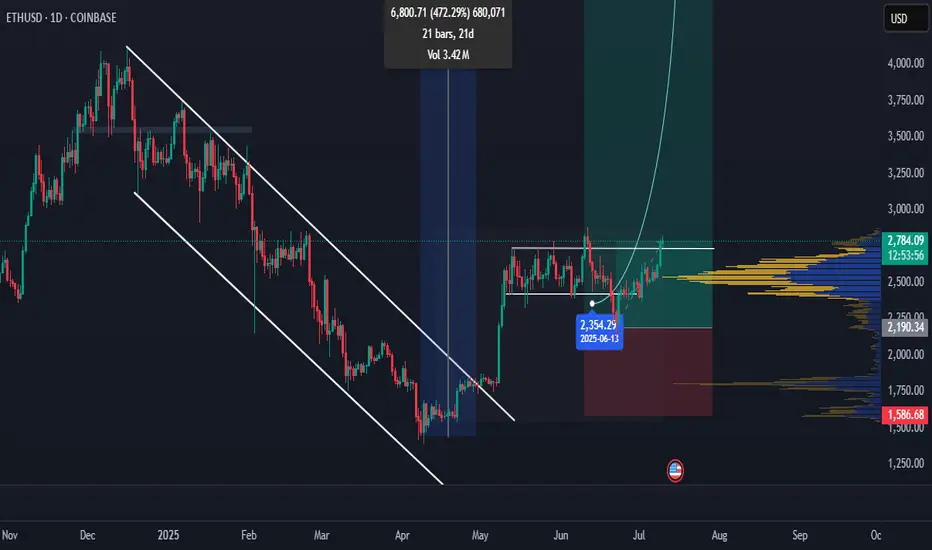
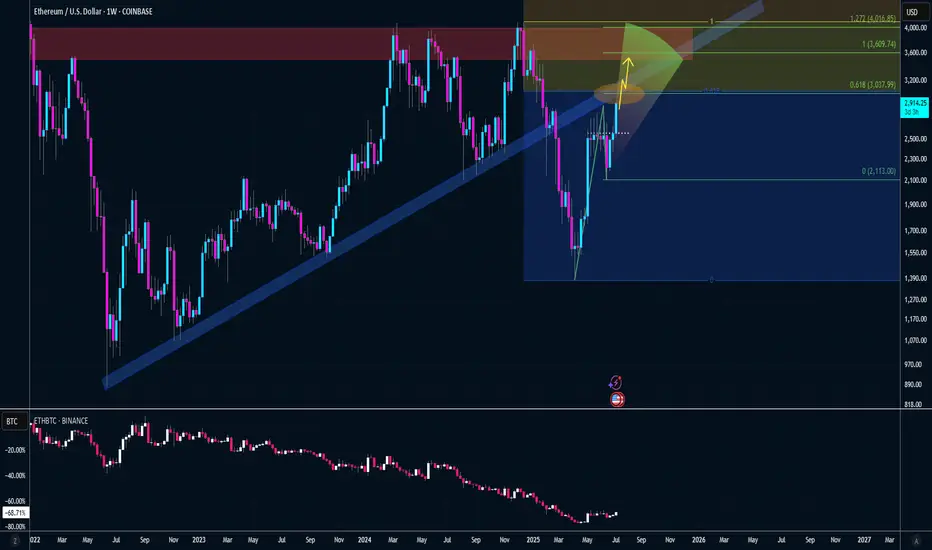
ETHEREUM ahead of the most critical break-out of the Cycle.Ethereum (ETHUSD) is on the cusp of a major bullish break-out as this week it is already trading above its 1W MA50 (blue trend-line). If it manages to close the 1W candle above it, it will be the first time since January 06 2025 to do so.
This whole price action remains inside a massive Megaphone pattern and resembles the same structure ETH had during June 24 2019 - July 20 2020. Both patterns had a final decline of around -67% with the 2020 structure eventually starting a (green) Channel Up that broke above the Megaphone and made a first Top on the 1.382 Fibonacci extension.
As a result, if the break-out does happen this time around also, we expect the emerging Channel Up to target at least $6300 (Fib 1.382 ext).
-------------------------------------------------------------------------------
** Please LIKE 👍, FOLLOW ✅, SHARE 🙌 and COMMENT ✍ if you enjoy this idea! Also share your ideas and charts in the comments section below! This is best way to keep it relevant, support us, keep the content here free and allow the idea to reach as many people as possible. **
-------------------------------------------------------------------------------
💸💸💸💸💸💸
👇 👇 👇 👇 👇 👇

ETH Not Taking Profits Yet – System Still Long
ETH on the 4H is pausing right at the 3D 200MA, picture perfect, actually.
Now we wait to see if this resistance flips into support.
If that happens, price could go for the 0.382 Fib level around $3,040.
Of course, that’s the ideal scenario, but the market could easily contradict me, so keep that in mind.
Personally, it’s not time to take profits yet.
Both my 4H and 1D systems are still in long positions.
For extra safety, you could set a partial take-profit just under the second-to-last PSAR dot.
Always take profits and manage risk.
Interaction is welcome.

ETH Decision Zone: Breakout or Bull Trap?Ethereum (ETHUSD) just broke out of a tight symmetrical triangle on the 1H chart — but price is now stalling near the previous high, signaling a critical decision point.
📊 Key Technical Notes:
🔹 Triangle Breakout: Clean push above downtrend resistance, but no candle close above key high.
🔹 Previous High Acting as Resistance: Bulls need continuation to validate this move.
🔹 Two Scenarios in Play:
1️⃣ Bullish Continuation:
→ ETH breaks and holds above ~$2,865
→ Next resistance levels sit at $3,000+
2️⃣ Bearish Rejection / Fakeout:
→ Rejection from highs
→ Retest of triangle → Failure = drop toward previous low near $2,150
🎯 Risk-Reward Defined — both long and short setups are clearly outlined.

ETH POTENTIAL BULLISH GARTLEY Seeing a potential bullish gartley forming on ETH if it is unable to break above the .886 of the AB wave. Targets would be $2004 to $1786 for the .786 or 1.618 of the BC leg

ETH resumes it's rally!!! | 5k loading! We got the perfect entry in our prediction.
ETH continues to give ALT season hints. Once the bitcoin outflow starts, expect 8k COINBASE:ETHUSD
What do you think of the idea? any counter ideas?
I'm open for feedback. Feel free to drop your thoughts!