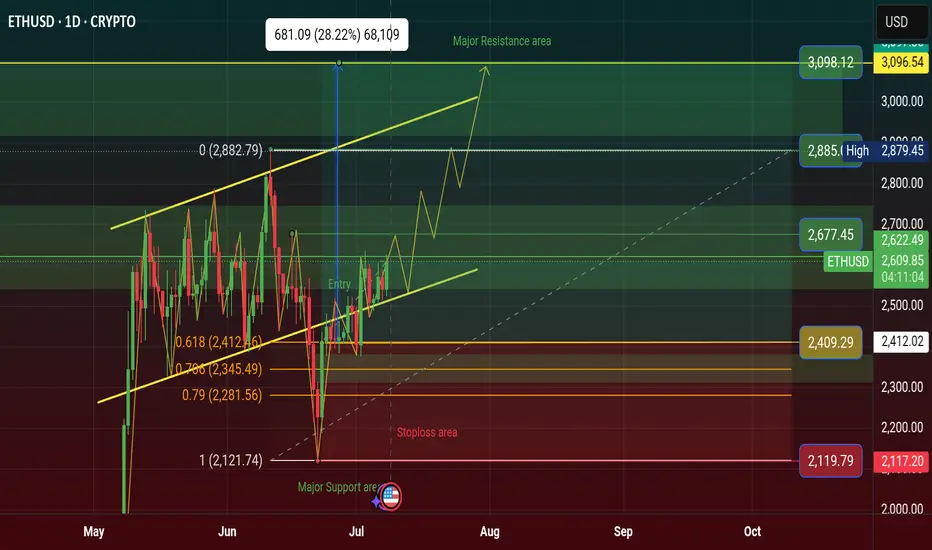
$ETH Price Will Rising $3098 in Q3, Bullish Flag Inverse AngleCRYPTOCAP:ETH price will Rising $3098 in Q3 in 2025, Price Showing a Bullish Flag Inverse Angle. it's a Reversal Pattern and Manipulation Price. See more on Chart.
Crypto News: An Ethereum address holding 900 ETH started moving coins Monday after spending nearly 10 years dormant.
The holder received these genesis coins in 2015 when ETH traded below 50 cents.
These pre-mined tokens were distributed to early Ethereum contributors before mining began.
Their current value reaches 2.2 million with ETH trading around 2,529 per coin.
This represents potential gains exceeding 5,000% from the original sub-dollar entry price.
The move follows similar whale activity, including a 27.6 million Ethereum sale in April.
Last week saw a Bitcoin whale move 8 billion after 14 years of hodling.
ETH remains 48% below its 2021 all-time high of 4,878 despite recent stability.
The holder technically isn't a whale, which requires a minimum of 10,000 ETH at current prices.
#Write2Earn #BinanceSquareFamily #ETH #SUBROOFFICIAL
Disclaimer: This article is for informational purposes only and does not constitute financial advice. Always conduct your own research before making any investment decisions. Digital asset prices are subject to high market risk and price volatility. The value of your investment may go down or up, and you may not get back the amount invested.
ETHUSD trade ideas
ETH | Price PredictionI believe that COINBASE:ETHUSD is the most important ecosystem for crypto and am bullish on it. The price of many great assets is absolutely dependent on ETH, because those assets have ETH as the key liquidity. I love assets from the ecosystem: OKX:MORPHOUSDT , BINANCE:WLDUSDT , BINANCE:OPUSDT , BINANCE:ARBUSDT , BINANCE:LDOUSDT , $BINANCE:STRKUSDT.
Those levels are from my platform. I believe that up to "Bullish" is really easy to hit this "cycle".

ETH to 3KETH is looking set to challenge the 3k level.
You can see by the small breakout and old resistance acting as new support levels at fig 1 that ETH is building towards a leg up.
Look for ETH to move higher with a small breakout (fig 2), retest (fig 3) before moving higher towards the 3K range.

Update on postAs expected chart is going for the buying liquidity
Buying can be done at 2480-90 levels with astoploss around 2450
Major direction ethI think eth 2nd wave local bottom is created around 2100.now we r moving in the third wave
Ethereum H4 | Potential bearish reversalEthereum (ETH/USD) is rising towards a swing-high resistance and could potentially reverse off this level to drop lower.
Sell entry is at 2,601.80 which is a swing-high resistance.
Stop loss is at 2,700.00 which is a level that sits above a swing-high resistance.
Take profit is at 2,397.10 which is a multi-swing-low support that aligns with a 50% Fibonacci retracement.
High Risk Investment Warning
Trading Forex/CFDs on margin carries a high level of risk and may not be suitable for all investors. Leverage can work against you.
Stratos Markets Limited (tradu.com ):
CFDs are complex instruments and come with a high risk of losing money rapidly due to leverage. 63% of retail investor accounts lose money when trading CFDs with this provider. You should consider whether you understand how CFDs work and whether you can afford to take the high risk of losing your money.
Stratos Europe Ltd (tradu.com ):
CFDs are complex instruments and come with a high risk of losing money rapidly due to leverage. 63% of retail investor accounts lose money when trading CFDs with this provider. You should consider whether you understand how CFDs work and whether you can afford to take the high risk of losing your money.
Stratos Global LLC (tradu.com ):
Losses can exceed deposits.
Please be advised that the information presented on TradingView is provided to Tradu (‘Company’, ‘we’) by a third-party provider (‘TFA Global Pte Ltd’). Please be reminded that you are solely responsible for the trading decisions on your account. There is a very high degree of risk involved in trading. Any information and/or content is intended entirely for research, educational and informational purposes only and does not constitute investment or consultation advice or investment strategy. The information is not tailored to the investment needs of any specific person and therefore does not involve a consideration of any of the investment objectives, financial situation or needs of any viewer that may receive it. Kindly also note that past performance is not a reliable indicator of future results. Actual results may differ materially from those anticipated in forward-looking or past performance statements. We assume no liability as to the accuracy or completeness of any of the information and/or content provided herein and the Company cannot be held responsible for any omission, mistake nor for any loss or damage including without limitation to any loss of profit which may arise from reliance on any information supplied by TFA Global Pte Ltd.
The speaker(s) is neither an employee, agent nor representative of Tradu and is therefore acting independently. The opinions given are their own, constitute general market commentary, and do not constitute the opinion or advice of Tradu or any form of personal or investment advice. Tradu neither endorses nor guarantees offerings of third-party speakers, nor is Tradu responsible for the content, veracity or opinions of third-party speakers, presenters or participants.

Eth liquidity huntingFirst eth to take upside liquidity and then downside after that continuation yo upside
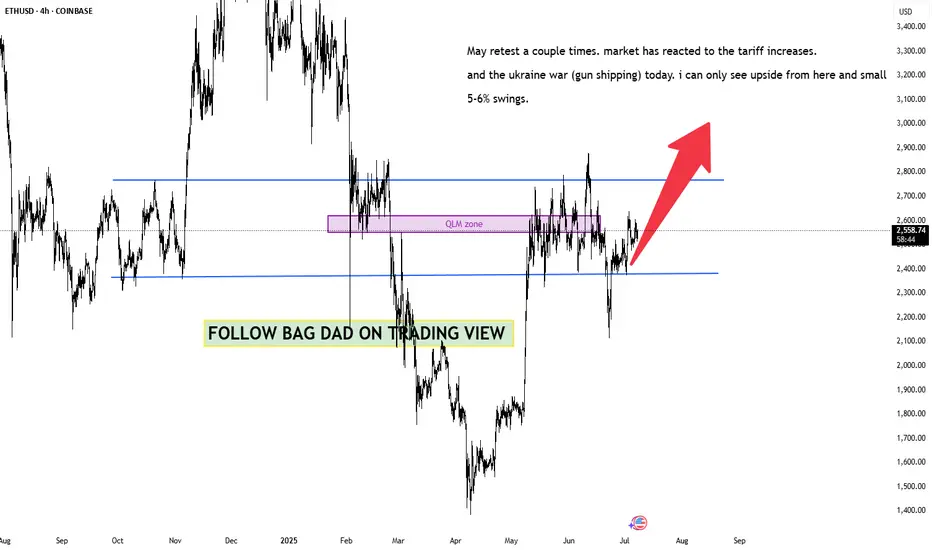
$ETH market prediction and analysis - BAG DAD here we have entered and already made 30% profits on this recent eth long. looking for a small retest and then we will break the QLM zone yet again for a increase and more profit margin oppertunity.
we handle SL in the range aswell to assure minimal loss of funds if we miss time the 2nd entry.
bag dad saves the day yet again !
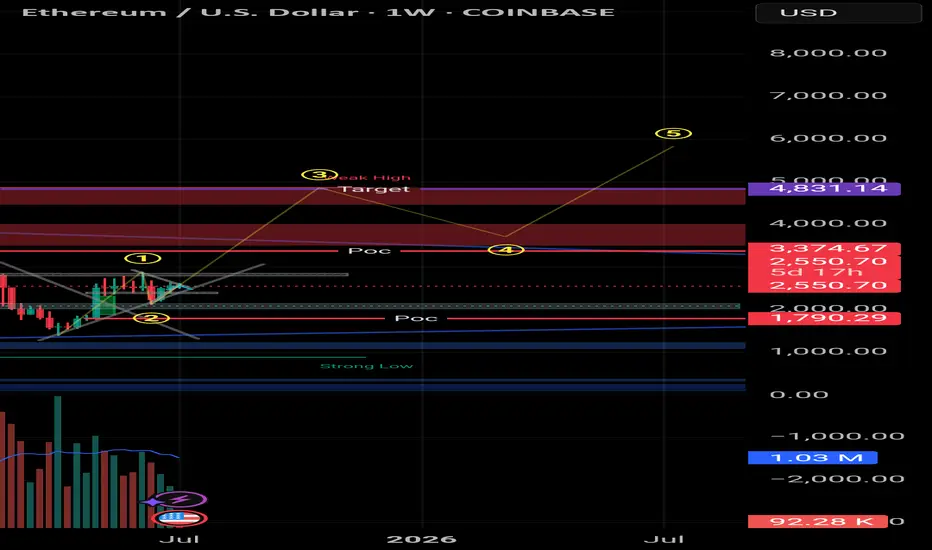
Ethereum setup with a 14 R:R.Let’s see if this time marks the beginning of bullish momentum.
This setup offers a 14:1 risk-to-reward ratio
Entry at 2560
Stop loss 2457
Target at 4000.

Ethereum: Potential for Long Trend as Bulls Eye Key Levels Current Price: $2581.17
Direction: LONG
Targets:
- T1 = $2645
- T2 = $2710
Stop Levels:
- S1 = $2530
- S2 = $2480
**Wisdom of Professional Traders:**
This analysis synthesizes insights from thousands of professional traders and market experts, leveraging collective intelligence to identify high-probability trade setups. The wisdom of crowds principle suggests that aggregated market perspectives from experienced professionals often outperform individual forecasts, reducing cognitive biases and highlighting consensus opportunities in Ethereum.
**Key Insights:**
Ethereum has shown signs of resilience and stability despite broader market volatility. Professional traders are favoring Ethereum as a potential long opportunity based on its consolidation at key support levels. Bullish divergence has been noticed in its relative strength index (RSI) and trading volume, indicating that sellers are starting to exhaust themselves while buyers gradually regain control. This sets the stage for a potential upward breakout in the coming days.
Moreover, Ethereum’s dominance in the digital asset space continues to benefit from the expanding use of decentralized applications (dApps) and smart contracts, which solidify the outlook for continued adoption and innovation. Long-term sentiment remains positive, with Ethereum receiving accumulating interest from institutional investors.
**Recent Performance:**
Ethereum recently held firm at $2580 despite testing lower support levels near $2500 in volatile trading sessions. Its ability to close above significant levels repeatedly demonstrates strong relative momentum compared to other cryptocurrencies. Over the last week, Ethereum has gained 4.5%, outperforming Bitcoin and other altcoins in the same period. This resilience has attracted renewed attention from both short-term swing traders and long-term holders.
**Expert Analysis:**
Technical analysts highlight Ethereum's symmetrical triangle formation over the past three weeks, which traditionally signals a breakout potential. Coupled with increasing accumulation volume, Ethereum seems poised to test resistance around $2645 in the next trading sessions. Should momentum sustain, secondary resistance near $2710 is realistic. However, traders should keep an eye on fundamental factors such as total market capitalization trends and external economic indicators, which may trigger unexpected volatility.
Moreover, Ethereum's scalability developments through upgrades such as "The Merge" to Ethereum 2.0 have bolstered its long-term outlook. Analysts remain optimistic about Ethereum's role as a cornerstone for decentralized finance (DeFi) and web3 technologies.
**News Impact:**
Recent reports of institutional accumulation—particularly from asset management firms—highlight growing confidence in Ethereum as a diversified investment vehicle. Moreover, Ethereum's sustained relevance in the transition to proof-of-stake (PoS) reinforces its strategic positioning. The cryptocurrency market has shown relative resilience amid equity market dips, and Ethereum's eco-friendly upgrades are being well-received in global markets. This news underpins Ethereum's current bullish setup.
**Trading Recommendation:**
Based on technical, fundamental, and sentiment analyses, Ethereum appears to be a strong candidate for a long position. Its consolidation above support levels, combined with bullish technical setups, signals potential upside in the near term. Traders should use disciplined stop losses, with S1 at $2530 and S2 at $2480, for risk management. Upside targets of $2645 (T1) and $2710 (T2) provide strong risk-reward opportunities. Ethereum's robust ecosystem and accumulating investor interest affirm its value as a long-term and speculative asset.

$ETH Breakout this week?CRYPTOCAP:ETH local chart looks ready
I think were looking at a decent ETH breakout this week to the next resistance High Volume Node at $3600 minimum target.
👉 BTC is consolidating under all time high resistance after multiple tests which is usual a sign of bullish continuation. Usualy giving alts room to room.
👉 Ethereum is above the daily 200EMA, daily pivot and also consolidating under resistance once more after testing the 0.382 Fibonacci retracement and S1 daily pivot adding confluence to that being the local bottom. This appears to be Elliot wave 2, a shallow wave 2 retracement (less than 0.5) is a show of strength and investor impatience.
Analysis invalidated below the daily pivot and daily 200EMA as this will lock in 3 waves up and look corrective.
Safe trading

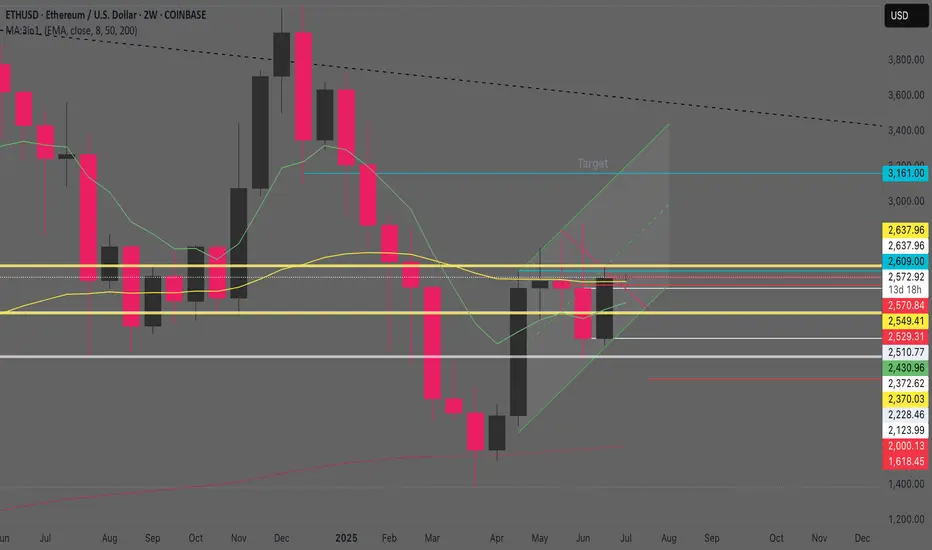
Bi-Weekly Bullish Engulfing Candle - Target 3100. Pattern Height = Engulfing Candle High (top of wick) - Prior Candle Low (bottom of wick).
For ETH/USD example:
Engulfing candle high = $2,637 (top of wick).
Prior candle low = $2,113 (bottom of wick).
Pattern Height = $2,637 - $2,113 = $524.
Target = $2,637 + $524 = $3,161.
ETH – Next Stop 3D 200MA?ETH on the 4H closed the week strong after holding support at the 0.5 Fib and 200-day MA.
If price holds here, it could attempt another push toward the 3D 200MA.
Let’s see how the week unfolds on the macro and political fronts.
Always take profits and manage risk.
Interaction is welcome.

Ethereum | ETH | Long at $2,598.77Currently within my historical simple moving average area and consolidating. I suspect a move up is imminent, but 100% speculation. Crypto "bros" know more than I do.
Targets into 2028:
$4,000 (+53.9%)
$5,500 (+111.6%)

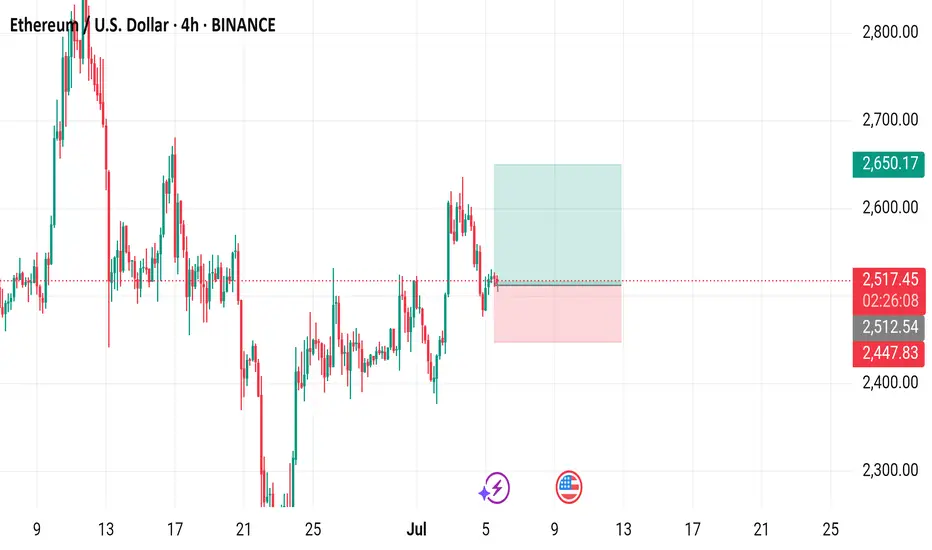
Ethereum / U.S. Dollar 4-Hour Chart4-hour chart from BINANCE displays the price movement of Ethereum (ETH) against the U.S. Dollar (USD) as of July 05, 2025. The current price is $2,520.12, reflecting a 4-hour increase of $10.77 (+0.43%). The chart includes buy and sell signals at $2,520.12, with a highlighted support zone around $2,447.83 and resistance near $2,650.17. A recent price drop is visible, followed by a potential consolidation or reversal zone marked in green and red.
$ETH 4H Update: Target 1 hit! Ethereum has reached the $2,600 . CRYPTOCAP:ETH 4H Update:
Target 1 hit! Ethereum has reached the $2,600 level after a clean breakout from the falling wedge. Holding above support confirms bullish momentum — next key target is $2,800 as long as price stays above $2,400

A chart that speaks for itself... ETH final target 11-12k $Massive descending broadening wedge forming, with clear lines of support and resistance. While bitcoin is gonna visit 150k-200k levels etherium will probably visit this final take profit level at 11-12k per etherium with a 360%~ increase from today.
Dont miss it...

ETHUSD LONG TRADE PLANThe instrument recently broke out of a bearish channel and recently formed what seem like a bullish trend. It is currently trading within an accumulation phase. I will be monitoring this zone for a breakout.
Please do your own analysis before placing any trades.
Cheers and Happy Trading !!!!
ETHUSD: Next Move Is Down! Short!
My dear friends,
Today we will analyse ETHUSD together☺️
The in-trend continuation seems likely as the current long-term trend appears to be strong, and price is holding below a key level of 2,514.4 So a bearish continuation seems plausible, targeting the next low. We should enter on confirmation, and place a stop-loss beyond the recent swing level.
❤️Sending you lots of Love and Hugs❤️

ETH / USDC Liquidity Pool RangeTightening up the range a little. Looking good with horizontal lines setting the new range.

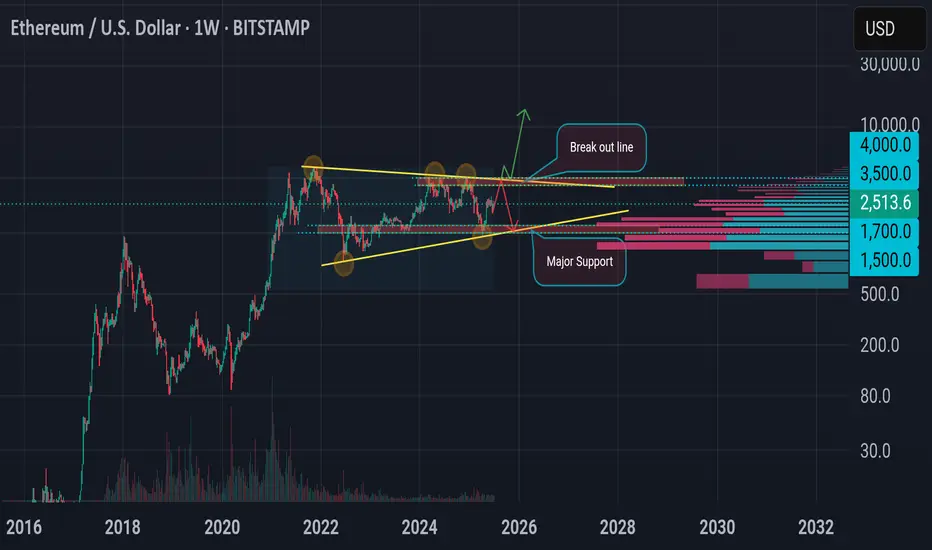
ETH Bullish pennant!?Let's look at the big timeframe (weekly). currently the price is moving in the consolidation area, forming a triangle with a narrowing trend but in a long time span. therefore there has been no eth spike for several years making it feel boring. big movement if it is able to penetrate the breakout line of 3500-4000$ or there will be a rejection if it fails. Major support is in the area of 1500-1700$ which historically is quite good at withstanding high selling pressure.
Ethereum $5,791 followed by $8,500 Late 2025Ethereum is due a major, major bullish wave. No new highs since March 2024. Double-top December 2024.
The bear market ended June 2022. April 2025 marks a long-term higher low.
So the peak remains flat, March 2024 vs December 2024. While the bottom is rising, June 2022 vs April 2025.
You could say the top is a lower high of course, November 2021 vs 2024. This is also valid. Even with a lower high top a bullish wave is due leading to a minimum of around $3,800 or $4,000; back to baseline.
Now, if we really want to talk about minimum because we really don't care about worst case scenario, the fundamentals are improving and everything is getting better, consider $5,791. This would be the minimum. With the Ethereum ETFs and the 2025 bull market, we then open up $8,500 and so on. Growth potential is unlimited and we will have to use our imagination. These numbers are good though and definitely a strong level where action will happen. You will see some resistance, some something going on when Ethereum reaches these numbers.
Ethereum is due a major, major bullish wave. It is not a question of "if," it is a question of "when." When will it happen? "If it happens?" No! When, will it happen?
It will happen in 2025. You can be certain about it... Just watch!
....
Ethereum (ETHUSDT) has been consolidating two months above support. Support being $2,425. One week it broke below this level just to recover the next week. More than 8 weeks sideways wicking lower and higher.
The 7-April low, candle and rounded bottom, as well as long-term higher low makes this date a clear bottom. From the bottom we grow. Once the bottom is hit, the trend changes. The trend has been bearish since March 2024. A long time in Crypto term. We are in the bull market year, 2025. What is not happening now, is what will happen next.
The market was bearish for a long time and that's ok. The good news are the waves within cycles... We just came out of a strong correction; we have a small recovery and consolidation. The initial breakout is being consolidated before additional growth.
Lots of thinking, lots of reasoning, lots of studying... Everything you need to know is already present on the chart. Ethereum will grow. Mark by words. It is already happening.
Thank you for reading.
Namaste.

ETHUSD POTENTIAL LONGETHUSD potential bullish setup ↗️
ETH still showing bullish momentum. Might bounce on the bullish trend line, for now it’s hasn’t done the third touch so expect it go lower to the trendline first. A strong bullish confirmation would be a signal to go LONG. Share your thoughts on this in comment section.
