ETHUSD: Next Move Is Down! Short!
My dear friends,
Today we will analyse ETHUSD together☺️
The market is at an inflection zone and price has now reached an area around 2,545.9 where previous reversals or breakouts have occurred.And a price reaction that we are seeing on multiple timeframes here could signal the next move down so we can enter on confirmation, and target the next key level of 2,529.4..Stop-loss is recommended beyond the inflection zone.
❤️Sending you lots of Love and Hugs❤️
ETHUSD trade ideas

Ethereum LP Range TighterVolatility has continued to decline, enabling us to tighten the liquidity provision range on Ethereum within the Base network, as indicated by the horizontal red lines. However, trading volume in ETH remains relatively low, which is resulting in minimal fee generation from the pool, we expect that to change: app.uniswap.org
ETH 06/15ETH is not bullish. It’s delayed. Strength isn’t absence of collapse — it’s the pause before it. Exit. Re-enter at 2,200. Obey structure, not emotions.
ETH is accumulating on a continuous patternETH is accumulating on a continious pattern and I just opened a postition at botten edge of this bottom,
I'' stop loss if the pirce action of ETH destroyed the bottom edge to go down strongly.

Ethereum Liquidity Pool RangeOn the ETH/USDC liquidity pool on the Base network, Ethereum’s volatility is beginning to stabilize, creating a favorable range for liquidity provision, as indicated by the horizontal red lines. There may be an opportunity to tighten this range further in the coming hours, but additional data is needed to confirm. For now, the concentrated range is being set slightly wider, given that we’re still relatively close to the significant volatility spike from earlier in the week.
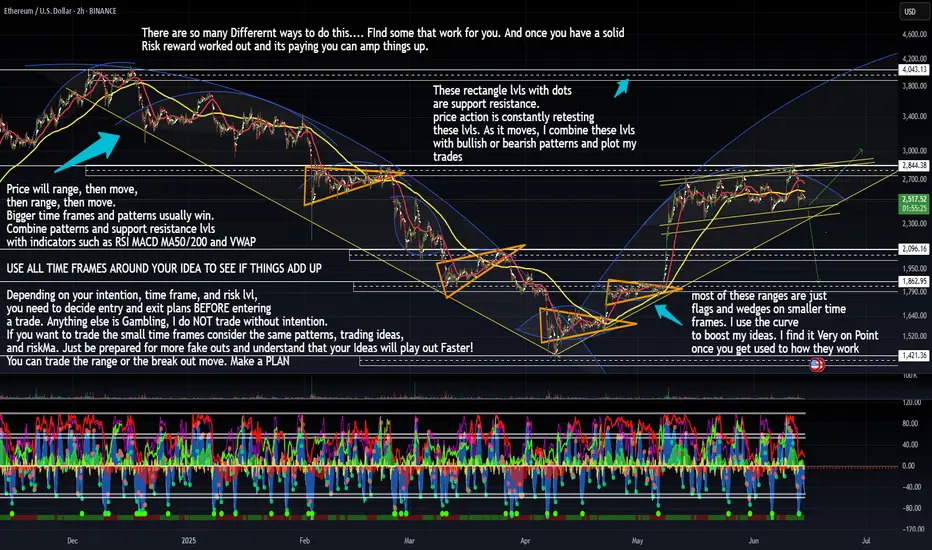
Pattern TradingJust some Ideas on Trading patterns. Going over curve ideas and how to manage trading ranges or breakouts
Weekly Outlook $ETHI’d prefer to see price drop into the weekly FVG or weekly OB before looking for any new long positions. The $2,800 level has been rejected for 5 consecutive weeks, and in my opinion, we need to grab some liquidity before we can make a push toward $3,100.


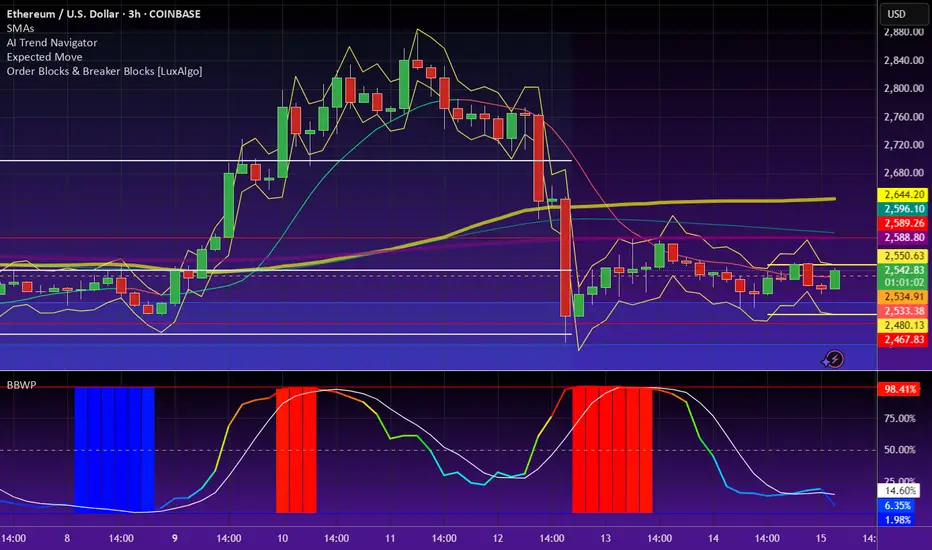
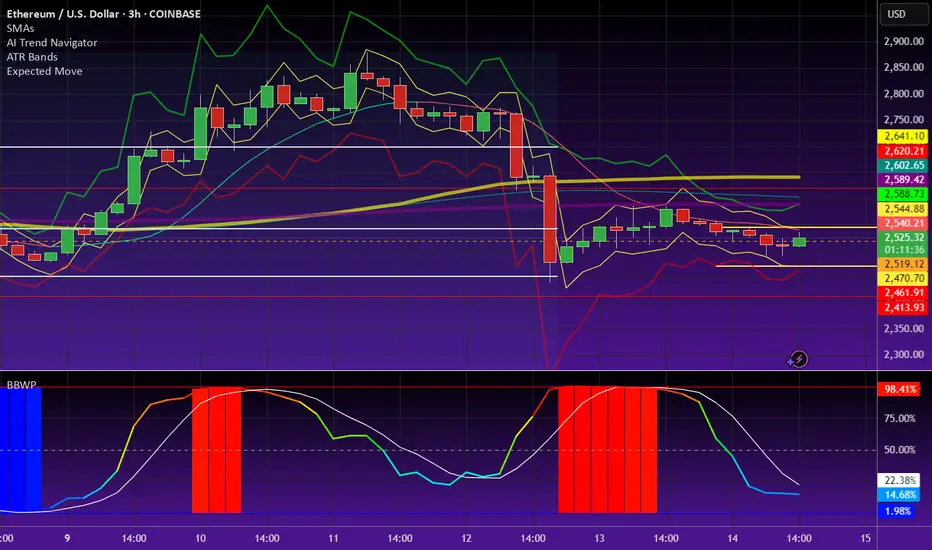
Watching 4H and 30min Reaction
Price is now finding resistance on the 4H at the 200MA, and on the 30min at the 50MA.
On the 4H, the SMA has flattened, and the MLR is starting to flatten too—after price found support at the 0.5 Fib and weekly 200MA.
Buying volume is starting to pick up on both timeframes.
For stop-loss, I’m using push notifications instead of an open order.
Always take profits and manage risk.
Interaction is welcome.

Ethereum / US Dollar (ETH/USD) ETH/USD is forming a short-term ascending channel on the 15-minute chart after a strong rebound from the 2510 level. As long as price remains inside this channel, a move toward 2604 and possibly 2657 is likely. A break below 2510 would weaken this bullish momentum and could trigger a new wave of selling.

Ethereum / US Dollar (ETH/USD)ETH/USD is trading within a broad ascending channel on the 4H timeframe. The price has recently rebounded from the lower boundary of the channel around 2435.63 and is now attempting a recovery. If this rebound holds, the next bullish targets lie at 2604 and 2657. A break below 2430 would invalidate the bullish setup and could lead to deeper downside pressure.

ETHUSD: This pattern always ends with massive rally.Ethereum has turned neutral on its 1D technical outlook (RSI = 50.794, MACD = 85.840, ADX = 26.701) as it's been compressed inside the 1W MA50 and 1W MA200 in the past month. The long term pattern here is a Megaphone - Broadening Wedge. Every Cycle formed one and historically once broken, it led to an enormous rally. We are still expecting the price to approach the top of this pattern on the medium term but if broken, you can aim for the 2.0 Fibonacci extension (TP = 11,000) if you want to pursue some risk.
## If you like our free content follow our profile to get more daily ideas. ##
## Comments and likes are greatly appreciated. ##

Reaccumulation Before Breakout? Idea Summary:
Ethereum is currently in a consolidation phase after testing the $2,700–$2,750 zone. Using Fibonacci retracement and extension levels, I anticipate a potential bullish continuation pattern forming above key support zones, with eyes on higher targets.
🔍 Technical Analysis:
Current price: ~$2,540
Key Fib retracement levels:
0.786 – ~$2,347 → holding as immediate support
0.618 – ~$2,222
0.5 – ~$2,064
0.382 – ~$1,906
Resistance zone: ~$2,734 (Fib 1.0)
Main breakout target:
1.618 extension – $3,563
2.618 extension – $4,904 (longer-term projection)
Price action suggests a potential bullish structure forming – a possible inverse head & shoulders or ascending triangle pattern.
Bullish Scenario:
If ETH holds above $2,300–$2,350 and breaks above the $2,730 resistance, we could see a surge toward the $3,560 level (1.618 Fib extension), with the possibility of entering a parabolic leg toward $4,900+ in the longer run.
Bearish Scenario:
If ETH fails to hold above the 0.786 level ($2,347), the next downside supports are:
$2,222 (0.618)
$2,064 (0.5)
These levels could offer new long entries depending on reaction.
Conclusion:
Ethereum is forming a solid base for the next move. As long as bulls protect the $2,300 zone, the chart favors upside continuation. A break above $2,750 would confirm strength and may trigger a powerful bullish extension.

Retest Flag and Continue Breakout $3500I think this pullback mainly driven by middle east uncertainty is a great gift to buy the pullback on BITSTAMP:ETHUSD

Stop messing around and buy ETHUSDMy last post didn't include the entry, stop loss and TP. I've adjusted it now. The entry is below 2550.
Enjoyy

ETHUSD bullish continuation. I'm buying!!ETHUSD is bullish and this purge is an opportunity to buy lower. I've been calling this ETHUSD since 1600. Add more buys now. We are pushing for that ATH.
Ya gaize

Long Setup After Accumulation BreakoutAfter a clear accumulation phase, we've seen a manipulation spike followed by distribution. Price has now pulled back to the top of the previous accumulation zone, which I view as a strong demand area.
I'm entering long from this pullback with a target around $3,000.

$eth long 🧠 Trade Idea
Ethereum has pulled back sharply after testing resistance at the $2,869–$2,906 zone. The current price around $2,527 shows signs of stabilizing just above previous demand ($2,444–$2,368), offering a potential long opportunity with clearly defined risk and multiple upside targets.
🎯 Trade Setup
Entry: $2,527.41 (market)
Stop Loss: $2,368.86 (below recent demand wick)
Take Profit Targets:
TP1: $2,641.16 (initial reaction level)
TP2: $2,752.67 (local high)
TP3: $2,869.37 (supply zone)
TP4: $3,024.97 (major resistance)
Extended TP: $3,107.96–$3,196.80 (macro trendline retest)

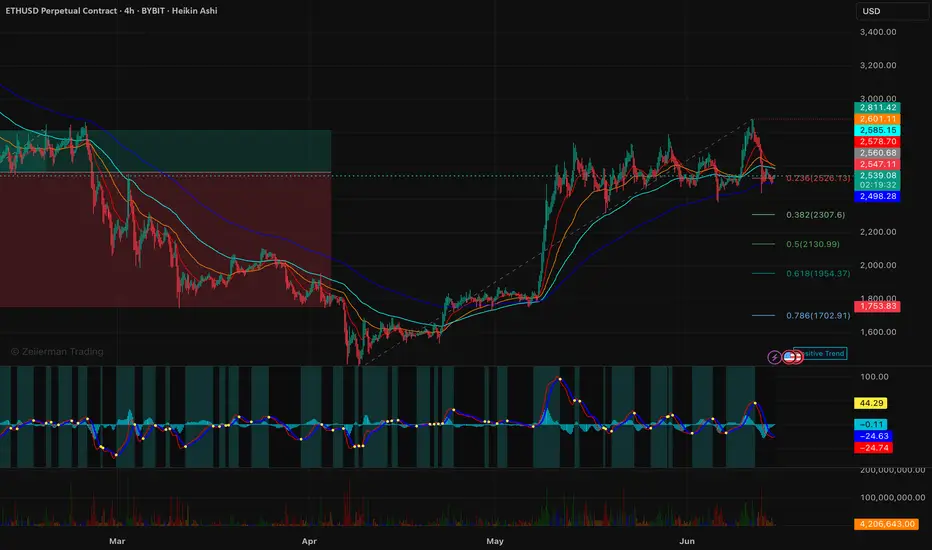
Locked in – 4H vs 30min Timeframes
When trading high leverage, I need a sharp overview of the market to manage risk and take profits.
Having a parallel view of the 4H and 30min timeframes helps a lot with that.
Right now, on the 30min chart, we’ve had two clean retests of key high timeframe levels :
– the 0.5 Fib
– the weekly 200MA
These retests may justify scaling into a long position , with a stop-loss placed just below the 0.5 Fib or the weekly 200MA.
The structure (MLR > SMA > BB center) supports a long entry, but PSAR hasn’t flipped bullish ye t, so this setup requires caution—especially if price starts closing below these levels. If that happens, it’s better to wait before scaling in .
On the 4H timeframe, selling volume spiked on the last candle , but keep in mind:
→ 3D volume bars have been decreasing , suggesting selling pressure might be weakening overall.
I’ll do my best to keep consistent updates on this parallel timeframe view—it’s proving to be very helpful.
Always take profits and manage risk.
Interaction is welcome.

ETH correction set ups big buyAmongst the geopolitical tensions and market uncertainty has ETH just had its big correction before a massive rise in the price?
The 4 hour candle suggests that in the coming days to month it will reach a point at which we will break the trend line in either a bullish reconfimration or a switch to bearish intentions.
I suspect that we will se big price action in the next few days

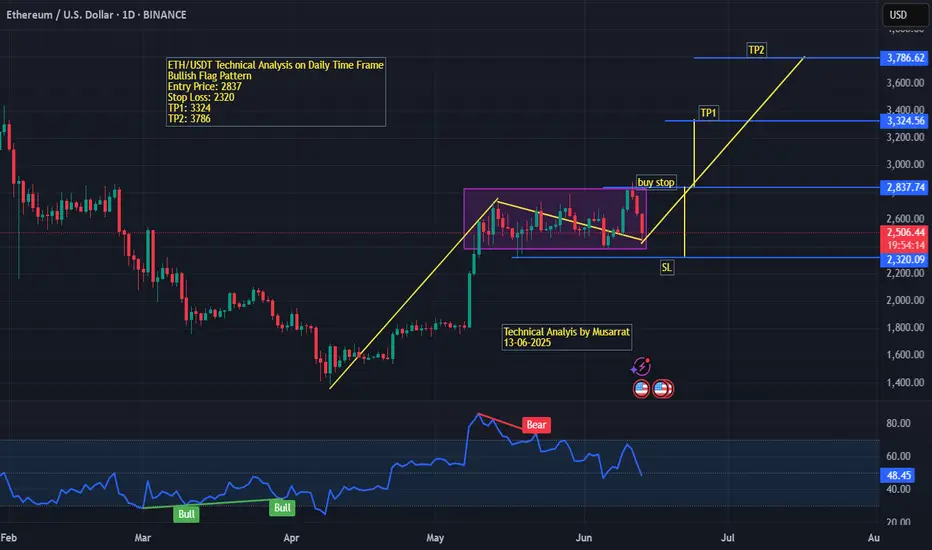
ETH/USDT (Daily Time Frame) Technical Analysis – ETH/USDT (Daily Time Frame)
Chart Date: June 13, 2025
Pattern: Bullish Flag
Ethereum (ETH) against USDT is currently forming a bullish flag pattern on the daily chart, indicating a potential continuation of the previous uptrend. The price action shows a sharp bullish rally followed by a consolidation phase within a descending channel (flag), which is typical in such setups.
Entry Point: The breakout level is marked at $2,837, which serves as a potential buy-stop trigger.
Stop Loss (SL): Placed at $2,320, just below the support zone and the lower boundary of the consolidation flag. This helps protect against a false breakout.
Target 1 (TP1): $3,324, derived from the height of the flagpole projected from the breakout point.
Target 2 (TP2): $3,786, a more aggressive upside target in line with the full measured move of the flag pattern.
The RSI indicator at the bottom reflects a bearish divergence during the latter part of the flag, which led to the current retracement. However, previous bullish divergences in March and April triggered strong upswings, indicating that momentum could return if price breaks above resistance.
The price currently trades at $2,522, below the breakout level, suggesting traders should wait for confirmation of the breakout before entering the trade.
Conclusion:
This chart sets up a high-probability bullish continuation trade. Traders should monitor for a strong breakout above $2,837 with volume confirmation before entering long. Risk management is key, with a tight SL near $2,320 and clear profit-taking zones at TP1 and TP2.
ETHUSD likely to reach 2474 levelETHUSD is in uptrend and has possible reversals. Once the reversal is confirmed, price is likely to reach 2474 level.
All the analysis is for educational purpose only. Not an investment or financial advise.

ETH will rebound.What you're looking at is a textbook rising channel, well-respected, clean, and elegant in its symmetry. For weeks, ETH has climbed this structure with rhythmic oscillations between support and resistance, almost as if the market were guided by a ruler and compass. Price action respected both boundaries with admirable discipline, making this a trader’s dream for range-based strategies. Now, that structure is being tested sharply.
The most recent candle shows a strong drop from the upper boundary straight to the lower. It didn't drift down gently but fell with force. Yet despite that intensity, price has landed precisely on the lower boundary of the channel. This is often where markets pause and reset. If the structure remains intact, and history offers any guide, this could mark the beginning of a fresh upward leg. The drop may have been more about clearing excess than breaking trend.
There is reason to believe in the bounce. The channel has been reliable, and deep tests like this often come before a recovery, not a collapse. If price begins to stabilize here, even modestly, it would suggest that the market still respects this structure. The next few candles will matter, but for now, the channel is holding. And when a structure like this holds after such a flush, it can produce some of the strongest moves back to the top.
