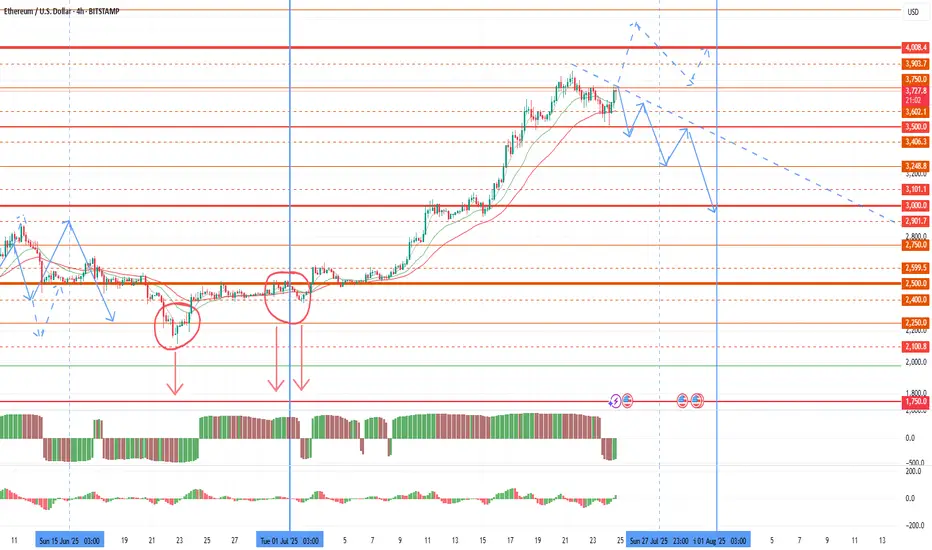
ETH/USD Harmonics forecast. We are still studying it's trend, looks like the next move is going to be toward downwards, temporary.
ETHUSD trade ideas

Possible market drawdown before the end of the monthToday I want to review the market and give a warning on further purchases. Since the last review, as expected, volatility in the market began to grow with a flat of about 2500 on ether until the half-year change. The growth of the euro and oil gave rise to a 4k retest in the new half of the year. However, the half-year has opened below 2,500, which is a technical selling signal that bears will use at the end of each major period. A large volume of sales was also left before the half-year change, which can be retested up to 2100-2250. The first pullback is already possible for the current monthly candle, with its pinbar reversal up to 2750-2900 on ether. This pullback started yesterday and is likely to accelerate in the last weekly candle of the month. Further sales are highly likely to continue in the first half of the new month as part of the shadow drawing for the new monthly candle. In an optimistic scenario, the bulls will be able to take 4,000 by the end of the week, in which case the pullback on the current monthly candle will be compensated.
Given the increased likelihood of sales in the market, I recommend fixing profits by the end of the week and reducing the number of coins in operation. The current rollback for some coins will also end with the assignment of the monitoring tag at the beginning of the month and a further collapse, which puts pressure on the coins.
Most of the coins that I considered for work provided good opportunities for making money, especially the growth impulses of pivx and data with sharp breakouts stood out. Adx fio chess cos token also showed growth, but at a smoother pace. The most negative dynamics was given by slf, which eventually received the monitoring tag, and I will not consider it in the future.
Despite the pleasant impulses of 50%+ for individual fantokens, this group as a whole shows extremely negative dynamics relative to the market, and remains in the most oversold position, even relative to coins with the monitoring tag. In an optimistic scenario, fantokens will become interesting to speculators against the background of the general decline of altcoins that has begun, and we can expect a good bull run on them before the end of the month. In a negative scenario, binance may be preparing to assign the monitoring tag to some tokens of this group or chz. In this regard, I leave such tokens as atm acm city porto Lazio as the most undervalued in a small lot. But at the beginning of the month, I also recommend keeping short stops on them in the first half of the day of the first week of the new month to insure against assigning the monitoring tag. Or temporarily sell them for a given period.
In addition to fan tokens, I will choose new coins for operation after assigning the monitoring tag in the new month.
ETH - If You Know ...... You Know whats Coming
NYSE:BLK $BUIDL tokenized U.S.-Treasury fund launched on COINBASE:ETHUSD in Mar 2024—Wall Street is already settling real dollars on-chain.
NYSE:JPM JPMD stablecoin just went live on Base (an COINBASE:ETHUSD L2), piping wholesale payments from a $4 T balance-sheet straight through COINBASE:ETHUSD rails.
COINBASE:ETHUSD isn’t just riding the next crypto cycle—it’s becoming Wall Street’s settlement layer. From BlackRock’s on-chain Treasury fund to JPMorgan’s and soon Bank of America’s dollar tokens, a tidal wave of institutional stable-coin flows is lining up behind ETH. Fewer coins, more real-world volume—if you know, you know what’s coming.
NYSE:BAC CEO says they’ll issue a dollar-backed token the moment regulators nod—another tier-1 bank boarding the Ethereum train.
Stablecoin cap has blasted past $230 B , with 80 %+ of all on-chain transfers riding Ethereum (plus BSC) blocks.
Corporate settlements via stablecoins grew 25 % YoY in 2024 as multinationals replaced SWIFT with instant on-chain clearing.
Daily stablecoin throughput averages $7 B—each hop burning ETH and tightening supply.
BCG projects tokenized real-world assets to exceed $16 T by 2030 , with EVM chains as the default plumbing.
Over 500 M wallets already interact with stablecoins , a 30 % YoY surge led by emerging-market demand.
L2s like BINANCE:ARBUSDT & BINANCE:OPUSDT cut transaction fees 35 % yet still settle back to mainnet—meaning ETH captures the fee stream and the burn.
Bottom line: a tidal wave of bank-grade stablecoins + tokenized assets is lining up behind ETH; supply shrinks, demand soars—if you know, you know what’s coming.
quote] Marty Boots | 17-Year Trader — smash that , hit LIKE & SUBSCRIBE, and share your views in the comments below so we can make better trades & grow together!
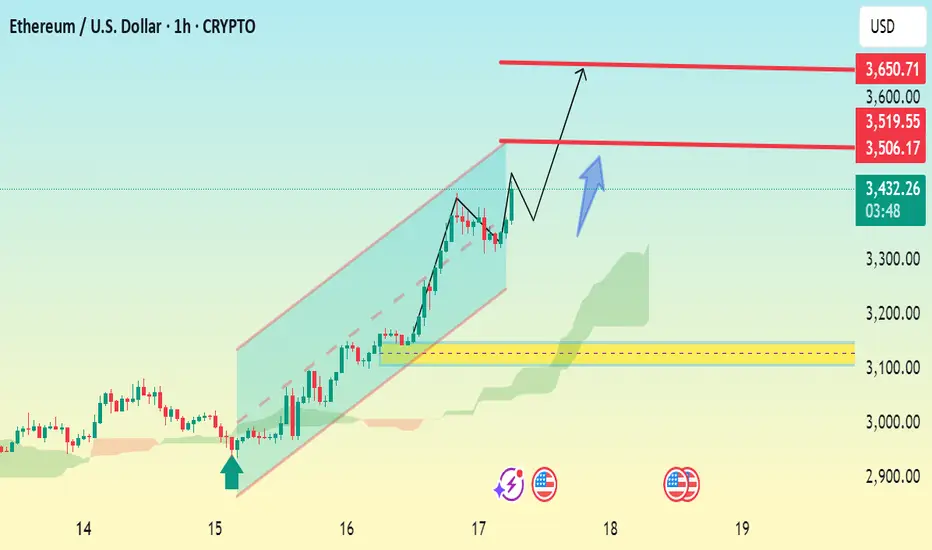
ETHUSD 1h Bullish Reversal SetupChart Analysis Summary:
Current Price:
$3,429.21 (at the time of the screenshot)
Trend:
Strong uptrend within a bullish ascending channel.
Price has been respecting the trendline and moving upward steadily.
Key Chart Patterns & Tools:
Ascending Channel: ETH is trading within an upward sloping channel, suggesting bullish momentum.
Ichimoku Cloud (green): Price is trading well above the cloud, reinforcing bullish sentiment.
Breakout Structure: The chart shows a small consolidation/pullback with a projected bullish breakout.
📈 Key Levels:
Type Price Level (USD) Notes
Current 3,429.21 Live price
Resistance 1 3,506.17 Minor resistance
Resistance 2 3,519.55 Immediate breakout target
Final Target 3,650.71 Major resistance and potential price objective
🧭 Price Action Forecast:
If ETH holds above $3,429 and breaks above $3,519.55, the path toward $3,650 remains open.
A small pullback (as indicated by the blue arrow) is expected before continuation.
As long as price remains within or near the ascending channel, the bullish scenario .
✅ Bullish Confirmation:
Break and retest of $3,519.55.
Continued support above the Ichimoku cloud.
Holding the trendline from the ascending channel.
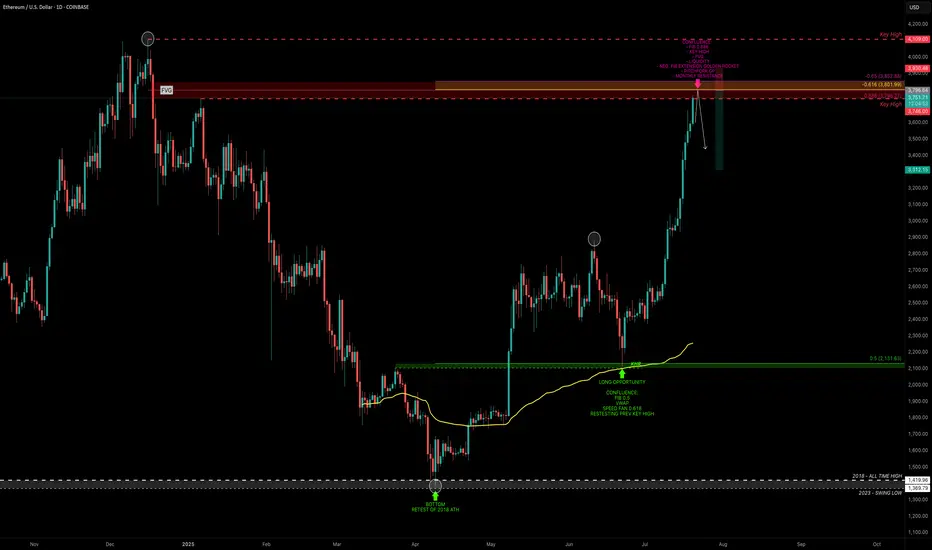
ETH — Rally Exhaustion or More Upside?ETH has been on an absolute tear. After retesting its old 2018 all-time high, it marked a bottom at $1383 — a brutal -66% correction over 114 days from the $4109 top.
From there, ETH ripped +100% in just one month, followed by 40 days of consolidation, and now, over the past 28 days, it’s surged another +76%, currently trading around $3715 — all without any major correction.
So the big question:
What’s next? Are we near a short setup, or is it time to long?
Let’s break it down.
🧩 Key Technicals
➡️ Bounce Zone:
On June 22, ETH retested the 0.5 fib ($2131.63) of the prior 5-wave Elliott impulse, with extra confluence from:
Anchored VWAP
Speed fan 0.618
➡️ Key Highs to Watch:
$3746 → recent local high
$4109 → 2021 all-time high
➡️ Fib Retracement Levels:
ETH has smashed through all major fibs, including the golden pocket (0.618–0.65) and 0.786 fib. The 0.886 fib at $3798.27 is the last major resistance, just above the $3746 key high.
At this zone, we also have:
Fair Value Gap (FVG)
Monthly Resistance
Negative Fib Extension Golden Pocket Target
➡️ Momentum Signal:
ETH is currently on its 8th consecutive bullish daily candle — historically, after 8–13 consecutive candles, price tends to cool off or correct. A sign to be cautious about longing here and consider profit-taking.
🔴 Short Trade Setup
Look for a potential SFP (swing failure pattern) at the key high $3746 to initiate a short trade.
This offers a low-risk setup with:
Entry: around $3746 (if SFP confirms)
Target (TP): ~$3300
Stop-loss: above SFP
R:R ≈ 1:4+
💡 Educational Insight: Why You Don’t Want to Long the Top
Markets often trap late longers near key highs or resistance zones — this is where smart money distributes while retail piles in emotionally.
Lesson: Look for zones of confluence (fib, VWAP, liquidity, FVG) and avoid chasing extended moves after multiple bullish candles.
Patience and confirmation at reversal points lead to higher-probability setups — you don’t need to catch every pump.
Final Thoughts
We’re approaching major highs, so this is a time for caution, not FOMO. Watch for reaction and potential reversals near $3750–$3850.
Stay sharp, manage risk — and remember, tops are where longs get trapped.
_________________________________
💬 If you found this helpful, drop a like and comment!
Want breakdowns of other charts? Leave your requests below.
ETH - FULL top-to-bottem AnalysisHere is the full analysis for CRYPTOCAP:ETH as requested 🫡
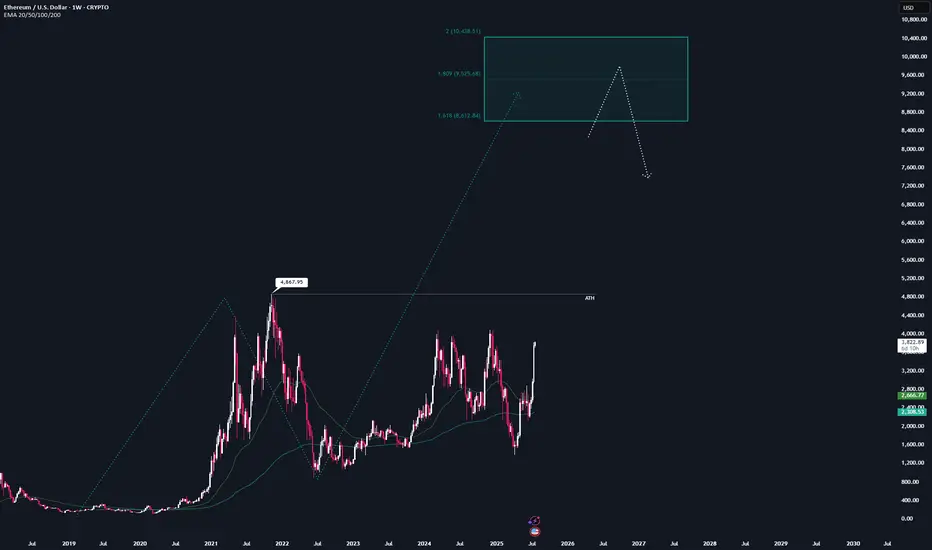
Weekly Time-frame:
We currently have one potential bullish structure for this cycle, which could take ETH into the $8,600–$10,400 price range.
This sequence gets activated once we break the all-time high at $4,867.
That area also marks my maximum target for this cycle — anything beyond that is pure maga FOMO, and I’m not going to gamble on some “super cycle” narrative.
At the weekly level, I wouldn’t recommend making additional buys in the current price range.
If you're still sidelined at this point, you should honestly reflect on your positioning this cycle — we’ve been given plenty opportunities to enter at good prices.
Daily Chart:
Around 1.5 weeks ago, we finally broke through the major resistance at $2.8k, which has been the key level to watch for the past two years.
That breakout also activated a bullish structure, targeting the $4,500–$5,100 range — which aligns with new all-time highs.
However, a retracement before reaching the target zone is always possible, and any pullback should be viewed as a gift for long entries.
I’ll be placing 4 long orders at each Fib level within the orange B–C retracement zone, each with a stop-loss just before the next level.
The key resistance to watch now is around $4k — once we break above that, hitting the target zone becomes highly likely.
Local price action:
Currently, no valid structures can be identified on the lower timeframes.
However, if valid bearish structures appear on the 1H or 4H charts, I’ll consider them for hedge short opportunities.
Summary:
All in all, waiting is the best strategy right now.
I wouldn’t recommend buying in this region anymore — and it's still too early for valid short setups.
Hope this analysis was helpful for at least one person ❤️
Thanks for reading,
Cheers!
Ethereum (ETH/USD) Chart AnalysisEthereum (ETH/USD) Chart Analysis
**Trend Overview:**Ethereum (ETH/USD) Chart Analysis
* The chart shows **strong bullish momentum**, with Ethereum maintaining an upward trend of **higher highs and higher lows**.
* The price is currently around **\$3,618**, well above the key moving averages:
* **EMA(7): \$3,610**
* **EMA(21): \$3,539**
* **EMA(50): \$3,419**
**Support Levels:**
* The recent pullback found support at the **\$3,570–\$3,600 zone**, which is now acting as a **key horizontal support**.
* Below this, **EMA 21 (\$3,539)** and **EMA 50 (\$3,419)** offer additional dynamic support zones.
* Marked support areas **S1 and S2** also highlight previous breakout zones that could act as strong demand levels if retested.
**Bullish Outlook:**
* As long as ETH stays **above the support zone**, the bullish trend is likely to continue.
* A bounce from the current level could lead to a **retest of \$3,740**, followed by a move toward the **\$4,000 target** shown by the projected green path on the chart.
**Indicators & Sentiment:**
* Price respecting the EMA lines confirms **strong buyer interest** on pullbacks.
* No visible bearish divergence, and the chart structure favors **trend continuation**.
**Conclusion:**
Ethereum remains in a **bullish structure**, with strong support around \$3,570–\$3,600. As long as it holds above this zone, the next upside targets are \$3,740 and potentially \$4,000. A break below the EMAs would signal weakness, but for now, momentum supports continued gains.

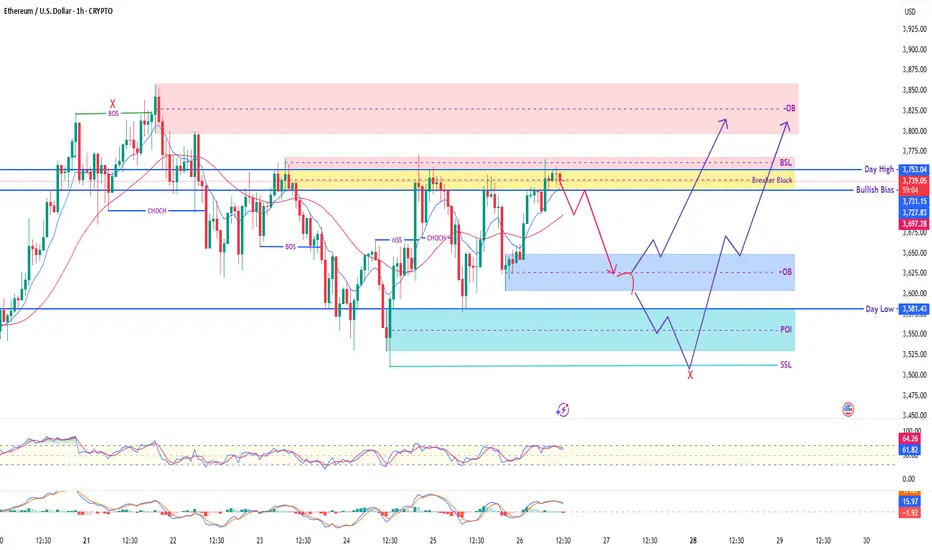
ETH/USD - Ethereum's Next Move? Decoding Price Action! Hey TradingView Family! 👋 Get ready to dive deep into our latest 1-hour Ethereum (ETH/USD) chart analysis. We're tracking some fascinating price action and key Smart Money Concepts that could dictate ETH's next big move!
What We're Seeing Right Now:
Current Price Zone: ETH is currently consolidating around the $3,730 - $3,750 area, right within a critical zone.
Breaker Block in Play: Notice the yellow 'Breaker Block' zone (around $3,700 - $3,750). This was previously support and is now being retested, acting as potential resistance. A break above could signal strength, while rejection confirms weakness.
Liquidity Magnets:
BSL (Buy Side Liquidity) 🎯: Just above us, around $3,750 - $3,770, lies a pool of buy-side liquidity. Price often targets these zones to fuel its next move.
SSL (Sell Side Liquidity) 📉: Down below, near $3,510 - $3,520, we have sell-side liquidity. This is a potential magnet if bearish momentum takes over.
Key Zones to Watch:
Upper Order Block (Red OB) 🔴: Our primary supply zone overhead, from $3,800 to $3,850. This is where we might see strong selling pressure if price reaches it. Also marked with a 'New High' for extra context.
Lower Order Block (Blue OB) 🔵: A potential demand zone below, roughly $3,600 - $3,650. This could act as strong support for a bounce.
Point of Interest (POI - Light Blue) ✨: An even deeper demand zone around $3,540 - $3,590. This area could provide robust support if price continues to drop.
Potential Scenarios (Follow the Purple Arrows! 🔮):
Bullish Path (Uptrend Continuation) 🚀: If ETH can definitively break and hold above the 'Breaker Block' and clear the BSL, we could see a strong push towards the Upper Order Block ($3,800 - $3,850). This would align with a continuation of the bullish bias we've seen.
Bearish Path (Pullback & Reversal) ⬇️: If the 'Breaker Block' holds as resistance, we might see a pullback. Price could find support at the Lower Order Block ($3,600 - $3,650) for a bounce. However, a break below this could lead to a test of our POI ($3,540 - $3,590), and potentially a sweep of the SSL ($3,510) before finding a true bottom.
Indicators Check:
RSI: Currently around 67, indicating strong momentum but approaching overbought conditions.
Stochastic: Showing an upward trend, confirming current bullish sentiment but also nearing the top.
Our 'Day High' ($3,757) and 'Day Low' ($3,581) are crucial pivot points to monitor!
Always remember to trade smart, manage your risk, and wait for confirmation. This is not financial advice. Do your own research! 🛡️📊
Don't forget to Like 👍, Comment 💬, and Follow for more detailed analyses!
#ETH #Ethereum #Crypto #Trading #TechnicalAnalysis #SmartMoneyConcepts #PriceAction #ETHUSD #TradingSetup #MarketAnalysis"
$Ethereum / USD 4H AnalysisMARKETSCOM:ETHEREUM / USD 4H Analysis
ETH has shown a massive rally of +82.5%, climbing from the $1,900 area to a local high of ~$3,670.
🔑 Key Levels & Zones:
🔹 Resistance Zone:
~$3,750–$3,800 Price is reacting here after a strong bullish move. Potential local top if no breakout follows.
🔹 First Demand Zone:
~$3,500 Nearest 4H demand zone. A possible area for a short-term bounce or continuation if price retraces.
🔹 Mid-Level Demand Zone:
~$2,950 Previous consolidation zone, now flipped into support. Stronger structure here.
🔹 Deep Support Zone:
~$2,530 Major support in case of a deep correction. Confluence with previous breakout zone and unfilled demand.
🧠 After an 82% run, ETH might enter a short-term distribution or pullback phase. Eyes on how it reacts around $3,500. If that level holds continuation possible. If not expect deeper retracement.


ETH BUY SETUP ,Bought From $3620ETH BUY SETUP
Currently $3620
Bought From $3620
(Trading plan If ETH go down
to $3520 will add more longs)
Expecting target $3715 OR ABOVE
In the event of an early exit,
this analysis will be updated.
Its not a Financial advice

ARKK: The Calm Before the Innovation Storm -ALTSEASON Is COMING🚀 ARKK: The Calm Before the Innovation Storm 🌪️
The markets are shifting, and disruption is about to go vertical. ARK Innovation ETF (ARKK) is quietly positioning itself for what could be the most explosive move of this decade. With high-conviction bets in AI, Bitcoin, genomics, and next-gen tech, this isn’t just a fund—it’s a launchpad for exponential growth.
This post breaks down exactly why ARKK could go parabolic—and why the smart money is already moving in. 👇
Explosive upside in 2026
ARKK is already up over 24% YTD , showing strong momentum compared to broader markets and signaling early stages of a potential parabolic move .
High-conviction concentration in game-changers
Top 10 holdings include Tesla, Roku, Zoom, Coinbase, UiPath, Block, Crispr Therapeutics, DraftKings, Shopify, and Exact Sciences. These are leaders in innovation sectors with massive upside potential .
Deep exposure to Bitcoin and digital assets
Heavy allocation to Coinbase and Block gives indirect exposure to Bitcoin . If BTC breaks into a new cycle high , ARKK stands to benefit significantly.
Positioned in exponential growth sectors
Focus on AI, genomics, EVs, fintech, robotics, and blockchain , all of which are entering accelerating adoption phases globally.
Aggressive smart-money accumulation
Cathie Wood’s team continues buying aggressively during dips, reinforcing institutional confidence in the fund’s long-term trajectory.
Technical breakout structures forming
Ascending triangle and multi-month consolidation breakouts suggest a technical setup primed for explosive upside .
Innovation supercycle aligning
ARKK's themes are aligned with major global shifts like de-dollarization, decentralized finance, and AI convergence .
High beta = massive upside leverage
With a beta above 2 , ARKK tends to outperform in bull runs , offering leveraged exposure to innovation without the need for margin.
Resurgence of top holdings
Names like Coinbase, Tesla, Shopify, and Roku are up 50%–100% YTD , driving ARKK’s NAV growth and fueling bullish sentiment .
Long-term vision with short-term catalysts
The fund projects 5x returns over the next five years , while Bitcoin halving cycles, tech innovation, and regulatory clarity serve as short-term ignition points .
Marty Boots | 17-Year Trader — smash that 👍👍, hit LIKE & SUBSCRIBE, and share your views in the comments below so we can make better trades & grow together!

Ethereum gains momentum: SEC green light and Banks ShiftEthereum gains momentum: SEC green light and JPMorgan’s historic shift
By Ion Jauregui – Analyst at ActivTrades
Ethereum once again takes center stage in financial markets after a week full of positive signals: on one hand, the long-awaited clarification of its regulatory status by the SEC; on the other, the unexpected opening of JPMorgan to cryptocurrencies. All this in a context of growing institutional interest and corporate adoption.
Washington clears the path: ETH is a commodity
The chairman of the SEC, Paul Atkins, has resolved one of the biggest uncertainties in the crypto ecosystem: Ethereum will not be treated as a security, but as a commodity. In other words, it falls outside the scope of the SEC’s strictest regulations and is placed on the same level as bitcoin from a regulatory standpoint. This shift, which ends years of ambiguity, comes just as Ethereum spot ETFs begin to gain traction. On July 16 alone, these products recorded a net inflow of $726 million, reflecting strong demand from large investors. By way of explanation:
Security: A financial instrument representing a share in a company or a credit, such as a stock or bond. It is subject to financial market regulation (such as the SEC in the U.S.), especially regarding transparency, registration, and investor protection.
Commodity: A standardized tradable good, often raw, such as oil, gold... or bitcoin, according to regulators. It does not imply any ownership rights in a company and is not subject to the strict regulation applied to securities, but is instead overseen by other agencies like the CFTC.
JPMorgan breaks with the past and moves closer to cryptocurrencies
Jamie Dimon, CEO of JPMorgan and until recently a staunch critic of bitcoin, has made an unexpected move: the bank is studying the possibility of offering loans backed by cryptocurrencies like BTC and ETH. The system would allow clients to obtain liquidity in dollars without selling their crypto assets, by depositing them as collateral.
The bank would not directly custody these assets but would delegate that function to specialized providers such as Coinbase Custody. Although still in an exploratory phase, this represents a radical change in the relationship between big banking and the crypto world.
Trump Media, Western Union and Polymarket stoke the crypto narrative
It’s not just banks that are positioning themselves. Trump Media & Technology Group (TMTG) confirmed a $2 billion investment in bitcoin, making it the fifth publicly traded company with the largest BTC holdings in the world. The company is also preparing the launch of its own token on Truth Social, its social network.
Meanwhile, Western Union is exploring the use of stablecoins to improve the efficiency of international transfers, while Polymarket is studying the launch of its own stablecoin or a partnership with Circle (USDC). All this is happening after the recent approval of the GENIUS Act, which for the first time regulates these types of assets in the U.S.
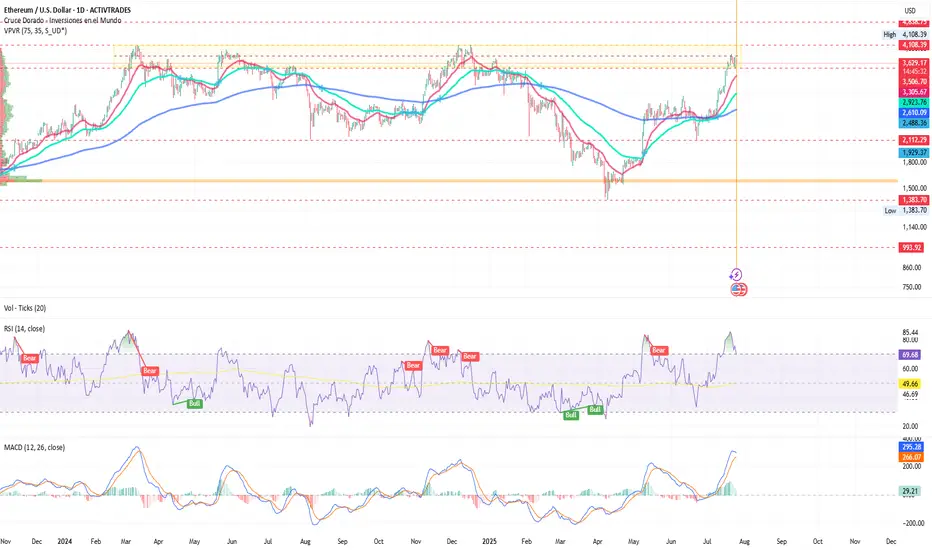
ETH/USD analysis: Beginning of a new bullish phase?
On the charts, Ethereum has responded to the macro and political environment with sustained recovery since April, entering a partial consolidation phase during several months this year. After holding the support level around $2,579, and since the golden cross on the 10th of this month, it has consolidated a price expansion leading it to test a new consolidation zone around $3,500. ETH now aims for more ambitious levels that could push the commodity towards recent highs of $3,857.67 and potentially break through to $4,000.
Currently, the price is within a range it has tested for the fourth time. If it fails to break out, we could see a pullback towards $2,700 or even a return to previous supports at $2,112 and the long-term point of control at $1,586.
Key support: $2,579
Immediate resistance: $3,857.67 (recent highs)
Target zone: $3,850 – $4,000 if a clean breakout occurs
Danger zone: Below $2,880, bearish pressure could return
Ethereum ready to make the leap
With the SEC’s legal backing, a recent surge in volume, the rise of spot ETFs, and the shift in traditional banking led by JPMorgan, Ethereum is cementing its role as a strategic asset in the new financial era, ready to lead the next phase of crypto adoption. This time, with Wall Street watching closely. Ethereum appears ready to play a leading role in the next stage of integration between traditional and digital finance — and it seems that big banks are betting heavily on ETH.
Ethereum is no longer in bitcoin’s shadow. Today, it stands as a key player in bridging traditional finance and the digital future.
*******************************************************************************************
The information provided does not constitute investment research. The material has not been prepared in accordance with the legal requirements designed to promote the independence of investment research and such should be considered a marketing communication.
All information has been prepared by ActivTrades ("AT"). The information does not contain a record of AT's prices, or an offer of or solicitation for a transaction in any financial instrument. No representation or warranty is given as to the accuracy or completeness of this information.
Any material provided does not have regard to the specific investment objective and financial situation of any person who may receive it. Past performance and forecasting are not a synonym of a reliable indicator of future performance. AT provides an execution-only service. Consequently, any person acting on the information provided does so at their own risk. Political risk is unpredictable. Central bank actions can vary. Platform tools do not guarantee success.
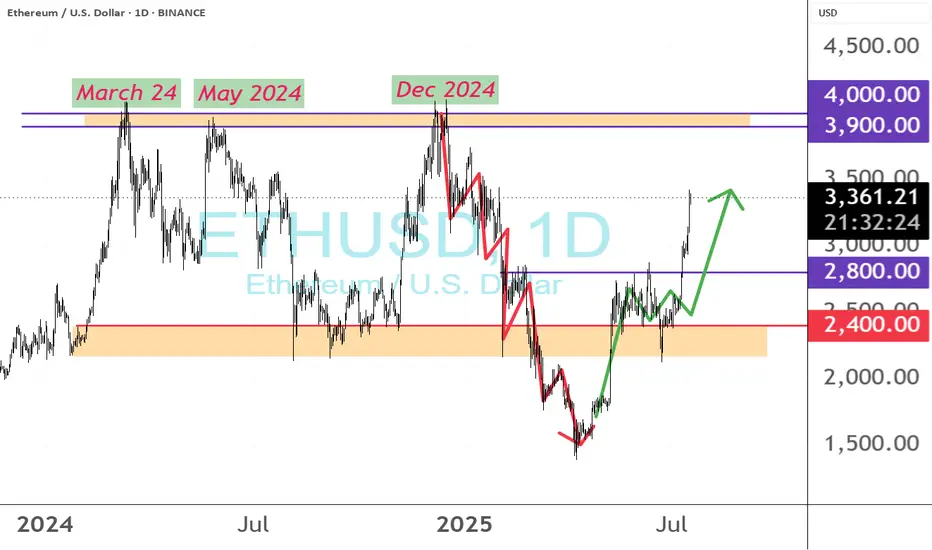
ETH $3,900–$4,000 Major Resistance: Can This Rally CLEAR $4,000?#ETH $3,900–$4,000 is still a very major resistance for ETH, having been tested in March, June, and December 2024… all without success. Let’s see if this rally is able to CLEAR the $4,000 level?

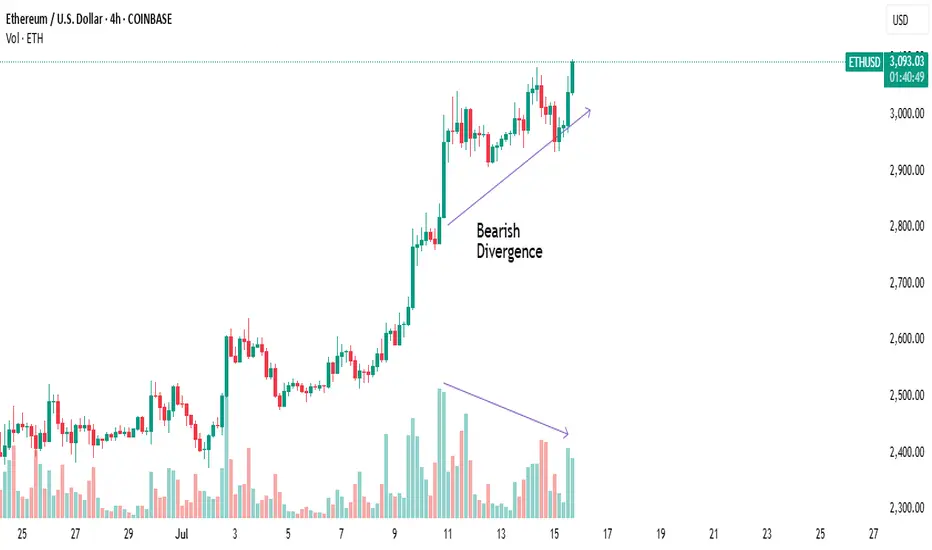
$Eth Faces Double Top Resistance with Bearish RSI DivergenceETH/USDT | 4H Analysis
Ethereum is currently showing signs of weakness on the 4H chart, forming a potential double top pattern around the $3,700-$3,680 range.
Adding to this, the RSI is exhibiting bearish divergence, suggesting that bullish momentum is fading. There's a visible liquidity gap between $3,200–$3,180, which might act as a magnet in the short term. A retest of this zone is likely before ETH attempts to resume its upward move.
Key Observations:
🟠 Double top structure on 4H chart
🔻 Bearish RSI divergence
🕳️ Favorable gap: $3,200 – $3,180
🔁 Watch for price reaction after retest
⚠️ If ETH holds the $3,180 support after filling the gap, a bullish bounce toward higher levels could follow.
📌 This idea is for educational purposes. Trade wisely with proper risk management.
Ethereum – Calm Before the Next Leg Up?Ethereum had a disappointing start in 2025.
After pushing above $4,000 in mid-December 2024 — with headlines full of "$10K ETH coming!" — the new year began around $3,500, and what followed was a slow bleed.
By early April, Ethereum printed a shocking low at $1,380 — a level few believed was even possible.
But the bounce from there? ⚡
It was explosive — nearly +100% in just one month, with price topping around $2,700.
Since then, we’ve been consolidating — and that’s completely normal after such a vertical move.
🔍 So, what’s next?
Technically, ETH is forming a rectangle, a structure that often resolves as a continuation pattern.
The spike down to the $2,300 zone on May 19th was telling — buyers stepped in aggressively and pushed price back above $2,500, which now acts as a comfort zone for bulls.
📌 Conclusion
I’m looking to buy dips, ideally near $2,550, and my target is the $3,500 zone.
No need to reconsider the bullish outlook as long as price holds above $2,300.

New phase of ETH adoption? holding longLot of bills and adoption of ETH ecosystem, i do like the idea of another 2017 like breakout, CRYPTOCAP:ETH COINBASE:ETHUSD

ETH READY TO RIPAfter enduring a prolonged and painful correction, Ethereum has tested the patience of many crypto investors, particularly those anticipating the long-awaited arrival of altcoin season. Sentiment across the space has remained cautious, as repeated failed rallies and a lack of follow-through have left many questioning whether the broader alt market will ever regain momentum.
However, there are now early indications that conditions may be shifting. A notable bounce has occurred from the overall low anchored VWAP—a level that has historically acted as a key reference point for value and trend continuation. The presence of responsive buyers at this level suggests it may be establishing itself as a strong demand zone, potentially forming the foundation for a broader structural reversal.
Additionally, subtle but important changes in market structure are beginning to emerge. We're seeing higher lows form on shorter timeframes, alongside a reduction in selling pressure—both of which are early signs of a possible trend change. If Ethereum can sustain its hold above this support and reclaim key resistance levels with strength, it could ignite renewed confidence across the altcoin market.
Should this prove to be a meaningful low, it may very well set the stage for alt season to finally take shape—bringing with it a rotation of capital into high-beta assets and broader participation across the crypto space.

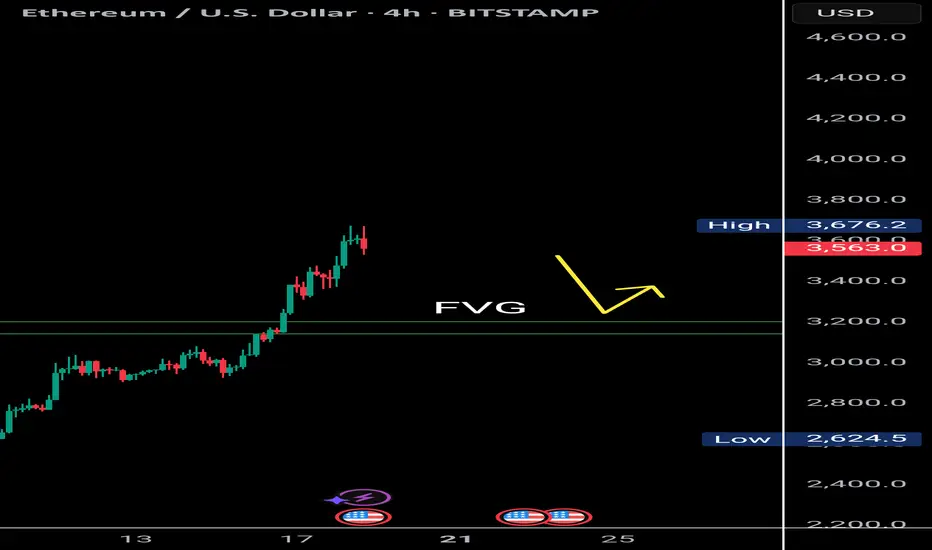
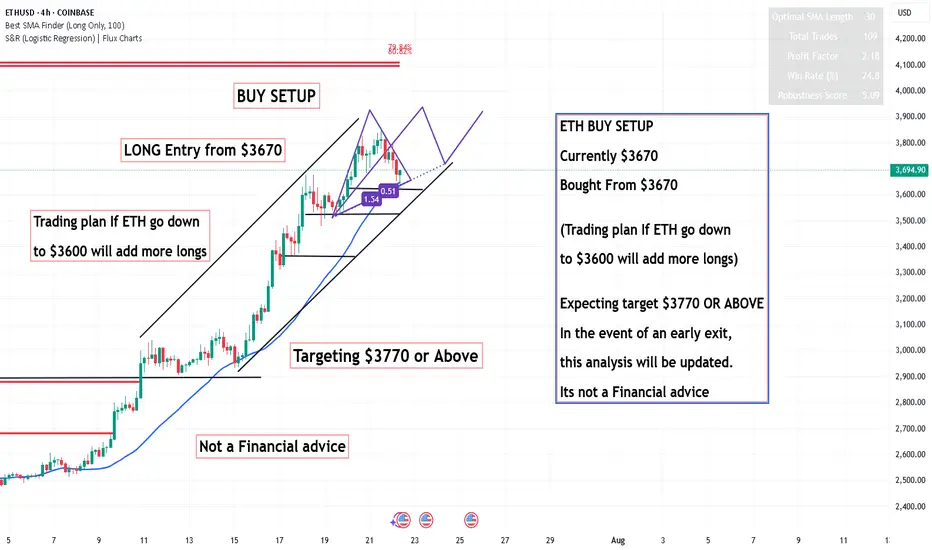
ETH BUY SETUP ,Bought From $3670ETH BUY SETUP
Currently $3670
Bought From $3670
(Trading plan If ETH go down
to $3600 will add more longs)
Expecting target $3770 OR ABOVE
In the event of an early exit,
this analysis will be updated.
Its not a Financial advice
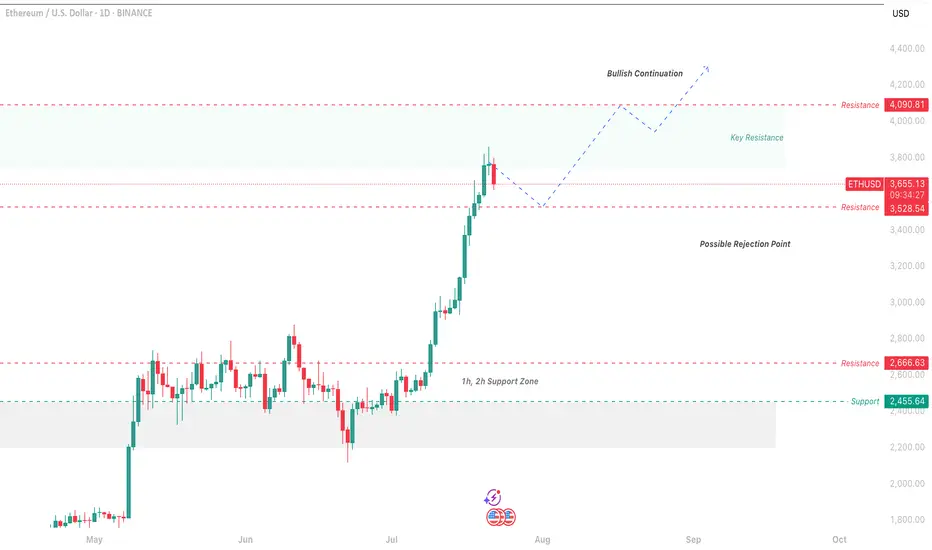
ETH Price Analysis & Bullish Continuation Prediction 4h & 1DThis analysis examines the Ethereum/US Dollar 1-day chart from Binance, focusing on a potential bullish continuation as of July 22, 2025. The chart indicates a recent upward movement following a consolidation phase, with the price approaching a key resistance at $4,090.81. As a reader, I’d want to grasp the context: the 1-hour and 2-hour support zone around $2,455.64 has provided a strong foundation, while the current price action suggests a possible rejection point near $3,600.00 if it fails to break resistance.
My thought process starts with the support zone at $2,455.64, which has historically held, indicating a solid base for any upward move. The price has now reached $3,600.00, a level where it could either break out toward $4,090.81 or face rejection. A successful break above $4,090.81 with increased volume could lead to a continuation toward $4,200.00. However, if the price falls below $3,600.00, it might signal a retreat back to the support zone, invalidating the bullish outlook.
Profit Targets:
Short-term: $4,090.81 (key resistance)
Long-term: $4,200.00 (bullish continuation)
Stop Loss: $2,455.64 (below the 1h/2h support zone)
These targets and stop loss levels provide clarity for managing the trade effectively.
Ethereum is not going up?The impact of the crypto bull run is not trickling down to altcoins, and despite major buying, why Ethereum (ETH) price is not going up?
Read more here: www.cointrust.com
ETH/USD Short Setup – Bearish Opportunity Amid Bullish RSI DiverLooking to short Ethereum at current levels as price action shows bullish RSI divergence at the top, signaling potential exhaustion of the uptrend.
Trade Plan:
Sell Stop: 3,680
Stop Loss: 3,865
Take Profit 1: 3,495
Take Profit 2: 3,310
This setup aims to capitalize on a potential reversal as momentum weakens. Managing risk carefully with a well-placed SL above the recent high.
🔍 Watching closely for confirmation — a break below 3,680 would validate entry.
#ETHUSD #CryptoTrading #ShortSetup #TechnicalAnalysis #RSIDivergence
