ETHUSD📊 1D Analysis – ETHUSD
Strategy: 🐊 Alligator Strategy
Trend: 📈 Strong Uptrend
📝 Trade Plan
🎯 Entry Point (EP): 2577
🛡️ Stop Loss (SL): 2514.76
💰 Take Profit 1 (TP1): 2645.46
🚀 Take Profit 2 (TP2): 2706.17
Open two trades When TP1 hits move your SL to Entry point for and ride TP2.
ETHUSD trade ideas

ETHUSDTThis chart illustrates Ethereum’s price action on the daily timeframe, showcasing a clear structural outlook based on historical price behavior and major resistance zones.
Ascending Trendline Support: ETH is currently respecting a long-term ascending trendline (white and blue lines), which has acted as dynamic support since mid-2022. Despite temporary breakdowns, price has re-entered this channel, suggesting bullish momentum is attempting a recovery.
Key Resistance Zones:
$4,000 – $4,800: This is the nearest major resistance area, highlighted by past cycle tops. ETH must decisively break above this zone to confirm a macro bullish continuation.
$6,800 – $7,600: A significant mid-cycle resistance from historical price action, likely to serve as the next major target upon breakout.
$9,200 – $10,000: The final upper target zone on this chart, representing psychological and technical resistance if ETH enters a strong bull market phase.
Current Price: As of today, ETH is trading around $2,580 with a +1.09% daily gain, suggesting a potential continuation towards the first resistance zone.
This analysis suggests that Ethereum is attempting a macro reversal, and reclaiming the ascending channel strengthens the bullish case. However, multiple resistance levels remain overhead, which will require strong volume and market sentiment to overcome.

ETH/USD – Key Support Holding, Eyes on 3000 for Upside TargetEthereum is maintaining a strong bullish structure within a clearly defined ascending channel. Recent price action shows a successful retest of the lower channel boundary and the horizontal support zone around 2477 – 2450.
🔹 Support & Trendline Confluence:
The support zone at 2477–2450 is aligned with the lower boundary of the rising channel.
Multiple successful retests of this trendline indicate strong demand in this area.
🔹 Bullish Scenario:
As long as the 2477–2450 support zone holds, ETH/USD has a good chance to resume its upward move.
The next target for bulls is the 161.8% Fibonacci extension level at 2997.24, which coincides with the upper channel boundary.
📌 Plan:
Long positions are favored as long as price holds above 2450.
Targeting 2997, with intermediate steps of confirming higher lows.
📉 Invalidation:
A break and daily close below 2450 would invalidate this bullish scenario and suggest further downside.
This is a classic “buy-the-dip” scenario within an established uptrend, offering a favorable risk/reward opportunity.

ETHUSD Futures: Breakout + Momentum Buy SetupEthereum has broken above the local trendline and flipped structure bullish. CCI confirms upward momentum with a breakout from consolidation.
📌 Entry: Market buy (current price ~2583)
🎯 Targets:
TP1: 2628 — prior high and minor resistance
TP2: 2678 — strong liquidity zone
🛡️ Stop-loss: Below 2520 support block
Bullish momentum supported by EMA cross, structure break (CHoCH), and CCI triangle breakout. Potential to extend toward 2729 if volume follows.

ETHUSD 15MThe chart you've shared is a 15-minute candlestick chart for Ethereum (ETH/USD) on Coinbase, showing a technical analysis scenario with these elements:
1. Ascending Trendline: ETH was in an upward trend, as indicated by the blue support line connecting higher lows.
2. Register Level: Around the $2,575–$2,578 zone, this is identified as a resistance area where price reversed.
3. Entry Level: Just below the trendline around $2,560, marked as the suggested sell (short) entry after the breakdown.
4. Bearish Breakdown: Price broke below the trendline and entry level, triggering a sell signal.
5. Target Successful: The projected downside move (highlighted with the blue arrow) hit the target area near $2,485–$2,490, indicating a successful short trade.
This is a classic trendline break and retest short setup, often used in day trading strategies. The chart suggests the trader took a short position after the trendline broke and targeted the previous support zone, with the move playing out as expected. Let me know if you’d like help interpreting this for future trades or if you want a similar analysis for another chart.

ETHEREUM LONG of the YEARthe time is approaching for ETHEREUM, tik tok time is this year..
This potential escenario is LONG YEAR possible escenario
Its time to HOLD some power on this ! Maybe November is the month to close

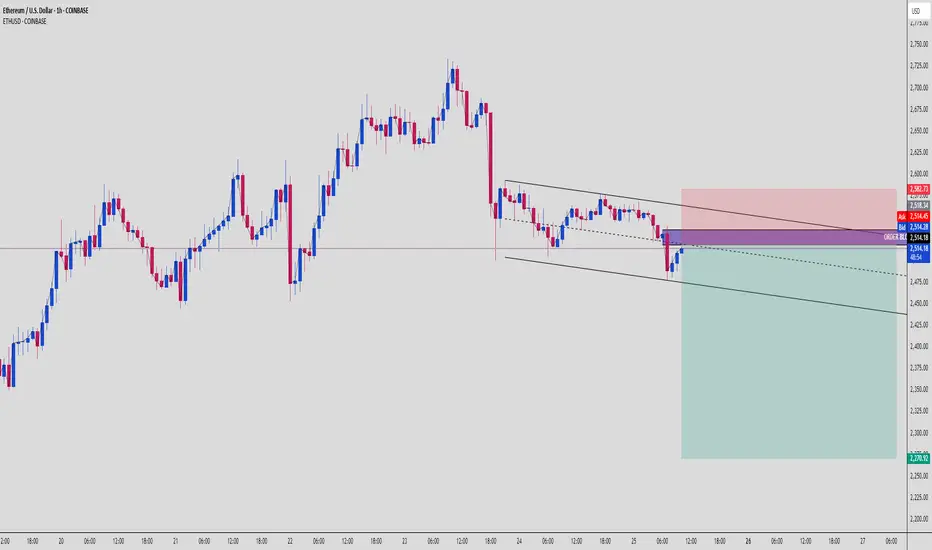
ETH Trap & Drop Setup – OB Rejection + Bearish Channel📉 Ethereum (ETHUSD) | 1H SMC Breakdown | Bearish Setup Explained
Another clean setup for the SMC gang. ETH just gave us a beautiful opportunity, respecting market structure, reacting to Order Block supply, and aiming to clean up sell-side liquidity. Let’s dive in 👇
🧱 1. Structure: Bearish Channel Formation
ETH has been moving in a tight bearish channel, producing:
Lower highs (confirmed supply zones)
Lower lows (liquidity grabs + structure breaks)
This shows consistent bearish pressure.
🧊 2. Premium OB Tap + Rejection Zone
Price just retraced into a Bearish Order Block sitting in the Premium zone, right around $2,514.
💥 OB zone is aligned with:
Upper channel resistance
Supply rejection
Clean inefficiency fill
Price wicked inside and immediately rejected = Smart Money active.
🧠 3. Retail Psychology Trap
Retail likely:
Longing support bounce
Placing stops under structure lows
Not respecting OB/imbalance narrative
Meanwhile, Smart Money:
Enters short from OB
Targets imbalanced zones
Eyes the $2,270 weak low
🎯 4. Liquidity Pool & Final Target
🔻 Target Zone: $2,270
This level is:
A weak low (high chance of being swept)
Sits at lower channel boundary
Acts as a liquidity magnet
Expect price to accelerate as it approaches this zone.
⚔️ 5. Trade Plan (Short Setup)
📍 Entry: $2,514 OB Zone
🔐 Stop Loss: Above $2,582 (structure break + OB invalidation)
🎯 Targets:
TP1: $2,460
TP2: $2,400
TP3: $2,270
⚖️ RRR: ~1:4+ – high precision trade
🧠 Key Concepts in Play:
Order Block Rejection
Premium Pricing Sell Setup
Bearish Channel Continuation
Liquidity Sweep Targeting
📌 Chart Summary:
"Don’t chase candles – follow the narrative. OB tells the story, liquidity gives the profit."
📚 Study the OB zone reaction. These setups repeat every week across assets if you know what to look for.
💬 Drop “ETH OB SNIPER” in the comments if this is your kind of entry.
📈 Tag a trader who needs to stop fading Smart Money moves!
7400 ethOn the weekly timeframe we are hitting a huge symetrical triangle consolidation. 430% return if you got in at that last bottem. its not to latte but be careful entering in no mans land comment what you thing

Sideways Still in Play for ETH After RejectionIf you find this information inspiring/helpful, please consider a boost and follow! Any questions or comments, please leave a comment!
Recap
Ethereum just tapped into a key Area of Interest and got rejected. The move confirmed short-term resistance while keeping the broader wave structure intact. Although no clear breakdown has followed, the rejection signals that the asset is still mid-cycle.
The expectation now is for a sideways consolidation. This aligns with a developing wave 4, but the price action ahead will determine how this structure unfolds.
Wave Structure
At present, the count favors a completed wave 3 followed by a wave 4 that is still forming. The rejection at the AOI fits the narrative of a corrective structure underway. Whether that plays out as a triangle or a flat will depend on how the next legs print.
Key markers are in place:
AOI was respected
No breakdown of the prior key support level
Above the 0.382 to 0.5 retracement zone remains in focus as a reaction area
Should price expand beyond typical retrace/time boundaries, the degree of the count may need to be adjusted. A more complex correction or a deeper reset could shift the current interpretation from a wave 4 into something more substantial.
Outlook
• Rejection confirms resistance
• Expecting sideways movement to continue
• Watching the 0.382 to 0.5 zone for key price behavior
• Price action will determine the next wave structure
• If momentum expands rapidly, degree reassessment is on the table
Ethereum’s current posture suggests a market in digestion mode. Whether this leads to a launch into wave 5 or deeper corrective behavior, the next prints will be critical. No confirmation of bullish continuation yet.
More updates soon as the next leg develops.
Trade safe, trade smart, trade clarity.

ETH at Critical Supply Zone! Will the Bulls Hold or Dump to $180Ethereum is consolidating just below the key supply zone at $2,670, and this range is heating up fast! After the sharp rally earlier in May, ETH is showing clear exhaustion signs right where supply is thickest.
Chart Context (1H Timeframe - Coinbase):
Price is trapped below the $2,671.27 resistance, inside a visible supply zone (highlighted in blue).
Multiple lower highs forming, with momentum fading on each attempt to break higher.
Downside liquidity targets marked with red arrows show potential price magnets if we break structure.
Key Levels to Watch:
Immediate Resistance: $2,670 – Supply-heavy zone.
Local Support: $2,245 – If this cracks, watch for increased bearish pressure.
Bear Targets:
$1,822 – March consolidation demand zone.
$1,622 – Strong historical demand, previous breakout base.
Market Outlook:
If bulls fail to reclaim $2,670, a swift move toward $2,245 then $1,822 is very likely.
Heavy U.S. economic calendar ahead (see icons near May 27–29), which could trigger volatility.
What to Watch For:
Breakout & reclaim above $2,670 = bull continuation to $2,800+
Breakdown below $2,245 = high-probability short setup
Volume and candle structure near the top showing signs of distribution
Strategy Suggestions:
Scalpers: Short rejections near $2,670 with stops above the zone.
Swing Traders: Wait for a breakdown confirmation below $2,245.
Buyers: Watch the $1,822–$1,622 demand zone for potential long entries.
Let’s discuss in the comments: Do you expect a bullish breakout or a rug pull from here?
#Ethereum #ETHUSD #Crypto #PriceAction #SupplyDemand #ETHBulls #ETHBears #TechnicalAnalysis #TradingView #SwingTrading

ETH/USDDISCLAIMER: I am not a financial adviser. those videos and posts on my channel are for educational and entertainment purposes ONLY. I'm documenting my trading journey so that you have the potential to take ideas and inspiration from the videos that may help you within your own journey. But remember, trading/investing of any kind involves risk. Your trading/investments are solely your responsibility .

eth longeth long after h4 bullish bos, activated inverted h&s, retraced 90% of last bullish impulse and bropke counter momentum tend line

ETH Update — RSI Divergence & Double Top FormingEthereum is showing a clear RSI divergence paired with a developing double top, making this a key area to manage risk.
I’ve personally taken profit on my longs and am watching how price reacts in this range.
- Next resistance: $2,840
- Key support: $2,200
Right now, I don’t like the risk-to-reward of holding. There’s more downside exposure than upside potential from this level — at least until structure confirms otherwise.

ETHUSD: The Market Is Looking Down! Short!
My dear friends,
Today we will analyse ETHUSD together☺️
The recent price action suggests a shift in mid-term momentum. A break below the current local range around 2,202.5 will confirm the new direction downwards with the target being the next key level of 2,489.5 and a reconvened placement of a stop-loss beyond the range.
❤️Sending you lots of Love and Hugs❤️

Fractal (bar pattern) ETH vs SP500(1991)In the coming week we will wait for a possible correction under the entry into long on ether.
If there is no rollback, then we will continue to grow on the spot.
In any case, according to the fractal, we should reach $4000 in July.

ETHUSD ETHUSD 1hr analysis
Bullish Divergence formed in 1hr time frame
If TP1 hit and no any bearish sign trail SL and wait for TP2

ETH correctionETH will do correction maybe until 24-25 may +-1 day,
no need explanation.
our target is 2300 , but it can go lower to 2000
for more accurate information just follow me.
dont regrets if you dont. hahaha ;)

Eth Bottom CRYPTOCAP:ETH JUST TOUCHED THE GREEN ZONE AND BOUNCED AGAIN.
It marked every macro bottom in the past.
And each time… Ethereum exploded.
This time won’t be different.
Let the rally begin.

bullflag on eth daily tf?Question is, are we bull flagging here? ;)
Lets wait and see how this one plays out.

Short and buy inside 2300 Failed the breakout opportunity sideways upwards right until resistance showed strength and demand short; the 2450 support is getting weaker and in high volatility .
The sell pressure is high and we could see a breakdown soon. See you at the buy zone

ETH Just Slapped Into an Order Block — Next Stop: Dump City?🔎 Ethereum Smart Money Sell Setup | May 17, 2025
The ETH/USD 30-minute chart just gave us a juicy bearish confirmation off a clean Order Block rejection, wrapped in a downward sloping parallel channel — exactly what smart money watches for. Here’s the breakdown:
🧩 1. SMC Narrative
Price tagged a bearish OB right at the mid-supply zone 🟣
Followed by strong engulfing rejection candle
Breakdown from the minor trendline support → confirms bearish shift
Order block lines up with the premium zone of the overall bearish channel
Retail might think this is support — we see liquidity 👀
🎯 2. Trade Specs
Entry: ~2,516.09 (OB upper edge)
SL: 2,520.00
TP Zones:
TP1: 2,476.99 ✅ (almost hit)
TP2: 2,450
TP3: 2,409.47 (final target at channel low)
Risk-to-Reward: Approx 1:4.5
🛠️ 3. Why This Setup Works
Price delivered a channel breakout + OB rejection combo
Strong volume spike during the OB touch = institutional activity
The bounce off the OB is weak — signaling exhaustion
All signs point to a grind down to lower channel support
If you know, you know — this is how banks exit in stealth mode 🚪👻
🎯 Bonus Tip:
If ETH retests the OB zone again with weak bullish candles — that’s your secondary sniper entry 🎯
📣 What’s your bias? Think bulls can reclaim this OB, or are we headed straight into deeper discount pricing?
📲 Follow @ChartNinjas88 for daily laser-focused setups, SMC concepts, and precision trading breakdowns!

ETH - Ethereum Weekly Chart🔍 Market Structure & Smart Money Analysis:
✅ Bullish Signs:
Recent CHoCH at $2,000: Suggests shift from bearish to bullish order flow
BOS above recent resistance: Confirms upward market structure
Stochastic Oscillator: Turning bullish from oversold area (momentum confirmation)
Volume Pickup: Suggests stronger buyer interest
🧠 Liquidity Zones:
Equal Lows (EQL) seen in 2023 and again near 2024 → were taken out → classic liquidity sweep before reversal
Weak High near $4,951: A future potential liquidity target
Supply Zone around $3,200–$3,700: Previously strong resistance, could act as a rejection point again
🧭 Trend Summary:
Macro Structure: Recovering from multi-month downtrend
Short-Term: Bullish momentum building post-reversal
Next Objectives:
Bullish target: $3,200–$3,700 (possible pause or reversal zone)
Bearish invalidation: Drop below $2,000 with strong candle body
📝 Conclusion & Outlook:
ETH has likely confirmed a bullish shift on the weekly timeframe with the CHoCH and BOS above $2K.
Immediate upside targets are within the $3,200–$3,700 region before facing stronger resistance.
This could be the beginning of a longer-term accumulation → markup cycle, targeting the $4,950+ liquidity zone eventually.
Keep monitoring weekly closes and volume, and watch for divergence or rejection signals near supply zones.
-------------------
----------------------------
Low Market Cap #RWA #RealEstate #Tokenization Platforms by FDV
SQRB $100K on PROBIT
$RNB $310K
$HTS $1.9M
$STBU $3.5M
LAND $3.6M
-----
Not for recommendations to BUY SELL any stocks, cryptos, FX or securities
Not for Financial Advise
DYOR

Back at 1st..BITSTAMP:ETHUSD Back to retest 2500 lower than expected. Now reactivating 1st Idea for 2nd attempt with newly fresh target 28xx-31xx. zbee!
