ETHEREUM CLEAR BREAK (LONG)A CLEAR brake than that is impossible... only in a dream
Fools are selling!
Smart money is buying.
ETHUSD trade ideas

ETH is RANGINGthe best way to trade eth in today's markrt is to play the rebound, buy when its low and sell at the peak , huge ranging strategy for those who know
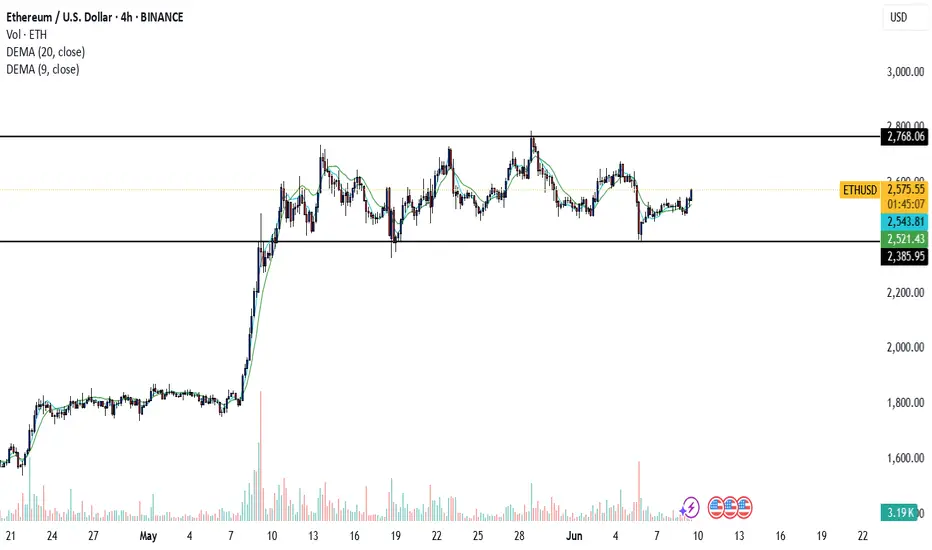
ETHUSD next move ETHUSD – 4H Chart Analysis
Structure: Downward Parallel Channel
Market Behavior: Price is respecting both support and resistance levels within the channel
Current Position: Price is testing the upper boundary / resistance zone
📉 Sell Bias – Potential rejection from resistance zone
Entry: 2559
Stop Loss: 2614
Target: 2379

High-Probability ETH Swing Trade Setup with 3.5:1 Risk-Reward Ethereum Swing Trade Setup with a 3.5 Risk-Reward Ratio —
Entry at $2,756
Stop Loss at $2,604
Target at $3,300.
This is for educational purposes only.
Ethereum Swing Trade: Short Setup with 2.2 R:R PotentialEthereum is approaching a potential breakdown from its current channel. A short swing trade setup with a 2.2 risk-to-reward ratio is forming. Wait for a confirmed break below the channel before entering.
Entry: $2,553
Stop Loss: $2,680
Target: $2,266
This is for educational purposes only.

parellel channelif price breaks the channel then long if not then play for small risk rewards in the zone.

ethusd for short *The content on this analysis is subject to change at any time without notice, and is provided for the sole purpose of assisting traders to make independent investment decisions.

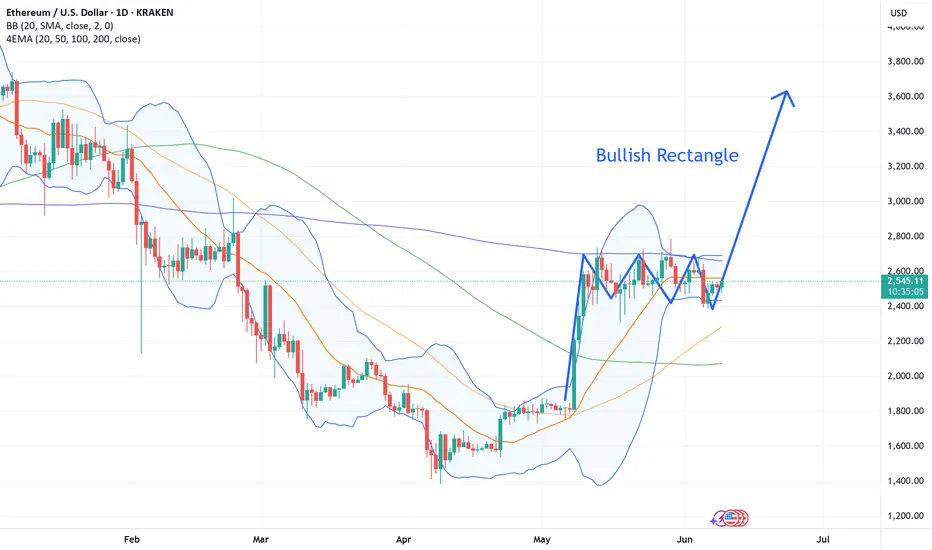
Bullish RectangleBullish Rectangle. The potential price target following a breakout from a bullish rectangle is typically estimated by measuring the height of the rectangle and adding it to the breakout point. This provides a rough projection of how far the price might rally.
A bullish rectangle is a chart pattern characterized by price consolidating between two parallel horizontal lines, forming a distinct rectangular shape. The upper line acts as resistance, a level where selling pressure has historically halted price advances. The lower line represents support, where buying interest has consistently emerged to prevent further declines. This period of sideways trading signifies a temporary pause in the prevailing uptrend, as buyers and sellers reach a temporary equilibrium.
Bitcoin dominance continues its upward movementBitcoin dominance continues its upward movement. We can expect some relief starting next week.Bitcoin can break and hold above the $108,000 level.Bitcoin target this week is $120000

ETHUSD is moving within the 2390.00 - 2670.00 range👀 Possible scenario:
The cryptocurrency market saw a slight decline, with the total market cap dropping 1.9% to $3.41 trillion. Ethereum (ETH) fell by 0.9% to $2,478, slightly down from its intraday high. A third of the top 100 coins posted gains, while trading volume decreased to $71.9 billion. Ethereum has since recovered and is trading around $2,544.
Ethereum's upcoming EthCC 2025 conference (June 30 - July 3) could drive price movements, depending on announcements. However, unmet expectations might lead to a selloff, impacting related tokens. The Ethereum Foundation revealed a new treasury strategy focused on a 2.5-year spending runway, emphasizing transparency and decentralization. The plan aims to protect ETH reserves while utilizing DeFi protocols, guided by a “Defipunk” philosophy centered on decentralization and financial privacy. Ethereum investment products saw $296 million in inflows last week, marking a seven-week streak of positive growth. Meanwhile, Bitcoin-based funds experienced $56.5 million in outflows. Regional inflows were strongest in the U.S., totaling $175 million.
✅Support and Resistance Levels
Support level is now located at 2,390.00.
Now, the resistance level is located at 2,670.00.

Monthly Candle volatility growthThe market remains extremely sluggish in the seasonal flat, but there is a possibility of increased volatility this week and next. In this regard, I would like to consider the market situation and the likely prospects. First of all, in the medium term, the probability of a flat of about 100k for bitcoin and 2500 for ether prevails until the opening of the new half-year. There are no sufficient arguments for a significant break and trend towards 210k for bitcoin and 5k for ether. In addition, strong statistics for the United States began to be released, which increases the likelihood of a retest of 1900-2100 on ether and 85-90k on bitcoin. That is, until August, I am still more likely to expect a flat of 95-110k and 2250-2750 under an optimistic scenario. With a more negative picture, there remains the possibility of a major drawdown of the market until the retest of the loyalties of the first quarter on the tops.
A significant spike and bullish trend may be facilitated by the cancellation of Trump's duties voluntarily or in court, a truce in Ukraine, or the consolidation of brent above $ 69-70 while maintaining growth. In the event of a resumption of duties or a collapse of oil below $ 60, the probability of a fall in the crypt will become extremely high.
Against the background of the closing of the last bullish monthly candle and above 2500 on ether, we have technical signals for continued purchases. This week, there is a possibility of a major wave of purchases in the first half of the month with an attempt to move. However, strong US statistics are likely to continue to dampen growth attempts. Starting next week, it is worthwhile to carefully consider the volume of positions in the work due to the high probability of a market drawdown in the second half of the month. At the end of the week, I will assess the probability of maintaining purchases in the second half of the month, depending on the statistics released this week and the dynamics of oil.
To date, I am still considering the most oversold coins for scalping that have not been assigned the chess fio adx monitoring tag with possible growth waves of up to 70-100% from current levels. Fan tokens with a growth potential of up to 100-200% remain in a highly undervalued position, among which I work with atm acm city porto Lazio alpine juv. For storing funds in the medium term, quick looks interesting with the main long-term support at 0.020-21. The cos slf data pivx token can also show growth waves of up to 30-40%.
As I wrote earlier, large-cap coins, against the background of a seasonal flat and likely sales, may continue to fall slowly until August, in the absence of major growth in the tops or the index of dominance of altcoins.

Ethereum H4 | Potential bearish reversalEthereum (ETH/USD) is rising towards a swing-high resistance and could potentially reverse off this level to drop lower.
Sell entry is at 2,659.25 which is a swing-high resistance.
Stop loss is at 2,800.00 which is a level that sits above a multi-swing-high resistance.
Take profit is at 2,363.75 which is a multi-swing-low support that aligns close to the 38.2% Fibonacci retracement.
High Risk Investment Warning
Trading Forex/CFDs on margin carries a high level of risk and may not be suitable for all investors. Leverage can work against you.
Stratos Markets Limited (tradu.com ):
CFDs are complex instruments and come with a high risk of losing money rapidly due to leverage. 63% of retail investor accounts lose money when trading CFDs with this provider. You should consider whether you understand how CFDs work and whether you can afford to take the high risk of losing your money.
Stratos Europe Ltd (tradu.com ):
CFDs are complex instruments and come with a high risk of losing money rapidly due to leverage. 63% of retail investor accounts lose money when trading CFDs with this provider. You should consider whether you understand how CFDs work and whether you can afford to take the high risk of losing your money.
Stratos Global LLC (tradu.com ):
Losses can exceed deposits.
Please be advised that the information presented on TradingView is provided to Tradu (‘Company’, ‘we’) by a third-party provider (‘TFA Global Pte Ltd’). Please be reminded that you are solely responsible for the trading decisions on your account. There is a very high degree of risk involved in trading. Any information and/or content is intended entirely for research, educational and informational purposes only and does not constitute investment or consultation advice or investment strategy. The information is not tailored to the investment needs of any specific person and therefore does not involve a consideration of any of the investment objectives, financial situation or needs of any viewer that may receive it. Kindly also note that past performance is not a reliable indicator of future results. Actual results may differ materially from those anticipated in forward-looking or past performance statements. We assume no liability as to the accuracy or completeness of any of the information and/or content provided herein and the Company cannot be held responsible for any omission, mistake nor for any loss or damage including without limitation to any loss of profit which may arise from reliance on any information supplied by TFA Global Pte Ltd.
The speaker(s) is neither an employee, agent nor representative of Tradu and is therefore acting independently. The opinions given are their own, constitute general market commentary, and do not constitute the opinion or advice of Tradu or any form of personal or investment advice. Tradu neither endorses nor guarantees offerings of third-party speakers, nor is Tradu responsible for the content, veracity or opinions of third-party speakers, presenters or participants.

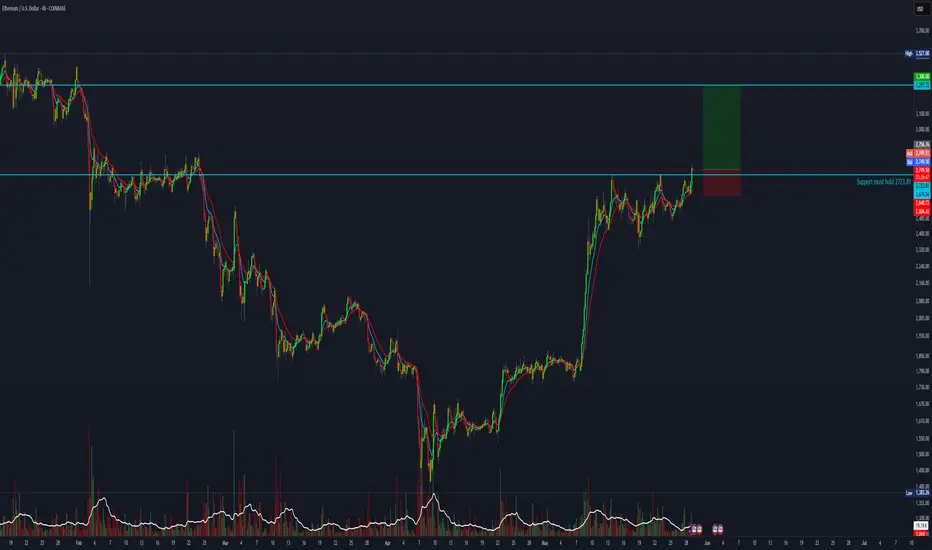
ETHEREUM is repeating BITCOIN's 2018-2021 Cycle!Ethereum (ETHUSD) has found itself on a very strong rally since the April 07 bottom, which resembles the V-shaped recovery of Bitcoin on the March 09 2020 bottom. In fact BTC's whole 2018 - 2021 Bull Cycle resembles ETH's 2022 - 2025 Cycle so far.
So far ETH is struggling to break above its 1W MA50 (blue trend-line) but the most important Resistance of the Cycle is the ATH Lower Highs trend-line. When that broke for Bitcoin, a parabolic rally started. Do you think we will see such a break-out on ETH too by the end of the year?
-------------------------------------------------------------------------------
** Please LIKE 👍, FOLLOW ✅, SHARE 🙌 and COMMENT ✍ if you enjoy this idea! Also share your ideas and charts in the comments section below! This is best way to keep it relevant, support us, keep the content here free and allow the idea to reach as many people as possible. **
-------------------------------------------------------------------------------
💸💸💸💸💸💸
👇 👇 👇 👇 👇 👇

Liquidity BandsI start using the stablecoins mcap as channels, that way you see when the market is overpriced compared to the actual volume of inflows.
It basically envelopes the coin's pricing relative to the actually available liquidity.
"Liquidity Bands", if you will

SHORT ON ETHEREUM ETH/USDEthereum has created a lower high after a triple top and is currently looking very bearish.
Huge imbalance to the downside to be filled.
I will be selling eth to the next demand level looking to catch over 500-600 points.


#ETH/USDT#ETH
The price is moving within a descending channel on the 1-hour frame and is expected to break and continue upward.
We have a trend to stabilize above the 100 moving average once again.
We have a downtrend on the RSI indicator that supports the upward move with a breakout.
We have a support area at the lower limit of the channel at 2429, acting as strong support from which the price can rebound.
Entry price: 2535
First target: 2564
Second target: 2598
Third target: 2647

#ETH/USDT#ETH
The price is moving within a descending channel on the 1-hour frame, adhering well to it, and is heading for a strong breakout and retest.
We are seeing a rebound from the lower boundary of the descending channel, which is support at 2460.
We have a downtrend on the RSI indicator that is about to be broken and retested, supporting the upward trend.
We are looking for stability above the 100 moving average.
Entry price: 2506
First target: 2550
Second target: 2600
Third target: 2656

Once It Starts, It Might Be Too Late to Jump InHey guys, vacation’s over — time to get back behind the screen and into the reports. Naturally, I kicked things off with a deep dive into ETH options activity , because that’s where the real market whispers come from.
Here’s what stood out:
Over the past week, the biggest trading volume and open interest inflow came at strikes $3000–$3200–$3400 (see screenshot). Most of the action was in standalone calls , though a portion showed up as call spreads — meaning some players are betting on a controlled rally, not just blind bullishness.
The June 27, 2025 expiry remains the clear leader in open interest — still the date everyone’s watching.
With implied volatility at 67.9% , ETH has about a 68% probability (1σ) of reaching $2,950 by expiry — just 18 days away .
Key Takeaways:
$3000–$3200 looks totally within reach.
$3400 , though? Less than 15% chance based on current levels.
The sentiment among options traders is clearly bullish — they’re positioning for a breakout up from the sideways range, roughly by the full width of the pattern.

ETHUSD ETHUSD DTF analysis
cup/handle pattern formed
Bearish divergence formed also price moving in a consolidation box
wait for the breakout of neckline if breaks price will go up otherwise will come for retracement
then can take entry
wait and watch condition for new buying

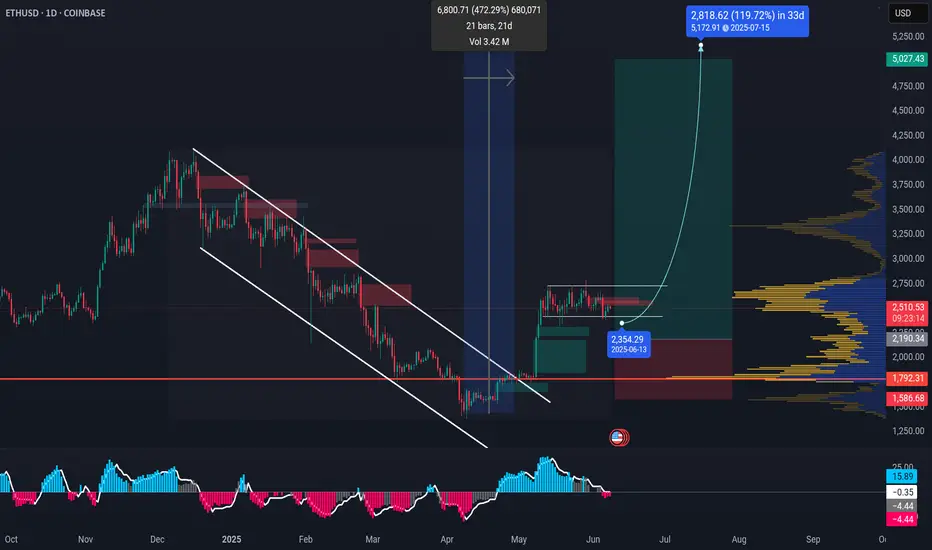
ETHEREUM is stacking up to fly! BINANCE:ETHUSDT ETHEREUM got a lot going for it right now. It's the backbone of a huge chunk of the crypto world, especially with all the DeFi and NFT stuff happening. Plus, there's always talk about big upgrades that could make it even better.
Right now, Ethereum's trading around $2,500, but some experts expect that it could climb way higher, maybe even past $8,000, if everything goes right.
That aside, I personally think $5,000 is achievable and to happen soon. It clearly broke out of the months long downtrend channel and with momentum. There's a lot of hate for ETH just for being expensive. But, let's be real, is not the 2nd biggest player in the market for nothing.
Let me know what you think? Open to counter ideas!
BINANCE:ETHUSDT
ETHUSD: The Market Is Looking Down! Short!
My dear friends,
Today we will analyse ETHUSD together☺️
The price is near a wide key level
and the pair is approaching a significant decision level of 2,512.0 Therefore, a strong bearish reaction here could determine the next move down.We will watch for a confirmation candle, and then target the next key level of 2,501.7..Recommend Stop-loss is beyond the current level.
❤️Sending you lots of Love and Hugs❤️
