ETH - 2 Hours Chart - IF Break below $2,600 may test $2,550Short-Term Outlook (Next 6–12 hours):
Slight pullback likely from current resistance zone ($2,650–$2,675)
If price holds above $2,600 and stochastic resets, continuation to $2,700+ possible.
Break below $2,600 may test support around $2,550–$2,500
Not financial advise
Not recommendations to BUY SELl any stocks, cryptos, fx etc...
DYOR
ETHUSD trade ideas

ETHUSDETHUSD 4hr analysis
bearish rising wedge pattern-level
SL 2,693.51
Entry 2,451.11 (Entry for a short trade after break)
TP 2,212.94

ETHUSD Break- Test- GO!!!This is a classic break-test go setup. What you want to see is a hook-down. What you don't want to see is push-back into the structure.
It's that simple.
Boost, like, follow, subscribe!

High R:R Ethereum Trade Setup – 7:1 Long Swing OpportunityIf you missed my previous 50:1 R:R setup on Ethereum, here's your second chance before it leaves the station.
This new setup offers a 7:1 risk-to-reward ratio with a lower risk profile, as long as Bitcoin stays above $105,000.
Entry: $2,657
Stop Loss: $1,668
Target (Hopium): $10,000
This is for educational purposes only. Risk no more than 1% of your portfolio.

Ethereum will beat Gold.
Gold has been adored by humans since ancient times. Countless lives have been lost fighting over such treasure. Empires, governments and banks love the precious metal and keep thousands of tons of them with utmost security.
Ethereum, on the other hand, was created by a person just 12 years ago. You can't actually feel or touch it because it's purely virtual. But its potential is far greater than gold itself. Because of supply and demand, as well as certainty.
There's still plenty of undiscovered deposits of gold worth millions. When they are discovered and mined, there's more gold to go around for everyone, although we don't know how much gold there's left. But for Ethereum, we know its supply will shrink over time and the amount is completely certain. We know exactly how much there is and how much there will be.
It's also a lot easier to own Ethereum than to own actual gold. There's so many transactional costs involved. That's why even though gold is physical and has been gaining pretty well throughout the years, it just can't beat something better.

ETHOnce we exit this zone and bounce (if we bounce) I expect to hit 4K ++ ETH looks better then ever for the last times.

ETHUSD INTRADAY Bullish consolidation The ETH/USD pair maintains a bullish overall sentiment, underpinned by a sustained upward trend.
Key Levels:
Support: 2,190 (primary), followed by 2,123 and 2,046
Resistance: 2,625, with extended targets at 2,725 and 2,850
A corrective dip toward the key support zone at 2,190 could offer a bullish rebound opportunity. A successful bounce from this level would reinforce the uptrend and pave the way for a test of the 2,625 resistance. A breakout above this level may open the door to further gains toward 2,725 and 2,850 over the longer term.
Conversely, a decisive break and daily close below 2,190 would invalidate the bullish setup, potentially triggering a deeper pullback toward the 2,123 and 2,046 support levels.
Conclusion:
While the broader trend remains bullish, ETH/USD is currently consolidating. Traders should watch the 2,190 support closely—its defence may confirm trend continuation, while a breakdown could signal a short-term bearish reversal.
This communication is for informational purposes only and should not be viewed as any form of recommendation as to a particular course of action or as investment advice. It is not intended as an offer or solicitation for the purchase or sale of any financial instrument or as an official confirmation of any transaction. Opinions, estimates and assumptions expressed herein are made as of the date of this communication and are subject to change without notice. This communication has been prepared based upon information, including market prices, data and other information, believed to be reliable; however, Trade Nation does not warrant its completeness or accuracy. All market prices and market data contained in or attached to this communication are indicative and subject to change without notice.

ETHUSD - Strong Move UpLooking at past price movement for ETH this area shows a strong upward movement which probably will repeat
Very bullish time for altcoins especially after BTCUSD finishes its run
Lets go

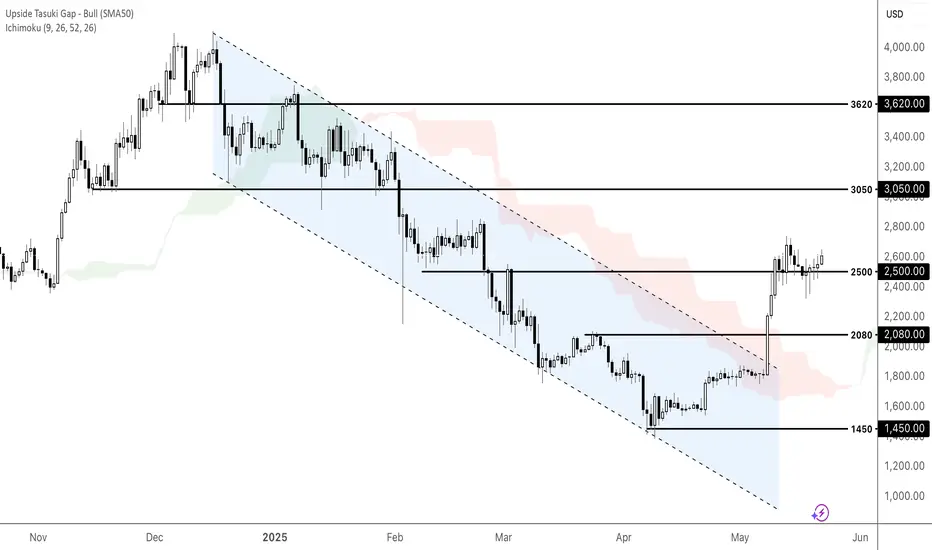
ETHUSD poised for further gains?Fundamental:
Rising US Treasury yields and weaker-than-expected US Treasury auction results have underscored declining demand for US assets. This trend has contributed to a softer US dollar, which in turn is providing supportive momentum for ETHUSD. Additionally, evolving regulatory frameworks that are becoming more supportive of cryptocurrency are further bolstering investor confidence. These factors suggest a constructive environment for ETHUSD, with potential for continued upside as demand shifts from conventional assets toward digital alternatives.
Technical:
ETHUSD broke out of the descending channel and closed above the Ichimoku Cloud, reinforcing its bullish momentum. If the price holds above the support at 2500 and sustains its rally, it could rise toward the resistance at 3050. Conversely, a retracement and a close below 2500 may prompt a deeper retracement toward the support at 2080.
By Li Xing Gan, Financial Markets Strategist Consultant to Exness
Caught the pivots up, now what?If you find this information inspiring/helpful, please consider a boost and follow! Any questions or comments, please leave a comment!
After catching the directional turn and key pivot level ahead of the recent move, Ethereum delivered the reaction we were anticipating. But what comes next?
The current W2 corrective structure isn’t textbook, so what do we do?
At this stage, we’re anchoring our analysis off the Wave 3 price action, which likely completed before the latest correction. That sets us up to track a potential Wave 4 development.
Here’s what’s still on the table:
We have a sideways style W2
For a wave 4, based off of alternation, we should be looking for a:
A sharp zigzag
Or a contracting triangle coiling up for the next breakout
Key Level to Watch:
👉 A clean break below 2159 would invalidate the more bullish interpretations and open the door to deeper corrective action. ⚠️
Until then, staying patient and letting the structure develop will be key.
Trade safe, trade smart, trade clarity.

Inverse H&S Pattern printed on 1HR looking for 2850.00 next!We have officially printed a nice inverse Head and shoulder pattern on the 30 minute timeframe looking to target 2850.00. My guess is that the 4hr VAH will become the next support Zone and we will bounce off 2700 after we break 2850. Then from there we will be targeting 3350-3500 as the next higher high. BTC has already broken new ATH, so ETH is next IMO.
Bullish Divergence already noted from the left shoulder to the head, confirms we will see more upside coming! Let's go!!!

Small Inverse H&S on ETH takes us to 2694.00??Eth Just broke out of the falling wedge pattern and is forming a reverse head and shoulders pattern, looking for the next level of 2694, which perfectly coincides with the 4hr Value area high, also would be sweeping most of the short liquidity from the fall down from 2747.00. We perfectly bounced off the low time frame Golden Pocket Fibonacci level .618-.66. I say we go up from here, while BTC will trade a little sideways, this is where the ETH and BTC price correlation decouples and ETH shoot up while bitcoin either trades sideways or has small gains since alot of money is shuffling into altcoins and ETH now that Alt season has begun.

ETHUSD (SHORT)
Fib level of 50% retracement reached
Head and shoulder (H1) on that level as reversal pattern

Ethereum Long: A study of 3 trendlinesOver in this non-Elliott Wave analysis, I drew 3 trendlines from longer term to shorter term: black, blue, and green respectively. As can be seen, currently price has breached the black trendline and is testing the blue. I expect price to push past both the blue and green to hit $2647 in the short term.

ETH is moving within the 2385.00 - 2,695.00 range👀 Possible scenario:
Ethereum is trading at $2,6K., up 3.06%, though analysts warn of a short-term pullback as resistance builds near $2.5K. A $262M transfer by co-founder Jeffrey Wilcke to Kraken on May 20 briefly sparked sell-off fears, but concerns were quickly dismissed.
Despite recent gains, ETH faced selling pressure and a potential death cross, prompting speculation. CryptoQuant notes rising volume at key levels suggests continued consolidation before any breakout. Long-term outlook stays bullish: ETH on exchanges fell to a 10-year low of 4.9%, whales added 450,000 ETH since late April, and institutional inflows hit $205M last week following the Pectra upgrade.
✅Support and Resistance Levels
Support level is now located at 2385.00.
Now, the resistance level is located at 2,695.00.

ETH(based on NEowave)now the E wave of that cycle triangle looks like also a triangle.(if you dont know what Im talking about check the last analysis of ETH)
if e wave of this triangle breaks the SL it turns to a diamond diametrical.

Market next move Disruptive (Contrarian/Bullish) View:
1. Higher Lows Formation:
The price is consistently forming higher lows, which could indicate building bullish momentum, not weakness.
This could suggest a breakout attempt through the resistance zone rather than a rejection.
2. Volume Analysis:
Volume seems to be stabilizing (and even increasing slightly) on green candles approaching resistance.
This might indicate accumulation rather than distribution — a possible prelude to a bullish breakout.
3. Short-term Bull Flag/Pennant:
The price pattern just before entering the red box may resemble a bull flag, a continuation pattern.
If it breaks the flag upwards, it could target levels around $2,600+.
4. Failed Bearish Setups:
The earlier sharp drop was quickly recovered, showing buyer interest below $2,500.
This invalidates the strength of previous selling pressure.
5. Psychological Level at $2,500 Holding:
ETH is hovering just above the key $2,500 psychological support.
Holding above this level increases the likelihood of testing and potentially flipping resistance to support.

ETHUSD: Consolidation before the Megaphone targets 4,100Ethereum is on a strong bullish 1D technical outlook (RSI = 63.675, MACD = 190.470, ADX = 31.885) despite the current technical pullback which is happening due to the rejection on the 1D MA200. Once crossed, we expect a test of the Megaphone's top (TP = 4,100).
## If you like our free content follow our profile to get more daily ideas. ##
## Comments and likes are greatly appreciated. ##

Weekly trading plan for EthereumIn this idea I marked the important levels for this week and considered a few scenarios of price performance
Write a comment with your coins & hit the like button and I will make an analysis for you
The author's opinion may differ from yours,
Consider your risks.
Wish you successful trades ! mura

Massive 50R Opportunity on Ethereum – High Risk-Reward PlayEthereum has pulled back to the 0.382 Fibonacci zone. If this setup plays out, there's potential for a 50:1 risk-to-reward trade, with a high-reward target at $10,000.
Entry: $2,545
Stop Loss: $2,400
Target: $10,000
For this scenario to gain momentum, BTC needs to break above $108K for a full bullish confirmation.
This is for educational purposes only. Never risk more than 1% of your portfolio on a single trade.

Triangle Reversal patternThe price broke out of a triangle pattern and made a pullback giving us a perfect entry to go short
WE ONLY TRADE PULLBACKS

$ETH – Breakout Rally Continues!
🔸 Key Support Zone at $1,900 - $2,200:
ETH has successfully broken through the key $2,200 resistance and flipped it into support. This confirms strength and continuation of the bullish structure. The price is now building momentum above this level.
🔸 Upside Target: $3,200 – $4,500
With strong follow-through above $2,500, ETH could be eyeing the $2,800 zone next. Holding this level opens room toward $3,200 and $4,500 in the coming months.
🔸 Risk Level at $1,900:
Losing $1,900 on a daily or weekly close would invalidate the bullish bias and expose price back toward $1,500 or lower.
🔸 Outlook:
Continue adding on dips near $2,400–$2,500 using DCA.
Watch for consolidation above $2,500 to confirm strength.
Raise stop loss to breakeven if in from sub-$2,200 entries.
Reassess if ETH falls below $2,200 with volume.

Ethereum Golden Cross: ETH Eyes $3,000 BreakoutEthereum Flashes Golden Cross: A Bullish Beacon or a Fleeting Glimmer for the $3,000 Target?
The cryptocurrency market is once again abuzz with technical signals, and this time, Ethereum (ETH), the second-largest cryptocurrency by market capitalization, is in the spotlight. Traders and analysts are keenly observing a "Golden Cross" that has recently manifested on Ethereum's price charts. This classic bullish indicator has historically been associated with potential upward momentum, igniting discussions and hopes among investors: could this be the catalyst that propels ETH bulls to conquer the coveted $3,000 price level?
Understanding the Golden Cross: A Primer
Before diving into Ethereum's specific prospects, it's crucial to understand what a Golden Cross signifies. In technical analysis, a Golden Cross occurs when a shorter-term moving average (MA) of an asset's price crosses above a longer-term moving average. Most commonly, this involves the 50-day moving average (50-MA) moving above the 200-day moving average (200-MA).
The rationale behind its bullish interpretation is straightforward: the 50-MA reflects the average price over the last 50 trading days, representing recent momentum. The 200-MA, on the other hand, represents the longer-term trend. When the shorter-term momentum (50-MA) surpasses the longer-term trend (200-MA) from below, it suggests that the recent buying pressure and positive price action are strong enough to potentially shift the overall market sentiment and initiate a more sustained uptrend.
However, it's vital to approach this signal with a degree of caution. The Golden Cross is a lagging indicator, meaning it confirms a trend that has already been underway for some time, rather than predicting a future one with certainty. By the time a Golden Cross appears, a significant portion of the initial upward move might have already occurred. Furthermore, like all technical indicators, it's not infallible. False signals can happen, where a Golden Cross appears but fails to lead to a sustained rally, sometimes even preceding a market downturn. Therefore, while a Golden Cross is a positive sign, it’s best used in conjunction with other indicators and a broader market analysis.
Ethereum's Current Landscape and the Significance of the Signal
For Ethereum, the appearance of a Golden Cross is a noteworthy development, especially considering its price action in recent months. After periods of consolidation and navigating broader market uncertainties, such a signal can inject a fresh wave of optimism. It often attracts trend-following traders and algorithms programmed to react to such patterns, potentially increasing buying pressure.
The journey towards $3,000 for Ethereum is not just a numerical target; it represents a significant psychological level. Reclaiming this mark would signify a strong recovery and could pave the way for further exploration of higher price territories. The Golden Cross, in this context, acts as a technical validation for bulls who believe in Ethereum's underlying fundamentals and its potential for growth.
Factors Fueling the Bullish Case for ETH to $3,000
Several factors, beyond the Golden Cross itself, could support a bullish push for Ethereum towards the $3,000 milestone:
1. Strong Network Fundamentals: Ethereum continues to be the dominant smart contract platform, hosting the vast majority of decentralized finance (DeFi) applications, non-fungible tokens (NFTs), and a burgeoning ecosystem of Layer 2 scaling solutions. Ongoing development, such as progress on future upgrades aimed at enhancing scalability and efficiency (like proto-danksharding with EIP-4844), bolsters long-term confidence.
2. The Impact of "The Merge" and Staking: The transition to a Proof-of-Stake (PoS) consensus mechanism (The Merge) has fundamentally changed Ethereum's tokenomics. It significantly reduced new ETH issuance and, coupled with the EIP-1559 fee-burning mechanism, has often made ETH deflationary during periods of high network activity. The growth in staked ETH, which secures the network and earns rewards for stakers, also reduces the liquid supply available on exchanges, potentially creating upward price pressure.
3. Layer 2 Scaling Solutions Gaining Traction: Solutions like Arbitrum, Optimism, zkSync, and StarkNet are increasingly handling a significant portion of Ethereum's transaction load. This alleviates congestion on the mainnet, reduces gas fees for users interacting with these Layer 2s, and improves the overall user experience, making the Ethereum ecosystem more attractive and scalable. As these solutions mature and gain wider adoption, they enhance Ethereum's value proposition.
4. Renewed Institutional Interest: While institutional adoption of crypto can be cyclical, a clear bullish signal like a Golden Cross, combined with improving macroeconomic conditions or regulatory clarity, could reignite interest from larger financial players looking for exposure to digital assets beyond Bitcoin. Ethereum's utility and its role as a platform for decentralized applications make it an attractive candidate for institutional portfolios.
5. Positive Market Sentiment: The cryptocurrency market is heavily influenced by sentiment. A Golden Cross can contribute to a positive feedback loop: the signal encourages buying, which pushes prices up, further reinforcing bullish sentiment and attracting more participants. If Bitcoin, the market leader, also shows strength, it often creates a favorable environment for altcoins like Ethereum to rally.
6. Growing NFT and DeFi Ecosystems: Despite market fluctuations, innovation within the NFT and DeFi sectors on Ethereum continues. New use cases, improved user interfaces, and greater mainstream adoption of these technologies can drive demand for ETH, which is used to pay for transactions and interact with these applications.
Potential Headwinds and Obstacles on the Path to $3,000
Despite the optimism generated by the Golden Cross, several challenges could hinder Ethereum's ascent to $3,000:
1. Macroeconomic Uncertainty: Broader economic factors, such as inflation rates, interest rate policies by central banks, and geopolitical events, can significantly impact risk assets, including cryptocurrencies. A deteriorating macroeconomic outlook could dampen investor appetite and stall any potential rally.
2. Regulatory Scrutiny: The regulatory landscape for cryptocurrencies remains a significant unknown in many jurisdictions. Unfavorable regulations or enforcement actions targeting Ethereum, DeFi, or staking could negatively impact its price.
3. Technical Resistance Levels: The path to $3,000 is likely to encounter several technical resistance levels where selling pressure might increase. Traders will be closely watching these zones, and failure to break through them decisively could lead to pullbacks.
4. Profit-Taking: As the price of ETH rises, especially after a significant signal like a Golden Cross, traders who bought at lower levels may decide to take profits, creating selling pressure that needs to be absorbed by new buyers for the uptrend to continue.
5. Competition: While Ethereum is the dominant player, it faces ongoing competition from other Layer 1 blockchains (e.g., Solana, Avalanche, BNB Chain) that also aim to offer scalable smart contract platforms. Significant advancements or adoption shifts towards competitors could impact Ethereum's market share and sentiment.
6. The "False Signal" Risk: As mentioned earlier, no technical indicator is perfect. The Golden Cross could prove to be a false signal if broader market conditions turn bearish or if unforeseen negative catalysts emerge.
Conclusion: A Promising Signal, But Prudence is Key
The appearance of a Golden Cross on Ethereum's charts is undeniably a positive development that warrants attention. It provides a technical basis for bullish optimism and could indeed be a contributing factor if ETH is to make a sustained push towards the $3,000 mark. The combination of this signal with Ethereum's strong network fundamentals, ongoing technological advancements, and the deflationary pressures from its tokenomics paints a compelling picture for potential price appreciation.
However, investors should approach this scenario with a balanced perspective. The Golden Cross is a piece of the puzzle, not the entire picture. Its predictive power is enhanced when considered alongside other market indicators, fundamental analysis, and the overall macroeconomic environment. While bulls may feel emboldened by this signal, the path to $3,000 will likely involve navigating volatility, overcoming resistance levels, and contending with potential external shocks.
Ultimately, whether Ethereum can leverage this Golden Cross to reach $3,000 will depend on a confluence of factors: sustained buying momentum, continued positive developments within the Ethereum ecosystem, a favorable broader market sentiment, and the absence of significant negative catalysts. For now, the Golden Cross serves as a beacon of hope for ETH holders, but diligent research, risk management, and an awareness of the inherent uncertainties in the crypto market remain paramount.
