Dollar softens, Yen soars on BOJ normalization bets | FX ResearcThe US dollar got off to a soft start to the week, though thinner summer trading conditions have restrained activity across G10 and emerging markets. The Japanese yen stole the spotlight in G10 after the Ishiba coalition lost its upper house majority, fueling speculation about potential Bank of Japan policy normalization and political instability, which likely drove yen demand.
Meanwhile, positive market sentiment tied to a possible Trump–Putin meeting was overshadowed by skepticism about the sustainability of equity and Bitcoin rallies, given the sharp rise in US equity futures and bond market trends.
Political pressure on the Federal Reserve is intensifying, with Treasury Secretary Bessant questioning the Fed's credibility while also advocating for US–China trade talks and hinting at tougher terms for Europe. Despite calls from the administration and GOP figures for lower interest rates, the Fed anticipates price increases in August data.
In Canada, the Bank of Canada survey pointed to trade uncertainties and weak demand curbing inflation, with tariffs impacting corporate margins rather than consumers. On the fiscal side, the CBO estimates Trump’s tax cuts will add $3.44 trillion to the US deficit over the next decade—a significant but slightly reduced figure compared to earlier projections.
Exclusive FX research from LMAX Group Market Strategist, Joel Kruger
ETHUSD trade ideas
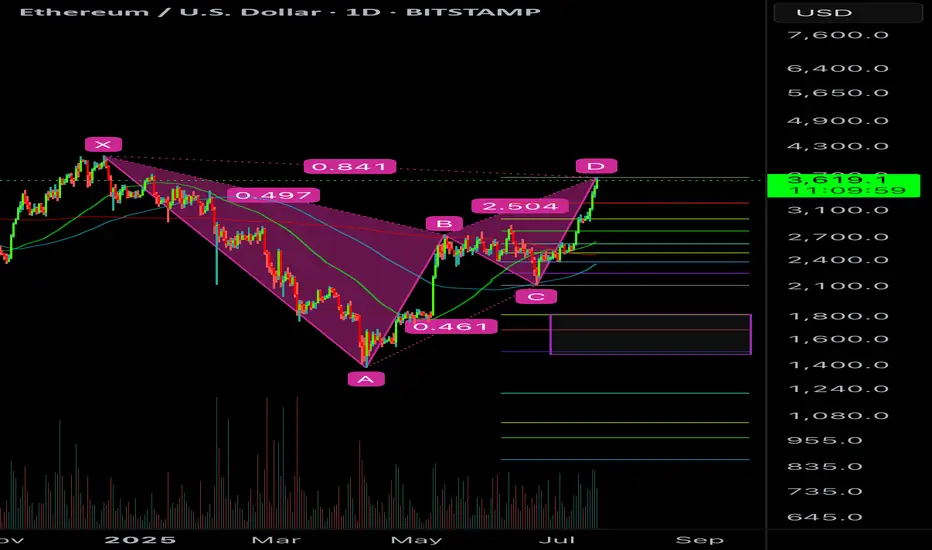
ETH BEARISH BAT POTENTIALETH can go slightly higher but it’s at/near the .886 retracement and meets a valid bearish bat pattern.
I would be targeting a full move if it is unable to break above the .886.
Too many euphoric here. The move has been really scammy off the hype news of Genius Act which everyone saw coming. Expect a sell the news event and BTC.D bounce would destroy alts for one last capitulation most alts may drop 40-50% from here. Then the real bull will start.
$ETH Ethereum Market Outlook – July 2025Ethereum Market Outlook – July 2025
Brought to you by ProfessorXtrader
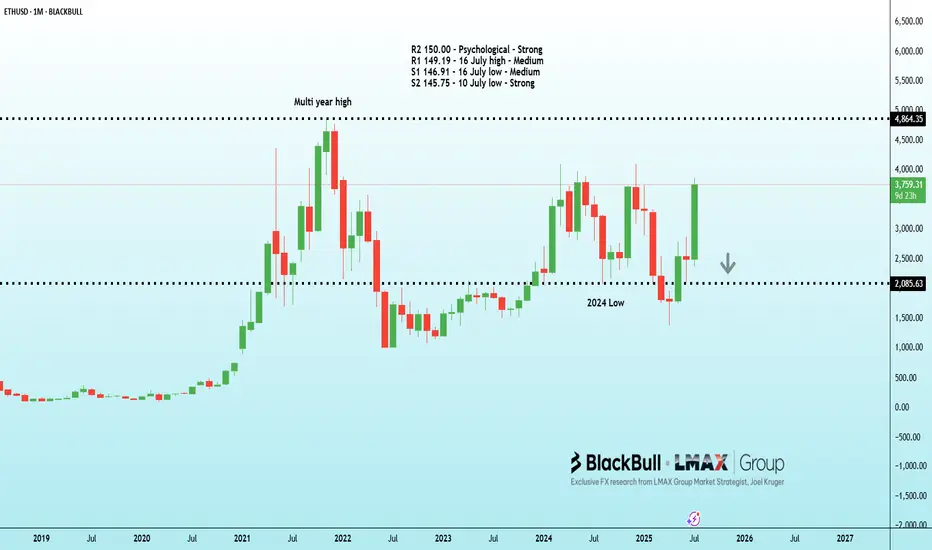
🚀 Ethereum Breakout Confirms Multi-Year Bullish Setup
Ethereum ( CRYPTOCAP:ETH ) has officially broken out of a multi-year consolidation range, signaling a strong bullish cycle ahead. With the current price sitting at $3,645.50, ETH has posted a remarkable 46.65% monthly gain as of July 18, 2025.
This move sets the stage for a multi-tiered upside potential — here’s what the chart is telling us.
📊 Key Levels & Targets
🔸 Previous Consolidation Range (2018–2021)
ETH spent over three years capped under the ~$4,884 level, forming a solid accumulation base.
🔸 Breakout Zone
Support: $1,150 – $1,250
Confirmation of Cycle Shift: Price now trading well above breakout zone.
🎯 Upside Targets (Ethereum)
1st Target:
📍 Price: $7,387.56
📈 Potential Gain: ~100%+ from breakout zone
2nd Target:
📍 Price: $11,394.14
📈 Potential Gain: ~180%
Final Exit (Major Reversal Zone):
📍 Price Range: $15,443.81 – $15,477.64
🚨 Total Gain Potential: ~280% from breakout
📌 The area between $15.4K to $18K is marked as the Major Reversal Zone, a region where profit-taking and trend exhaustion are highly likely.
📈 Market Interpretation
Bullish Breakout: Long-term resistance is now support.
Volume & Momentum: Strong monthly candle with expanding volatility confirms conviction.
Structure: Targets are based on clean technical projections, Fibonacci expansions, and market psychology.
🔔 What to Watch Next
📅 Monthly Close above current levels will confirm the breakout.
🔍 Monitor for rejection signals near the first target.
📉 Place trailing stops as we approach the major reversal zone.
💡 Pro Tip from ProfessorXtrader
"The biggest profits in crypto are made during clean breakouts from multi-year ranges. ETH is entering that phase now — plan your targets and protect your capital as you climb."

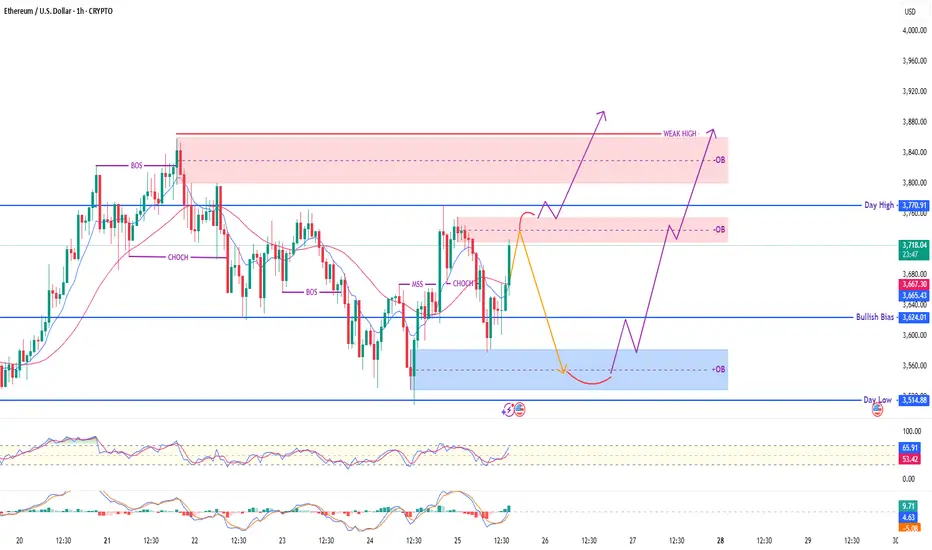
Ethereum / USD – 1H Smart Money Outlook🔹 Current Price: $3,718
🔹 Key Zones:
🔴 Supply Zone (OB): $3,770 – $3,850 (Weak High)
🔵 Demand Zone (OB): $3,540 – $3,600
⚠️ Bullish Bias Level: $3,624
🔹 Day High / Low: $3,770.91 / $3,514.88
🧠 Market Structure Overview:
✅ CHoCH → MSS confirmed bullish intent
✅ Price reclaimed structure above EMA
🔁 Price may react at supply zone, retrace to demand, then rally
📈 Scenario Outlook:
Bearish Rejection from OB Zone:
🔸 Price taps OB → drops to demand (blue zone)
🔸 Bullish reaction expected at deep discount zone
Direct Bullish Breakout:
🔸 Clean breakout above weak high → potential for trend continuation
🧠 Smart Money Notes:
BOS + CHoCH + MSS confirms internal liquidity shifts
OB zones respected repeatedly = high reaction probability
RSI overbought → short-term pullback likely
📊 Indicators:
RSI: 65.99 (Approaching overbought)
MACD: Bullish crossover
EMA Crossover: Bullish
✅ Bias: Bullish
🕰️ Timeframe: 1H
🔍 Strategy: Wait for discount entry or bullish breakout
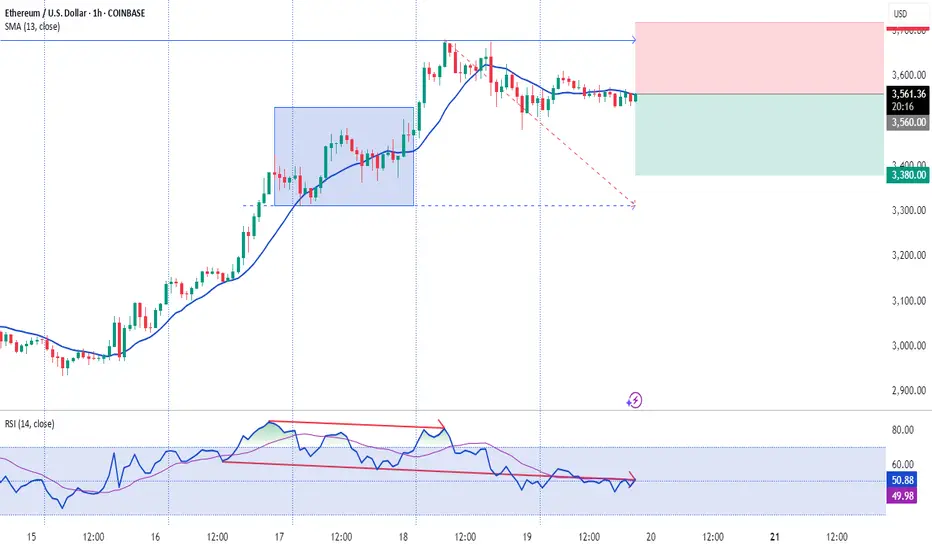
Short swing setup on ETH, targeting 1.5R.It's time for a healthy pullback on ETH. This short setup offers a 1.5:1 risk-to-reward ratio with a target of $3,500.
Entry at $3,725
Stop loss at $3,850
Target at $3,500.
Ethereum Long These zones are significant because they represent areas where large institutions and professional traders are likely to be active, potentially causing strong price movements when those orders are triggered. We want to enter trades that have minimal drawdown to maximize our buying power.
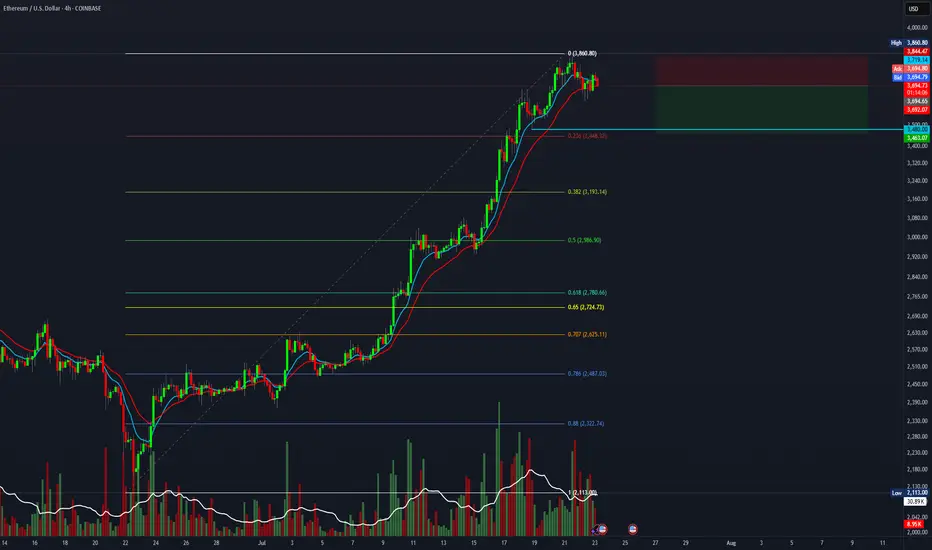
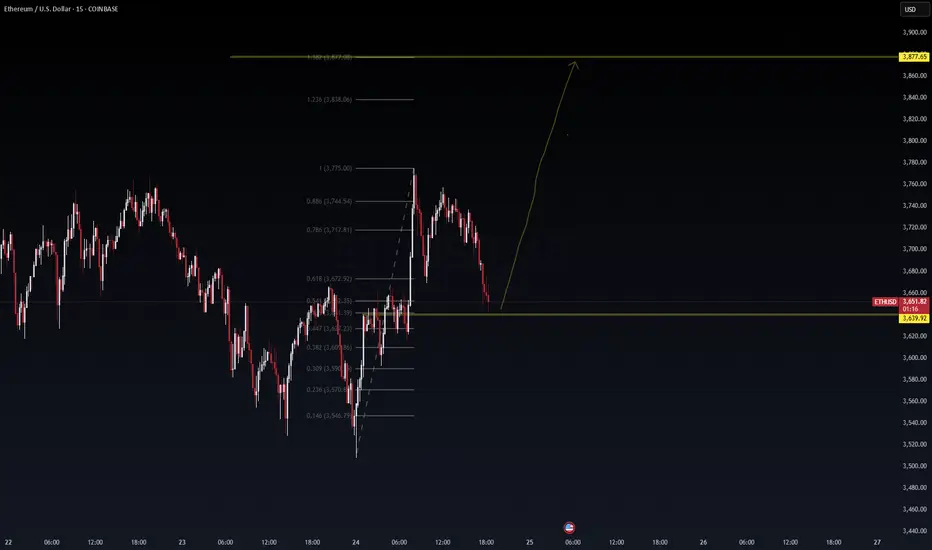
ETHUSD: Road to 4K today after a breakout. ETH/USD – 4H Outlook: Targeting $4,000+
Ethereum is coiling within a descending wedge, signaling potential breakout momentum. Volume compression indicates that once ETH breaks above the wedge resistance (~$3,750), it could accelerate toward the $4,000–$4,050 supply zone.
Key Levels:
Resistance: $3,750 → $4,000
Support: $3,650 → $3,550
Breakout Target: $4,007 (mid-term)
VolanX Protocol Insight:
Institutional liquidity clusters sit above $3,800. A clean breakout with strong volume could trigger stop runs and a swift rally to 4K.
Risk Management:
Entry after breakout retest above $3,750.
Stop-loss: Below $3,640.
Take-profit: $3,980–$4,050.

shortly bearish closed my trade at ~3750.
healthy retracement and 3 key levels for me to watch out. Next hours maybe a few days bearish, in my opinion a high chance to reach this targets.
Overall still bullish. Also watch out my post on ETH/BTC.

ETHEREUM: The $4,000 Triangle - Breakout or Breakdown?🎯 THE MEGA SETUP: Giant Symmetrical Triangle
🔍 What We're Looking At: 📐 Triangle Specifications:
🟢 $3,042.00 - Triangle Lower Trendline
🟢 $2,875.00 - 1W FVG (Fair Value Gap)
🔴 $4,087.00 - BSL (Buy Side Liquidity)
🔴 $4,200.00 - Psychological barrier
_______________________
🛡️ CONSERVATIVE LONG:
Entry: $2,800 - $2,850 (Triangle support bounce) 📊
Stop Loss: $2,740 (Below triangle) ❌
Targets: $3,500 → $3,800 → $4,200 🎯
! Smash that follow button for more killer setups! 🔥📊
____________ NOTE __________
⚠️ RISK MANAGEMENT
⚠️ DYOR
Remember: No setup is guaranteed. Always manage risk and never invest more than you can afford to lose.

ETHUSD: [VolanX ETHUSD SMC Outlook] — Compression → Expansion📈 — Compression → Expansion Setup Brewing
Chart Context (15m):
We're in a descending channel compression zone, rejecting from discount demand after BOS (Break of Structure) & CHoCH (Change of Character) confirmations. Volume spiked at the low, signaling potential accumulation. Current price is coiling just under the equilibrium zone.
🔍 Technical Setup:
🟢 Weak Low Sweep into high-volume demand zone
🔴 EQH (Equal Highs) + Liquidity resting near $3,754
🟣 Premium Supply Zones above $3,700 — final liquidity targets
🔻 Still under bearish internal structure (lower highs intact)
🟠 Equilibrium retest holding as micro support (watch for impulse)
🎯 VolanX Execution Path:
Break above $3,667 trendline = early long trigger 🚀
Target 1: $3,700 zone reclaim = confirmation of strength
Target 2: $3,754 liquidity hunt 🧲
Rejection from $3,754–$3,775 = potential short setup
🔻 Invalid Below:
Close below $3,600 with volume = bearish continuation
Retest of $3,523 “Discount” zone or liquidity void
📊 Volume Profile:
Highest reactive node: $3,623–$3,646
Spike near low = trap or base?
📡 VolanX Signal Protocol:
Accumulation + Compression = Expect Expansion.
ETHUSD may be rotating toward premium liquidity unless invalidated. Watch for breakout confirmation above descending trendline + EQH run.
🧠 Narrative Bias:
Markets are pricing in ETH's role in upcoming ETF decisions & regulatory clarity. VolanX AI aligns this structure as "coiling before institutional deployment."
#ETH #VolanX #SmartMoney #LiquiditySweep #CryptoTrading #OrderFlow #VolumeProfile #ETHUSD #TradingView #AlphaSignals #VolanXProtocol #SMC #PriceAction

Bullish continuation?The Ethereum (ETH/USD) is falling towards the pivot and could bounce to the 1st resistance.
Pivot: 3,471.00
1st Support: 3,039.91
1st Resistance: 4,094.93
Risk Warning:
Trading Forex and CFDs carries a high level of risk to your capital and you should only trade with money you can afford to lose. Trading Forex and CFDs may not be suitable for all investors, so please ensure that you fully understand the risks involved and seek independent advice if necessary.
Disclaimer:
The above opinions given constitute general market commentary, and do not constitute the opinion or advice of IC Markets or any form of personal or investment advice.
Any opinions, news, research, analyses, prices, other information, or links to third-party sites contained on this website are provided on an "as-is" basis, are intended only to be informative, is not an advice nor a recommendation, nor research, or a record of our trading prices, or an offer of, or solicitation for a transaction in any financial instrument and thus should not be treated as such. The information provided does not involve any specific investment objectives, financial situation and needs of any specific person who may receive it. Please be aware, that past performance is not a reliable indicator of future performance and/or results. Past Performance or Forward-looking scenarios based upon the reasonable beliefs of the third-party provider are not a guarantee of future performance. Actual results may differ materially from those anticipated in forward-looking or past performance statements. IC Markets makes no representation or warranty and assumes no liability as to the accuracy or completeness of the information provided, nor any loss arising from any investment based on a recommendation, forecast or any information supplied by any third-party.

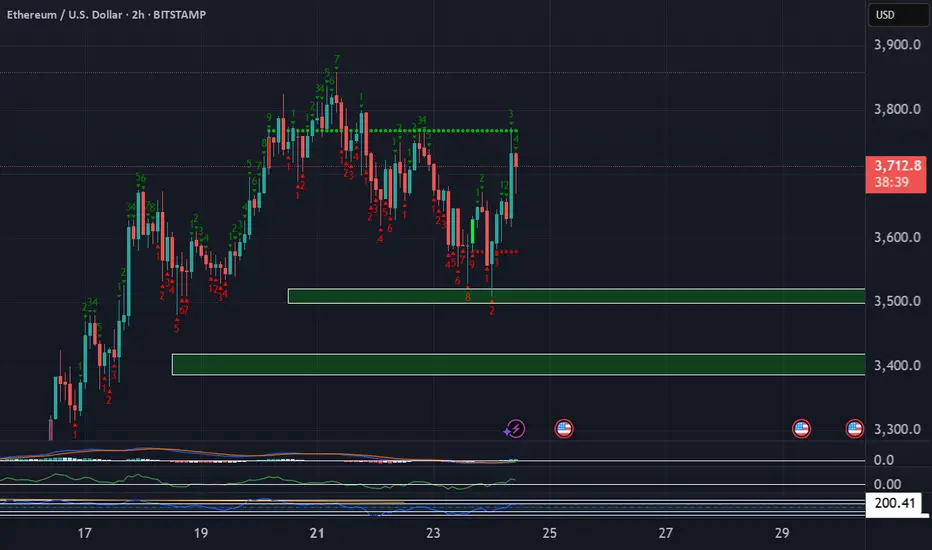
ETHUSD – Long Setup Activated | VolanX Protocol AlertEthereum (ETHUSD) is displaying strong bullish intent after reclaiming the VolanX Alert Line (~$3,659). Price action is forming higher lows with BOS (Break of Structure) signals, indicating that smart money is accumulating before a potential continuation rally toward the premium zones.
Key Levels & Zones:
Entry Zone: $3,660 – $3,680 (retest of equilibrium/alert line)
Target 1: $3,767 (weak high zone)
Target 2: $3,875 (premium zone)
Target 3: $4,000+ (extended bullish target)
Invalidation: Close below $3,620 (discount zone breach)
Rationale:
CHoCH → BOS → Retest Pattern: Multiple change-of-character moves followed by a BOS above $3,705 signal bullish market structure.
Liquidity Hunt Completed: Price swept the $3,540 discount zone and rebounded sharply, confirming smart money entry.
OPEX Volatility Catalyst: With options expiration tomorrow, volatility could drive ETH toward key liquidity zones. Favoring long bias as buy-side liquidity builds above $3,750.
Volume Surge: Breakout volume on 15m and 1H charts suggests institutional participation.
Trade Plan:
Long Entry: On a successful retest of $3,660–$3,680 zone with strong bullish candle confirmation.
Stop-Loss: Below $3,620 (structure invalidation).
Targets: Scale out at 3,767 → 3,875 → trail above $3,900.
Risk-Reward: ~1:3 or better, depending on execution and trailing strategy.
Disclaimer:
This analysis is for educational purposes only and not financial advice. Trade responsibly and use proper risk management.
ETH: Eyes Resistance, But Correction Still LoomsEthereum has also seen a modest pullback since yesterday morning, but here too, it’s too soon to confirm a high for turquoise wave B. Accordingly, we anticipate further gains in this corrective rally—potentially up to resistance at $4,107—before the subsequent turquoise wave C takes over and drives the price down into the green long Target Zone ($935.82–$494.15). Within this range, we primarily expect the low of the wave- correction, which has now lasted more than four years, setting the stage for a long-term trend reversal to the upside. According to to our alternative scneario, magenta wave alt.(1) would complete with the next high. The following pullback, attributed to wave alt.(2), would then only extend into the slightly adjusted magenta Target Zone ($2,622–$1,914) before a move to new all-time highs (probability: 35%).
📈 Over 190 precise analyses, clear entry points, and defined Target Zones - that's what we do (for more: look to the right).

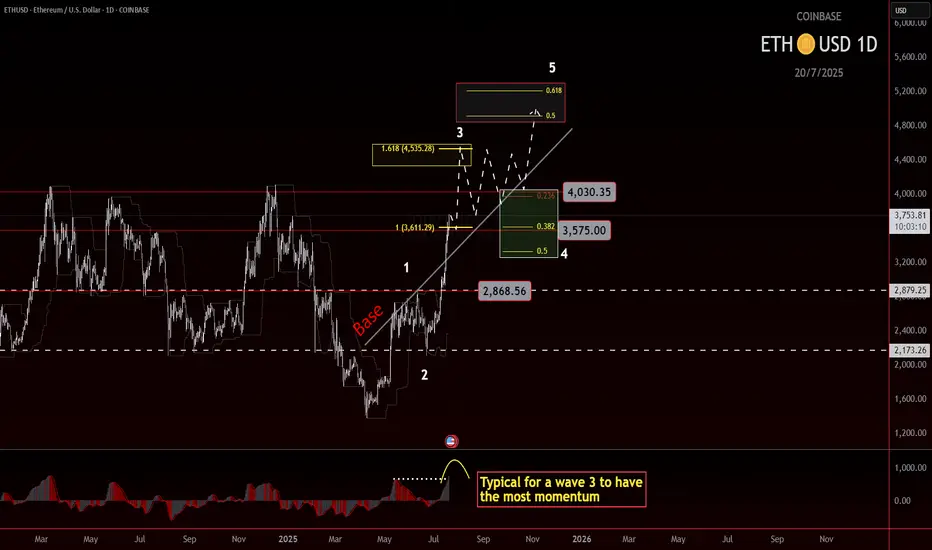
ETH roadmap to 5000!Ethereum Wave 3 in Play? Eyes on the $4500 Target
Ethereum may currently be progressing through a wave 3, which is often the strongest leg of an impulse. The structure so far supports that idea, and based on standard projections, the most likely target sits near $4500.
If price can break and hold above the 4k level, we could see a consolidation forming above the previous high. That would be a constructive sign and might set up the next leg higher.
But there’s still a chance ETH struggles to clear that level. If that happens, consolidation could form just underneath, which would still be acceptable within a wave 3 framework. What matters next is the shape and depth of the pullback.
Wave 4 will be the key. A shallow or sideways correction would keep bullish momentum intact. A deeper pullback doesn't ruin the structure, but it does mean we’ll need to watch support zones more closely.
If wave 4 behaves well and broader market conditions stay supportive, then a final wave 5 could bring ETH into the $5000 region. That’s the upper edge of this current roadmap, based on conservative assumptions.
Stay flexible. Let the structure guide the bias.
Ethereum is going to 2000 then new ATH
Alright, let's talk about what I see coming for Ethereum. I’ve been deep-diving into these charts, especially that weekly one where I’ve highlighted the past moves and percentages. I'm using these patterns as a guide to try and anticipate where Ethereum is heading next. I'm going to set aside any kind of trading advice, and focus on what I see the market doing next.
Key Observations From Past Cycles
Looking at Ethereum's history, I’m seeing a pretty clear cycle of large price swings:
Massive Rallies: Ethereum has a history of powerful bull runs, where the price can surge by hundreds, or even thousands of percent. I need to be aware of these to understand the potential of the coin.
Substantial Corrections: These rallies are always followed by substantial corrections, which range from about 30%, to upwards of 80%. This is important to see as any retracement can be devastating to a trader.
My Prediction For The Next Move:
Based on those historical patterns, here’s what I see as the most probable outcome for Ethereum's next move:
Anticipated Retracement: I’m expecting a retracement, or a pullback following the recent gains. Ethereum tends to make large retracements after a period of growth, and I am anticipating this will happen again soon. I want to see the price find a solid level of support, as this will be important to the next move up. Based on historical price action, I expect the next support levels to be somewhere around $2000 to $2500.
The Next Upside Move: After that pullback, I anticipate a strong upside move.
The magnitude of this move is unclear, but the data on the chart shows we could be looking at a move upwards of 100%, and maybe even more. I want to be watching that very carefully when it happens.

Inverse head & shoulderPossibility by today or early hours GMT, this inverse head & shoulder can play play out, hitting the $4k mark.
Also a possibility is a correction after hitting potentially what is ATH, at which point a correction will come before ETH moves above the ATH towards the end of year bull run, 25/26.

ETHUSD has formed a bearish bat patternOn the daily chart, ETHUSD formed a bearish bat pattern. The first downside target is around 3193, and the second downside target is around 2782.

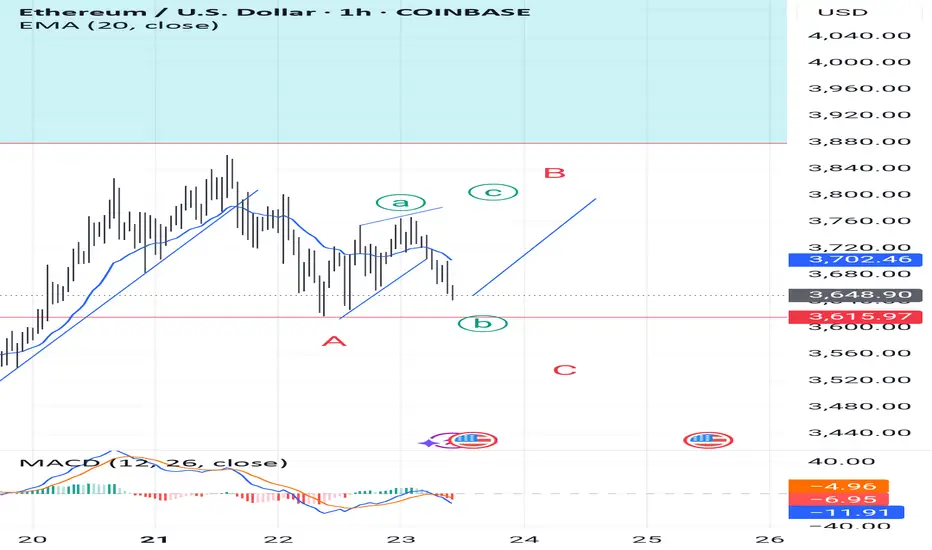
EthusdLeading diagonal has formed a wave and now we see b as a flat.
If the price doesn't go below (a)3615, I think we may see c wave of (B).
It may come strong and quick
Strategic Long Position on Ethereum (ETH)
Ethereum's funding rates have spiked, reflecting an overcrowded long side. Such conditions often precede a long squeeze, as the market seeks to shake out overleveraged traders.
Despite this risk, the current bullish momentum justifies a tiered entry approach:
First Entry (Market Order): 3,790
Second Entry (Limit Order): 3,550
🛑 Stop Loss (for both entries): 3,400
🎯 Take Profit Target: 4,200
This setup allows participation in the upward trend while leaving room

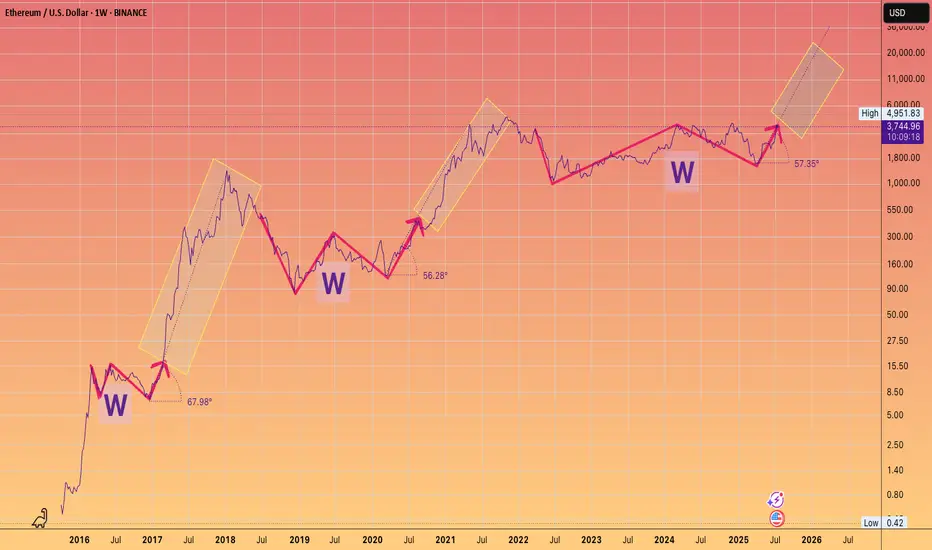
3 Wins to Glory.You guys know my long term Targets for ETH.
What I wanted to highlight is the angle of the Banana zone has been remarkably consistent on the Log chart.
Granted we only have 2 - 2.5 data points
But note how even in 2025 the run is adhering to the approx 60 degree angle of attack, after breaking out of their respective W's.
something to monitor.
ETHUSD News Over / 30 minutes time frame Bullish Trade
Mange risk Always chart explains trade plan well

ETH my notes for short termwaiting for a short time correction time. supports: 3500 - 3300 - 3050. then new ath process till october
not financial advices, notes for myself
