ETHUSD FORMED A BEARISH WEDGE. READY TO REVERSE?ETHUSD FORMED A BEARISH WEDGE. READY TO REVERSE?📉
ETHUSD has been moving bullish since July 9, forming the bearish wedge, supported by the bearish divergence. Today the price started to breakdown this pattern.
A bearish wedge is a bearish reversal pattern in an uptrend, where the price forms higher highs and higher lows within converging upward trendlines, signaling weakening bullish momentum and a potential downward reversal. To trade, identify the wedge with declining volume and confirm with RSI or divergence. Sell or short on a breakdown below the lower trendline with a volume spike. Set a stop-loss above the recent high or upper trendline. Target the wedge’s height projected downward from the breakdown or the next support level with a 1:2 risk-reward ratio.
The decline towards local support of 3,500.00 is highly expected. If the bearish impulse gets strong enough, we may see the decline towards 3,000.00 support level.
ETHUSD trade ideas

ETHETH has poised for more bullish movement to the upside we are currently at a demand zone in confluence with a fibonnaci and also sma in line with the level if it should hold we might see eth rally into 3800 per coin and 4600 per coin


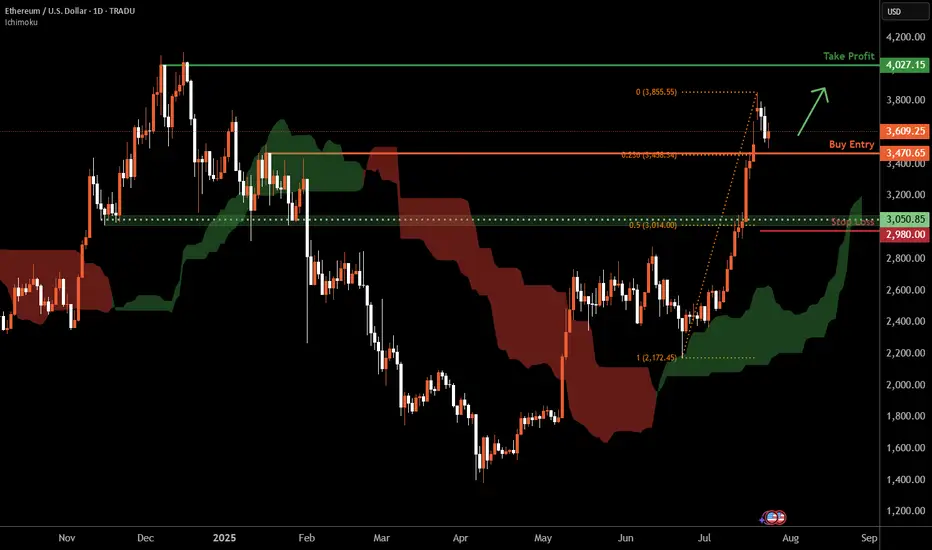
Ethereum D1 | Bullish uptrend to extend higher?Ethereum (ETH/USD) is falling towards a pullback support and could potentially bounce off this level to climb higher.
Buy entry is at 3,470.65 which is a pullback support that aligns with the 23.6% Fibonacci retracement.
Stop loss is at 2,980.00 which is a level that lies underneath a pullback support and the 50% Fibonacci retracement.
Take profit is at 4,027.15 which is a multi-swing-high resistance.
High Risk Investment Warning
Trading Forex/CFDs on margin carries a high level of risk and may not be suitable for all investors. Leverage can work against you.
Stratos Markets Limited (tradu.com ):
CFDs are complex instruments and come with a high risk of losing money rapidly due to leverage. 66% of retail investor accounts lose money when trading CFDs with this provider. You should consider whether you understand how CFDs work and whether you can afford to take the high risk of losing your money.
Stratos Europe Ltd (tradu.com ):
CFDs are complex instruments and come with a high risk of losing money rapidly due to leverage. 66% of retail investor accounts lose money when trading CFDs with this provider. You should consider whether you understand how CFDs work and whether you can afford to take the high risk of losing your money.
Stratos Global LLC (tradu.com ):
Losses can exceed deposits.
Please be advised that the information presented on TradingView is provided to Tradu (‘Company’, ‘we’) by a third-party provider (‘TFA Global Pte Ltd’). Please be reminded that you are solely responsible for the trading decisions on your account. There is a very high degree of risk involved in trading. Any information and/or content is intended entirely for research, educational and informational purposes only and does not constitute investment or consultation advice or investment strategy. The information is not tailored to the investment needs of any specific person and therefore does not involve a consideration of any of the investment objectives, financial situation or needs of any viewer that may receive it. Kindly also note that past performance is not a reliable indicator of future results. Actual results may differ materially from those anticipated in forward-looking or past performance statements. We assume no liability as to the accuracy or completeness of any of the information and/or content provided herein and the Company cannot be held responsible for any omission, mistake nor for any loss or damage including without limitation to any loss of profit which may arise from reliance on any information supplied by TFA Global Pte Ltd.
The speaker(s) is neither an employee, agent nor representative of Tradu and is therefore acting independently. The opinions given are their own, constitute general market commentary, and do not constitute the opinion or advice of Tradu or any form of personal or investment advice. Tradu neither endorses nor guarantees offerings of third-party speakers, nor is Tradu responsible for the content, veracity or opinions of third-party speakers, presenters or participants.
ETHUSD Smart Money Breakdown – Price Rejection from Premium ZoneEthereum has shown a strong impulsive rally after multiple Breaks of Structure (BOS) from early June, signaling a clear shift in market sentiment from bearish to bullish. Each BOS indicates that demand zones have been respected and liquidity has been efficiently used to fuel higher prices — a classic signature of institutional involvement.
🧠 Smart Money Insight
As price aggressively rallied into the resistance zone ($3,600–$3,800), the market entered a premium pricing area, where smart money typically offloads positions and hunts liquidity from late buyers. This area has historically been a high reaction zone — and as seen on the chart, ETH shows signs of buyer exhaustion, suggesting a possible short-term reversal.
🔁 Anticipated Market Behavior
A corrective move is likely from this resistance, and the first target for retracement lies in the support zone around $3,000–$3,200. This level aligns with:
Previous BOS retest area
Fair value imbalance fill
Mid-range equilibrium
If momentum continues downward, the next zone of interest will be the strong support region at $2,200–$2,400, which served as a major accumulation zone. That’s where large orders previously entered the market — and a strong reaction is expected again.
📊 Market Structure Summary:
BOS Confirmations: Validated bullish structure
Liquidity Grab: At resistance – potential sweep and reversal
Premium Zone Rejection: Smart money short opportunity
Discount Zone Targets: Support & strong support zones
✅ Conclusion
ETH is at a critical decision point. If price holds below resistance with continued bearish pressure, a retracement is not only healthy — it's expected. Traders should wait for confirmation of lower timeframe structure breaks before entering shorts, and target the $3,000 zone first, with eyes on $2,200 if momentum persists.

Ethereum/US Dollar 1D Chart - BINANCEdaily price movement of Ethereum (ETH) against the US Dollar (USD) on the Binance exchange. The current price is $2,992.08, reflecting a +1.39% increase (+$41.10) as of 09:54 AM CEST, July 11, 2025. Key levels include a resistance zone around $3,500-$4,000 and support near $2,736. The chart highlights recent buy and sell signals, with a notable upward trend approaching the resistance zone.

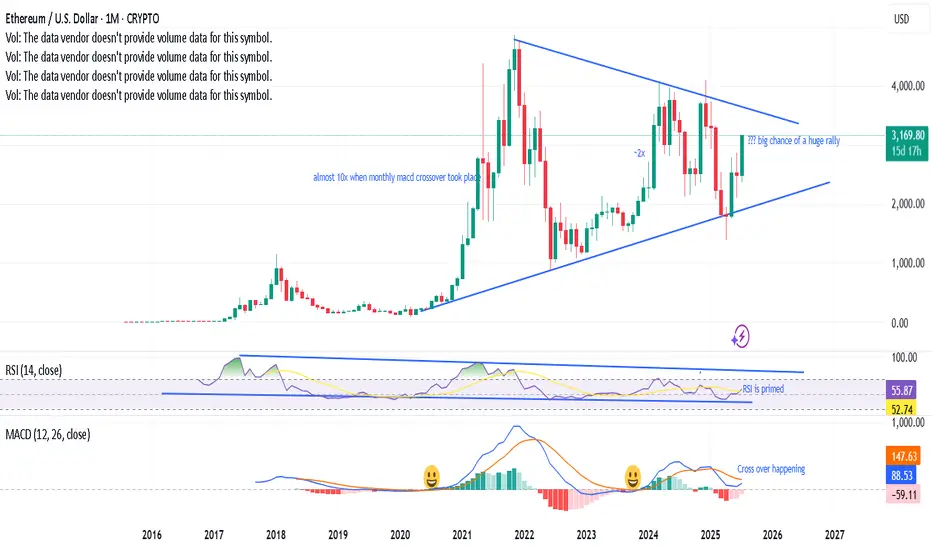
Monthly MACD crossover taking place, a prabolic rise?Last 2 times, when the monthly MACD cross over has happened, ETH has gone bonkers. A third one is on the verge of happening, RSI has enough room with a symmetrical triangle with bullish momentum - looks like a big rally is in the near horizon. Fingers cross.
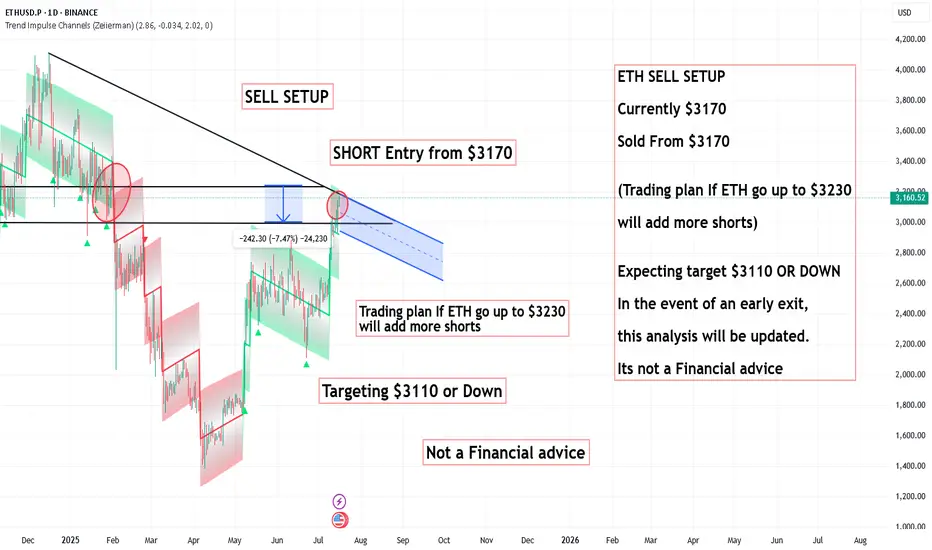
ETH SELL SETUP ,Sold From $3170ETH SELL SETUP
Currently $3170
Sold From $3170
(Trading plan If ETH go up to $3230
will add more shorts)
Expecting target $3110 OR DOWN
In the event of an early exit,
this analysis will be updated.
Its not a Financial advice
"Ethereum Is The New Bitcoin" - Tom Lee ETH / Stablecoins Are the ChatGPT of Crypto
Stablecoins are exploding in adoption — just like ChatGPT took over AI and Ethereum is the engine driving that revolution. In this post, we break down 10 reasons why Tom Lee is extremely bullish on Ethereum and why it could be the single most important digital asset in the future of finance . If you're sleeping on ETH, this might be your wake-up call.
Top 10 Bullish Points from Tom Lee on Ethereum:
• Ethereum is the backbone of stablecoins , which Tom Lee compares to the “ChatGPT of crypto” due to their viral adoption and massive utility.
• Over 51% of all stablecoins operate on Ethereum , contributing to around 30% of the network’s total fees.
• Ethereum network fees could 10x as stablecoin usage grows from $250 billion to $2 trillion.
• Ethereum is positioned to lead the tokenization of real-world assets , including stocks and real estate.
• ETH could reach $10,000 if asset tokenization becomes a mainstream financial practice.
• Ethereum has a regulatory edge in the U.S. , making it the preferred platform for compliant financial innovation.
• A $250 million ETH treasury strategy is underway , aiming to use Ethereum as a long-term reserve asset.
• Institutions will buy and stake ETH to secure stablecoin networks, making ETH the “next Bitcoin.”
• Ethereum dominates the crypto ecosystem , with nearly 60% of activity including DeFi, NFTs, and dApps built on its chain.
• HODL ETH for long-term growth , as its utility, demand, and institutional support continue to rise.
Conclusion:
Ethereum isn’t just a Layer 1 blockchain — it’s becoming the core financial infrastructure for the digital age . As stablecoins expand and institutions enter, ETH could be the most asymmetric opportunity in crypto right now.
📢 Drop a like, leave your thoughts in the comments, and don’t forget to follow for more powerful macro + crypto insights. 👍👍

ETHUSD M15 long strong bullish Support Zone: $3,000 – $3,020 (Active reaction zone)
• Strong Support (Last Defense): $2,940 – $2,970
⸻
🎯 Upside Targets:
1. First Target:
🔸 Level: $3,050
🔸 Type: Minor Resistance / First TP
2. Long Target:
🔸 Level: $3,125 – $3,150
🔸 Type: Major Resistance / Final TP

Bullish continuation-3400 ZONEAs ethusd is lingering around 3000 zone expect a minor retracememt in preparations for the engulfing, target 3400/5028 zone

Ethereum at the Crossroads: Can Bulls Maintain the WMA 50 Grip?- Technical Pulse:
- Current price flirting with the WMA 50 ($2,521.54), suggesting a possible make-or-break moment.
- Highlight convergence zones: WMA 21 ($2,296.75) and EMA 200 ($2,277.07) forming a soft cushion below.
- Volume Snapshot:
69.19K weekly—enough activity to suggest accumulation
- Sentiment Analysis:
Gauge prevailing investor sentiment amid consolidation and macro uncertainty.
- Scenario Forecasts:
- Bullish Path: Sustained hold above WMA 50 opens room toward $2,800+.
- Bearish Reversal: Rejection from current level could retest EMA 200 support zone.

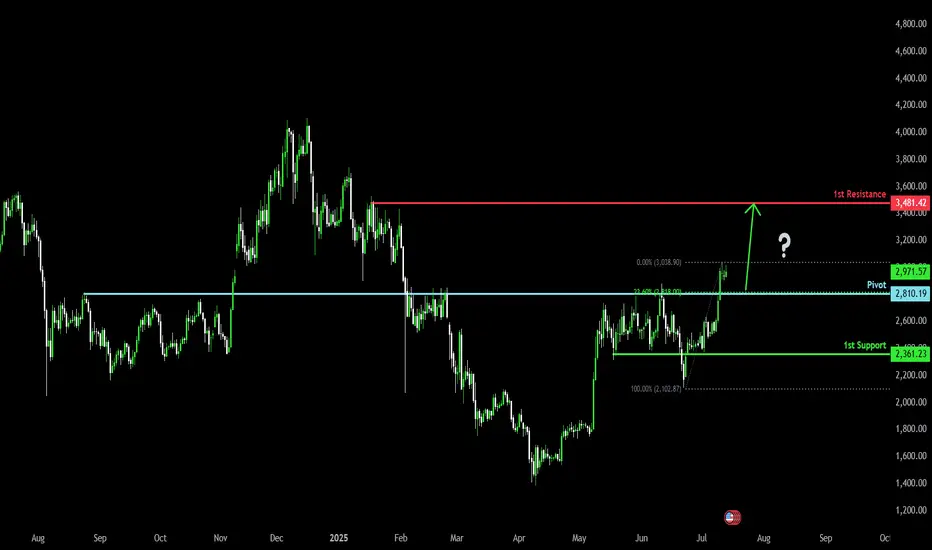
Bullish bounce?Ethereum (ETH/USD) is falling towards the pivot and could bounce to the 1st resistance.
Pivot: 2,810.19
1st Support: 2,361.23
1st Resistance: 3,481.42
Risk Warning:
Trading Forex and CFDs carries a high level of risk to your capital and you should only trade with money you can afford to lose. Trading Forex and CFDs may not be suitable for all investors, so please ensure that you fully understand the risks involved and seek independent advice if necessary.
Disclaimer:
The above opinions given constitute general market commentary, and do not constitute the opinion or advice of IC Markets or any form of personal or investment advice.
Any opinions, news, research, analyses, prices, other information, or links to third-party sites contained on this website are provided on an "as-is" basis, are intended only to be informative, is not an advice nor a recommendation, nor research, or a record of our trading prices, or an offer of, or solicitation for a transaction in any financial instrument and thus should not be treated as such. The information provided does not involve any specific investment objectives, financial situation and needs of any specific person who may receive it. Please be aware, that past performance is not a reliable indicator of future performance and/or results. Past Performance or Forward-looking scenarios based upon the reasonable beliefs of the third-party provider are not a guarantee of future performance. Actual results may differ materially from those anticipated in forward-looking or past performance statements. IC Markets makes no representation or warranty and assumes no liability as to the accuracy or completeness of the information provided, nor any loss arising from any investment based on a recommendation, forecast or any information supplied by any third-party.
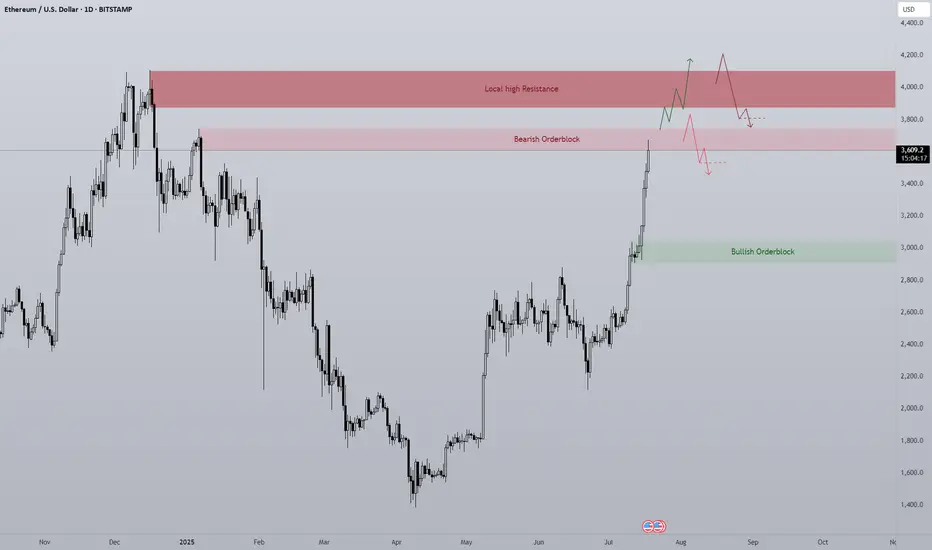
ETH 1D Overview Finally we are seeing altcoins regaining lost ground on Bitcoin and the second largest crypto by market cap is rallying strong.
Since ETH has such strength currently the opportunity to short is quite slim with high risk, however I think it's important to see where ETH may find some resistance or if a pullback was to happen, where would it come from?
The first level is the bearish orderblock level that has just been tapped as of writing. This area previously began the sell-off at the end of 2024 by confirming a new lower high. Naturally this area will present problems for the bulls and so a potential pullback could be initiated from this level. I would like to see a sweep of the stop loss positions just above the area and then a SFP to confirm the pullback is in motion.
Should the bearish orderblock fail the next clear level is the daily local top around $4000. A big even level and the area that started 5 months of downtrend. IMO the most likely level where longs will take profit. I do think if we see any form of consolidation between the bearish orderblock and the local high the bulls will look to carry the rally on, shallow pullbacks maintain momentum
Ten out of the last eleven days have been green candles with the only one day being red just above a key high, I expect if we are to get a pullback that bullish orderblock area ($2900-3000) to be retested as support. Therefor if any of the above areas initiate a pullback this area should provide support and therefor a long entry.
To clarify I am in no way bearish about Ethereum, this is just a plan for different eventualities.
Ethereum: Overbought Conditions Persist Near $3,746ETH is testing the volume point of interest at $3,417.0, while strong resistance and an order block reside at $3,746.0. Indicators remain in overbought territory, signaling short-term overpricing.
With little resistance shown in the volume profile, ETH is expected to fall back and retest the $3,404.0 support level. Traders and investors should monitor this zone closely for a potential bullish setup.

$ETH Bullish Set up Ethereum just started bull move .Five wave move could take it to all time high of 17k .....

ETH relative to AltcoinsI fee like at this current point as we see altcoin pairs bleed against ETH and BTC while putting in lower lows while Eth puts in higher highs we will not see the altseason we are hoping for until altcoin pairs hit here range lows which I can see happen end of Q3 into the start of Q4 but until then they can still rise as ETH.D continues its rally but I feel until altcoins reach its range lows being the .25 lvl on (TOTAL3-USDT)/BTC we will not see that face melting rally we are looking for.

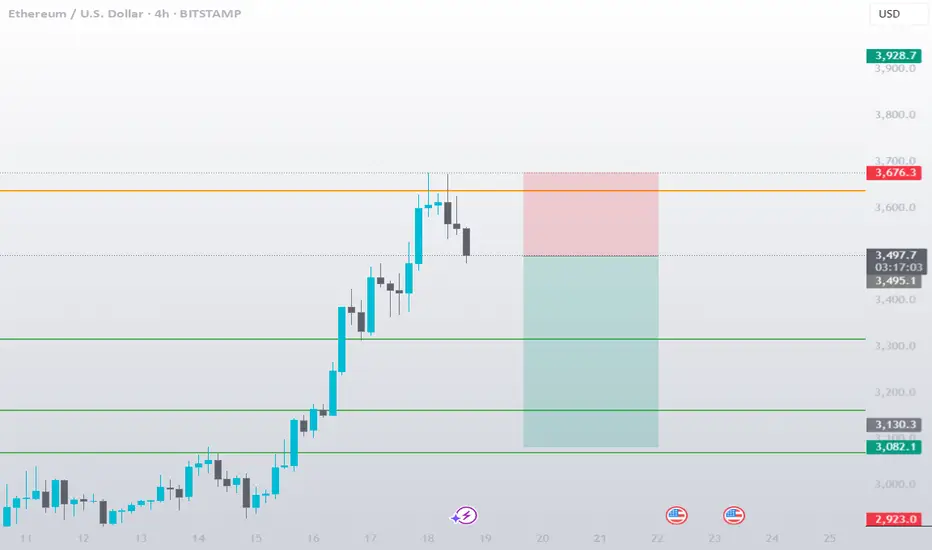
ETH SHORT || 4 HOUR CHARTEthereum just made a huge parabolic move and tapped into a key daily resistance zone around $3,676. Price is now reacting with a bearish candle on the 4H, suggesting a likely pullback.
🧠 Trade Idea: Short ETH/USD
Entry: $3,495 (current level)
Stop Loss: $3,676 (above resistance)
Take Profit: $3,130 / $3,082 (support targets marked on chart)
📌 Commentary:
ETH has been in a strong uptrend, but such parabolic rallies often retrace sharply once momentum fades. Given the strong rejection at daily resistance and the bearish 4H setup, I’m expecting a short-term retracement to the marked support levels.
📊 Watching price action closely near those zones for potential bounce setups.
🚨 Not financial advice. Always use proper risk management.
ETHUSD | 1W Time Frame | BITSTAMP ExchangeDate: July 18, 2025
The recent up-trend of Ethereum over the past few weeks has generated optimism among many supporters of this token. However, the critical resistance level at $4,000 poses a significant challenge to this bullish momentum. For the most optimistic Ethereum enthusiasts, who are hoping for a two-digit price, the ultimate goal is for Ethereum to reach $10,000 and beyond. Achieving this will hinge on breaking through the $4,000 resistance. If this barrier remains intact, Ethereum may continue to follow its previous disappointing trend.
On the other hand, Ethereum is currently supported by a substantial price floor around $1,600, which aligns with the SMA400 on the weekly time frame. While this level provides a solid foundation for mid-term and long-term holders looking to re-enter the market, it is essential to approach this support with caution. A sustained hold above this level is crucial for maintaining bullish sentiment; otherwise, a downturn could lead to further declines.

ETHUSD | WaverVanir Macro Map🧠 ETHEREUM: DON'T SELL BEFORE $9K
Weekly compression breakout confirmed.
Accumulation → Equilibrium → Expansion.
🚀 Targets based on long-term Fibonacci extension:
• 1.618 = $7,824
• 1.786 = $8,612
• 2.0 = $8,979 (WaverVanir threshold)
• 2.618 = $10,652
🔴 Premium zone around $4.8K will be the next key battle.
Volume base forming, volatility coiling.
If ETH clears this range, we expect full trend development through 2025.
WaverVanir DSS Protocol | ETHUSD Weekly | July 2025
#Ethereum #ETHUSD #MacroTrading #SmartMoneyConcepts #WaverVanir #VolanX #CryptoOutlook #LongTermThesis #TrendForecast

ETHUSD Is Going Up! Buy!
Please, check our technical outlook for ETHUSD.
Time Frame: 12h
Current Trend: Bullish
Sentiment: Oversold (based on 7-period RSI)
Forecast: Bullish
The market is approaching a key horizontal level 3,011.53.
Considering the today's price action, probabilities will be high to see a movement to 3,240.64.
P.S
The term oversold refers to a condition where an asset has traded lower in price and has the potential for a price bounce.
Overbought refers to market scenarios where the instrument is traded considerably higher than its fair value. Overvaluation is caused by market sentiments when there is positive news.
Disclosure: I am part of Trade Nation's Influencer program and receive a monthly fee for using their TradingView charts in my analysis.
Like and subscribe and comment my ideas if you enjoy them!

ETHUSD - Stretched price. Pullback to CL likelyPrice tagged the U-MLH, the stretch level.
Think of it like the 2nd STDV.
Now think Mean Reversion.
With such a stretch, price has a high chance to revert to the mean - down to the Centerline (CL).
What is this information good for?
a) take profit (...or 50% partial)
b) short on intrady signs
But if it is open and close above the U-MLH, then there's a good chance that price is advancing to the Warning Line, the extension of the Center to U-MLH.
Let's observe what happens.

ETHUSD – Possible Correction from Channel Resistance!Pair: ETH/USD
Timeframe: 4H
Structure: Ascending Channel
Indicators: RSI Overbought, Bearish Divergence Forming
Volume: Spike into resistance
📉 What’s happening?
Ethereum just tagged the top of its ascending channel, showing early signs of rejection. RSI is hovering near overbought, with weakening momentum on the last push.
⚠️ Caution Zone:
$3,425 acting as upper resistance
Price may retrace to midline or lower channel support ($3,250 → $3,050 range)
📌 Confirmation:
Look for:
A strong bearish candle or
RSI breaking below 60
Volume divergence
Bias: Short-term bearish correction, bullish structure intact as long as price holds the channel.
