Eth Key Levels reached Possible retracement key levels reached . Reset before 10k? Ethereum is ready to burst to 5 figures in the matter of weeks!
ETHUSD trade ideas
ETH might just be setting up for a monster move!Something BIG is brewing with #Ethereum...
👀 And it’s being quietly triggered by a law almost no one was talking about, till today.
A new rally could be closer than you think. Here's the full story 🧵👇
Last month, the U.S. Senate passed the Genius Act — the first serious law aimed at regulating stablecoins.
Sounds boring? It's not.
Because this act could light a fire under ETH... and hardly anyone sees it coming.
Stablecoins like CRYPTOCAP:USDC will soon have clear rules to follow.
That opens the doors for banks, funds, and institutions to use them legally — and massively.
And who benefits most from that? You guessed it: Ethereum.
Ethereum hosts nearly 50% of ALL stablecoin supply.
It's the core infrastructure of the stablecoin economy.
That means:
More stablecoin adoption → More activity on ETH → More gas fees → More ETH burned.
And it doesn’t stop there.
Right now, Ethereum handles about 60% of all stablecoin transactions.
Tron is in second place… with just 15%.
This is ETH's game to lose.
Here’s where it gets juicy:
ETH gas fees = ETH getting burned.
Rising stablecoin usage doesn’t just mean more revenue for the network…
It means less ETH in circulation.
And you know what that does to price.
Oh — and the smart money knows.
Since mid-2024, ETH whales have been quietly accumulating.
Whale holdings just hit their highest level since 2021.
Last time that happened?
Right before a massive rally.
Also… Ethereum activity is already spiking on-chain.
Transaction volume is rising, fast.
The last two times we saw this setup?
🔹 2016–2017
🔹 2020–2021
ETH went on to crush ATHs both times.
Circle — the company behind USDC — just IPO’d in June.
Their stock? Skyrocketed!
The stablecoin dominoes are falling fast...
And Ethereum is sitting at the center of it all.
To sum it up:
✅ Regulatory clarity (Genius Act)
✅ Institutional greenlight for stablecoins
✅ ETH is the foundation
✅ Whales accumulating
✅ On-chain activity heating up
✅ Supply burn kicking in
The House just rejected a key vote on the GENIUS Act.
🚨 Regulatory momentum just hit a speed bump — but the charts will tell you the real story.
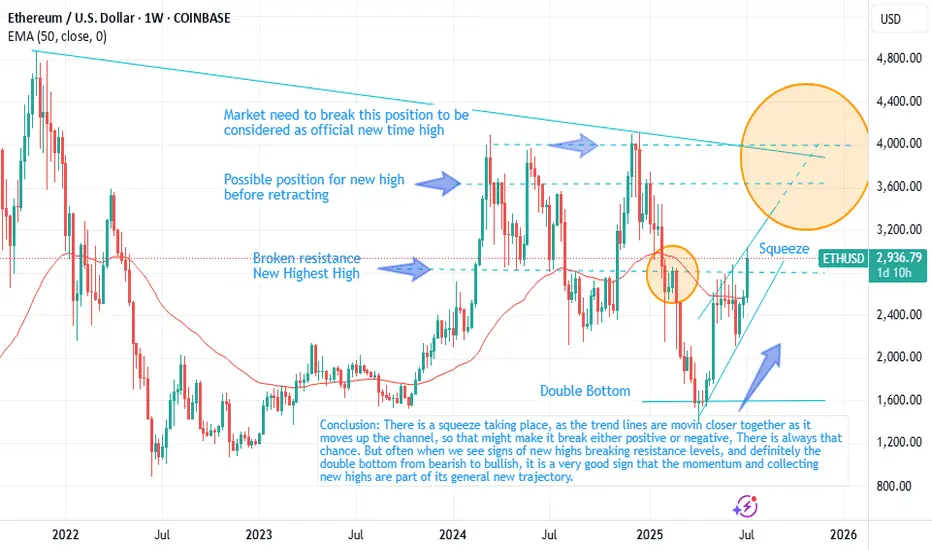
Pass or fail... ETH might just be setting up for a monster move.
Here’s the set up…
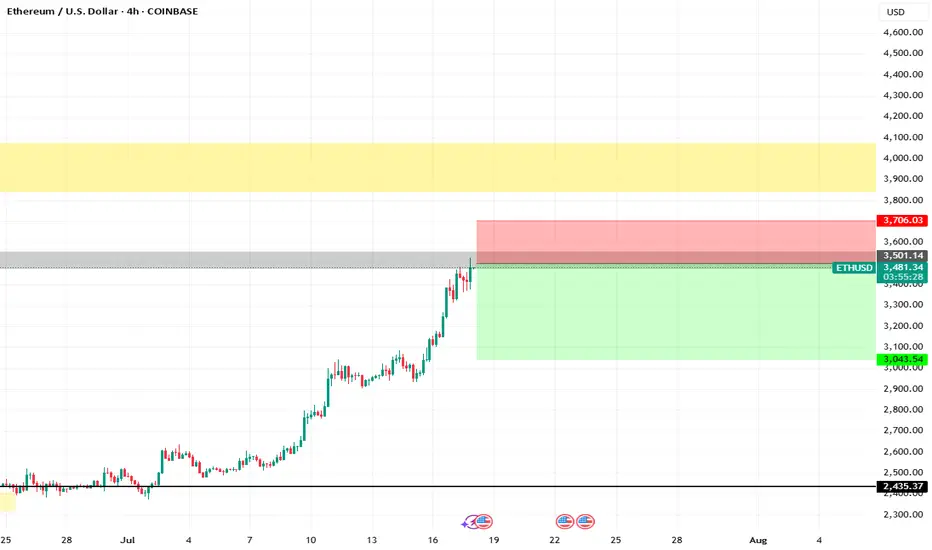
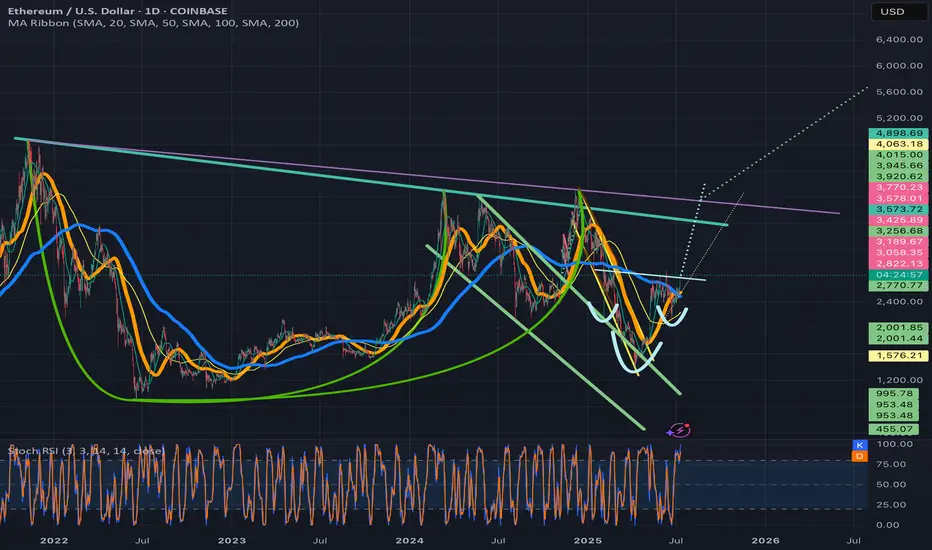
If ETH can secure a Weekly close above the orange major resistance and confirm a breakout above the yellow ascending trendline, we could experience LIFTOFF. 🚀
NFA... For edutainment purposes only!

ETHUSD 4H TIME FRAME ETHUSD is showing bullish momentum on the 4-hour chart with a strong structure to support further upside. The setup targets a potential continuation to 3,718.8, with protective risk control below 3,250.4. Watch for a clean break above 3,540 to accelerate the bullish move.

ETHUSD-SELL strategy 9 hourly chart Reg.ChannelNo doubt Crypto is more volatile than other asset classes, and even when very overbought it can run higher. It does not change the over all picture, and recovery is required over time. The correction is like to bring us back towards $ 2,875 area overall, but in steps .
Strategy SELL @ $ 3,300-3,375 and take profit near $ 3,025 at first, and re-sell after for a profit near $ 2,875.

ETHUSD one more downside motion possible follow entry rulesHey people,
no divergence showing up through the previous downside impulse, meaning, one more move down before long term upside is probable,
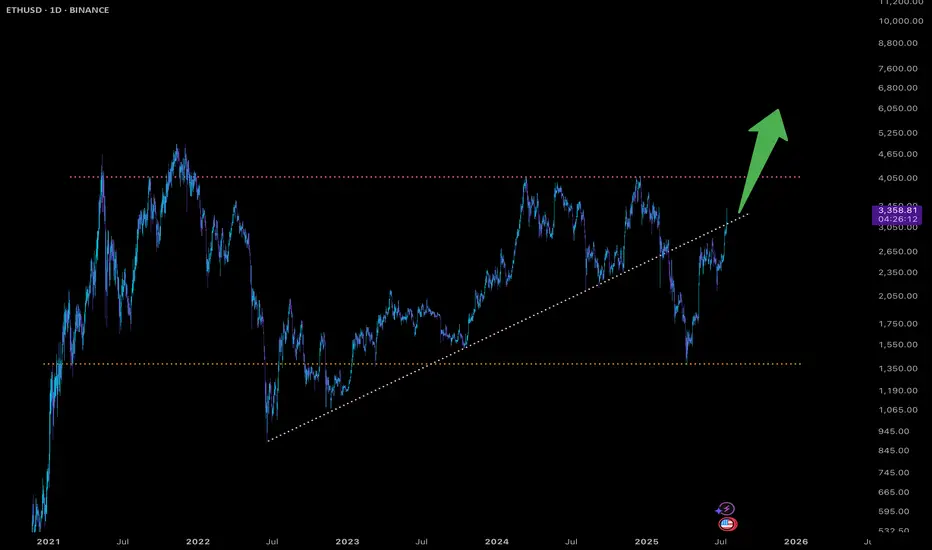
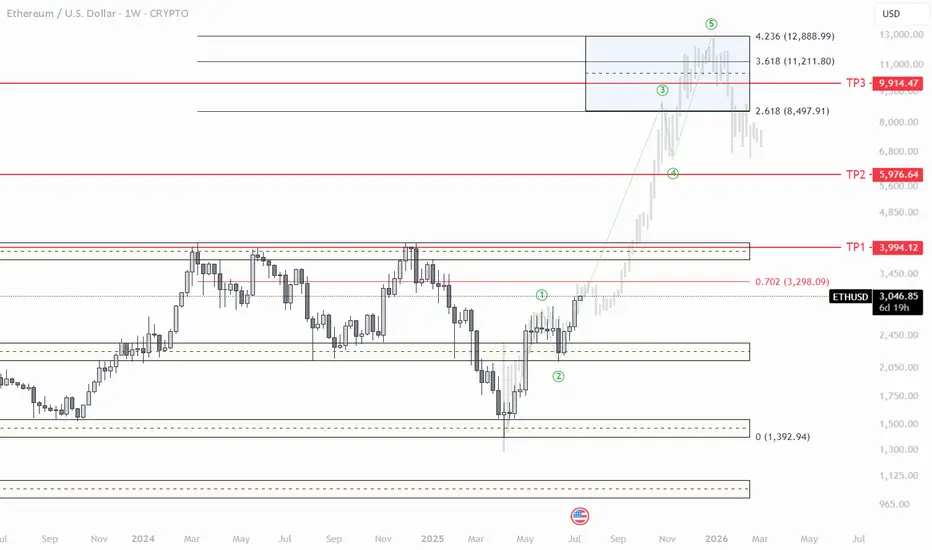
ETH Breakout Incoming:10K+ with Altcoin Rally, BTC to 140KEthereum (ETH) has returned to the trend, signaling strong bullish momentum. A confirmed breakout could propel ETH to 10K+, igniting the long-awaited altcoin run.
Bitcoin (BTC) is targeting 140-145K in this cycle.
I’ll provide the next update once I reassess the market after BTC hits this price target
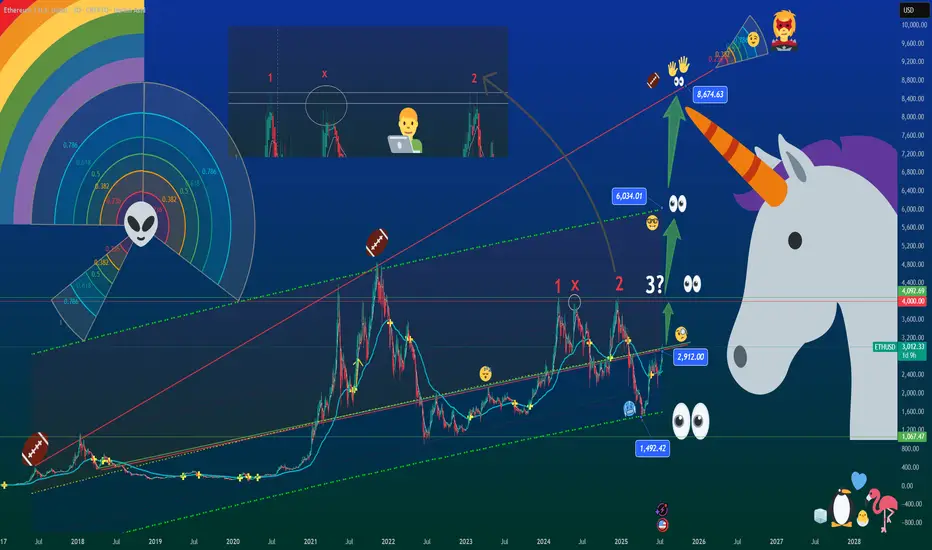
The Unicorn Breakout – Regression, Madness & Meme Math🦄 The Unicorn Breakout – Regression, Madness & Meme Math
FX_Professor | July 14, 2025
🎨 Welcome to my world…
Some draw straight lines.
I draw quadratic regression channels, alien spirals, and unicorns.
Because sometimes, the market is not just math — it’s emotion, storytelling, and madness therapy.
This chart isn’t just analysis. It’s a prophecy. It’s a canvas.
It’s for the traders who still feel.
📈 What are we looking at?
🧠 The Setup:
- Quadratic Regression Channel: Anchored from the 2018 top, respected for over 7 years. ETH is bouncing off the midline like it heard destiny calling.
- Major Resistance: The $2,900–$3,100 zone is our historic ceiling. Marked as 1 – X – 2… and next, not maybe but SURELY the decisive number3? 🚨 (X stands for 'no touch' ie 'close but no cigar' - Look at my recent BTC 1-2-3 breakout posts!)
- My Golden Cross: Quietly forming support. Check that xx/Xxx Secret EMA crossover. Setup reserved as a little family secret destined to be passed on to my sons (and some of you!).
- Alien Spiral (not Fib 😉 ): A colorful vortex leading us toward areas of re-accumulation and expansion. ETH is now riding the 0.382 arc — and you know what that means...
🚀 Targets:
- $4,000 — First milestone and zone of psychological resistance
- $6,034 — Mid-regression line + historical extension
- $8,674 — Unicorn Target Zone. Meme ATH + Euphoric breakout + Regression logic
👽 The Floor:
$1,067 – $1,492 — Alien Support Range™. If we nuke, that’s where we land, in pain. That's when we apply for jobs at Taco Bell (at least i love the food there, i am prepared for that scenario too).
🦇✨ Ethereum Community — this might be your time.
Dear ETH fam...
This isn't hopium.
This is regression math meeting Breakout Structure.
ETH has reclaimed key levels, rotated capital is flowing, and Bitcoin dominance is peaking. . WAIT FOR MY ETHBTC ANALYSIS (ON SUPPORT AND REBOUNDING)
The Unicorn doesn't knock twice.
If Ethereum Season is real — this chart might age beautifully.
🤹 Why the chaos?
Because markets are art.
Because crypto is culture. (and yes it's also 90% shit, you will hear a lot about that when that time comes).
Because every emoji here has meaning:
🦄 = Imagination
👀 = Momentum watchers
👽 = Alternative thinking
🏈 = Painful resistances, mental and physical toughness builds champions. Patience Wins!
🥶 = Cold accumulation
🧑💻 = Professor mode
🐧❤️🔥🐤🦩 = Read below…
🧊 The Penguin Message
Bottom right, you’ll see a penguin family :
A penguin, a flamingo, a baby chick, and a blue heart.
That’s not just decoration — it’s the real alpha.
💙 The best blockchain is YOU.
👶 The best altcoins are your CHILDREN.
🧊 The best staking is your FAMILY.
Trade smart. Build cool stuff. But don’t forget to be a good human.
The charts will wait. But your people won’t.
Spend time wisely: Learn skills, invest in YOURSELF, enjoy moments with loved ones, make others smile, be that change in the world.... and if you don't have kids then what on earth are you doing?? Go get laid, now! You are ready, stop thinking, just Do It (disclaimer: unless you have 5 already, in that case pls invest in condoms)
Share this with someone who needs to see this. Or just save it as 'ETH season'.
FX Professor — out.
🦄📈👁️
#ETH #Ethereum #UnicornBreakout #CryptoArt #QuadraticRegression #Altseason #TradingView #ChartTherapy #BeAGoodHuman
Ethusd breaking above invh&sEthusd chart has a similar set upas the total2 chart, a cup and handle that is breaking up from a smaller inverse head and shoulders that will complete the handle to the cup. Ethereum actually has two potential to trendlines for its cup and handle and I wouldn’t be surprised if both are valid. The breakout target for the inverse head and shoulder pattern will take price action above both of them. Once we solidify the top trendline for the cup and handle patterns as support the breakout target for it is $7161. Ethereum just recently had a golden cross on the daily which adds to the probability the inverse head and shoulder pattern breakout will be validated. *not financial advice*
Short Sell ETHUSD For Swing TradingShort Sell ETHUSD , It looking over bought on daily chart RSI is above 75.
Short Sell at 3160 Stop Loss at 3185 Target at 3120.
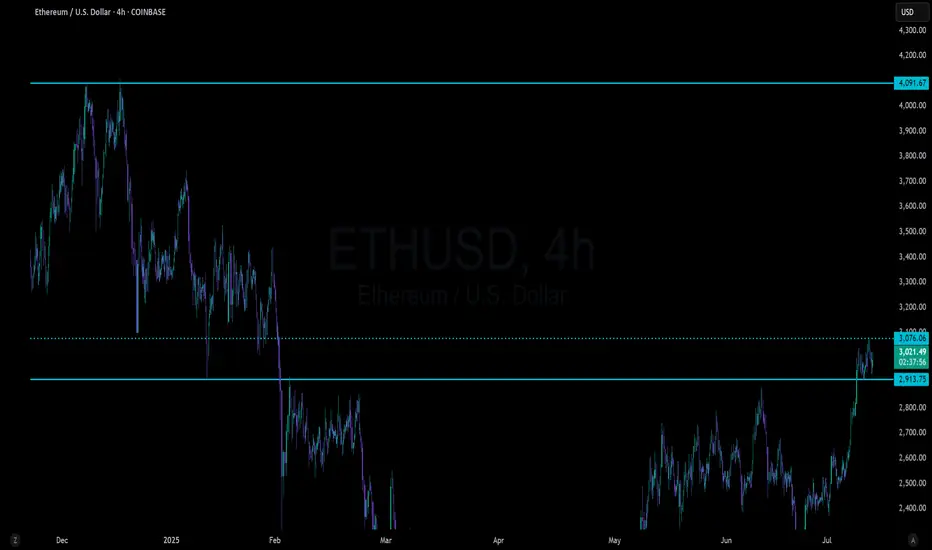
ETH - what next??Ethereum is perfectly touching a macro uptrend (5 touches acting as Support). Price has recently rallied but is currently pausing for breath. Could the uptrend begin to act as resistance? A break above this line would invalidate this thesis. Equally there is a huge resistance zone @ 3,550 - 4,100
And then there is the ATH
So there are a few hurdles in the way of printing a new ATH.
If Ethereum fails to break above the uptrend the fib retracement tool could take price to 1,900 (.618).
The next few days/weeks will give us an indication as to which direction we are headed.

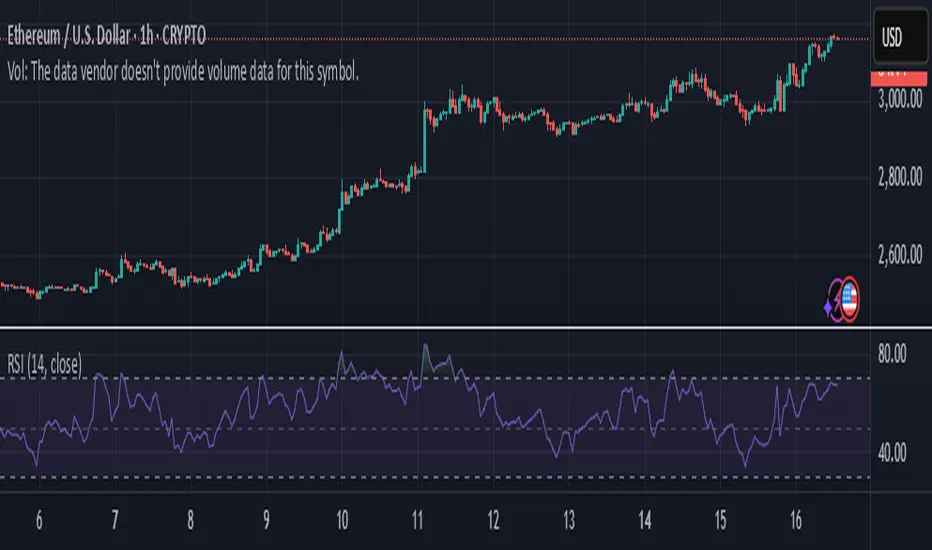
Bullish Outlook for Ethereum (ETH/USD)The chart shows a **bullish outlook for Ethereum (ETH/USD)** on the 1-hour timeframe, suggesting a potential continuation of the uptrend after a recent breakout.
Chart Breakdown:
* **Current Price:** \~\$3,038
* **Key Levels:**
* **S1 (Support 1):** Around \$2,996 — a key breakout and retest level.
* **S2 (Support 2):** Around \$2,945 — secondary support and accumulation zone.
* **EMAs:**
* EMA 7: \$3,023
* EMA 21: \$2,996
* EMA 50: \$2,970
The price is currently above all three EMAs, signaling **short-term bullish momentum**.
Bullish Scenario:
* The price recently **broke out above a strong resistance zone (\~\$2,996)**.
* If ETH successfully **retests and holds S1 as support**, we could see a continuation move toward:
* **\$3,080 → \$3,120 → \$3,160** as short-term targets.
* The green path suggests a **healthy pullback and continuation pattern**, which aligns with bullish market structure.
Invalidation/Bearish Scenario:
* A **break below S1 (\$2,996)** may shift bias toward S2 (\~\$2,945).
* Loss of S2 support could open the door for deeper correction..”

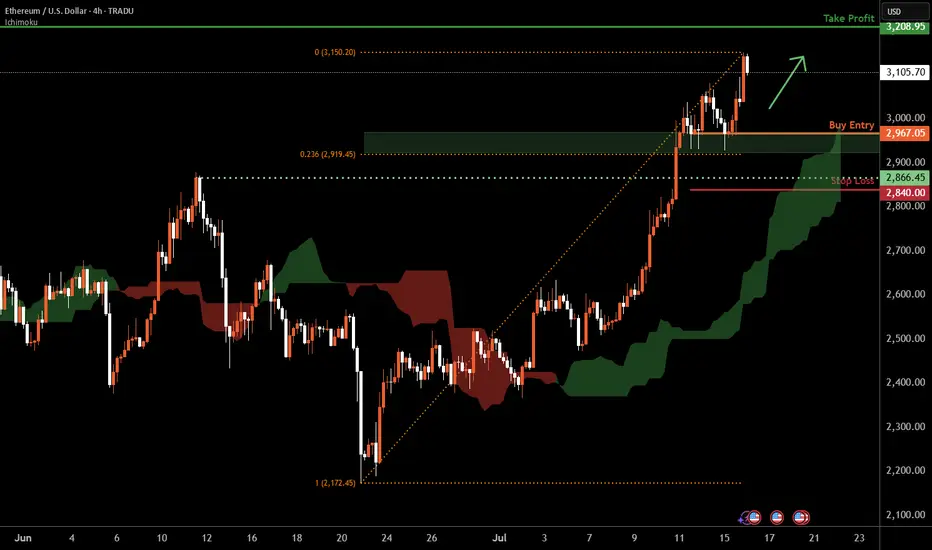
Ethereum H4 | Falling toward a multi-swing-low supportEthereum (ETH/USD) is falling towards a multi-swing-low support and could potentially bounce off this level to climb higher.
Buy entry is at 2,967.05 which is a multi-swing-low support that aligns closely with the 23.6% Fibonacci retracement.
Stop loss is at 2,840.00 which is a level that lies underneath a pullback support.
Take profit is at 3,208.95 which is an overlap resistance.
High Risk Investment Warning
Trading Forex/CFDs on margin carries a high level of risk and may not be suitable for all investors. Leverage can work against you.
Stratos Markets Limited (tradu.com ):
CFDs are complex instruments and come with a high risk of losing money rapidly due to leverage. 63% of retail investor accounts lose money when trading CFDs with this provider. You should consider whether you understand how CFDs work and whether you can afford to take the high risk of losing your money.
Stratos Europe Ltd (tradu.com ):
CFDs are complex instruments and come with a high risk of losing money rapidly due to leverage. 63% of retail investor accounts lose money when trading CFDs with this provider. You should consider whether you understand how CFDs work and whether you can afford to take the high risk of losing your money.
Stratos Global LLC (tradu.com ):
Losses can exceed deposits.
Please be advised that the information presented on TradingView is provided to Tradu (‘Company’, ‘we’) by a third-party provider (‘TFA Global Pte Ltd’). Please be reminded that you are solely responsible for the trading decisions on your account. There is a very high degree of risk involved in trading. Any information and/or content is intended entirely for research, educational and informational purposes only and does not constitute investment or consultation advice or investment strategy. The information is not tailored to the investment needs of any specific person and therefore does not involve a consideration of any of the investment objectives, financial situation or needs of any viewer that may receive it. Kindly also note that past performance is not a reliable indicator of future results. Actual results may differ materially from those anticipated in forward-looking or past performance statements. We assume no liability as to the accuracy or completeness of any of the information and/or content provided herein and the Company cannot be held responsible for any omission, mistake nor for any loss or damage including without limitation to any loss of profit which may arise from reliance on any information supplied by TFA Global Pte Ltd.
The speaker(s) is neither an employee, agent nor representative of Tradu and is therefore acting independently. The opinions given are their own, constitute general market commentary, and do not constitute the opinion or advice of Tradu or any form of personal or investment advice. Tradu neither endorses nor guarantees offerings of third-party speakers, nor is Tradu responsible for the content, veracity or opinions of third-party speakers, presenters or participants.
You be the judge.Hope you enjoy my analysis. I like to do technical analysis on charts.
If you like what I do please dont hesitate to give it a boost.
Thanks have a great weekend.
PS: I am not a professional, and this is not financial advice, please do your own research.
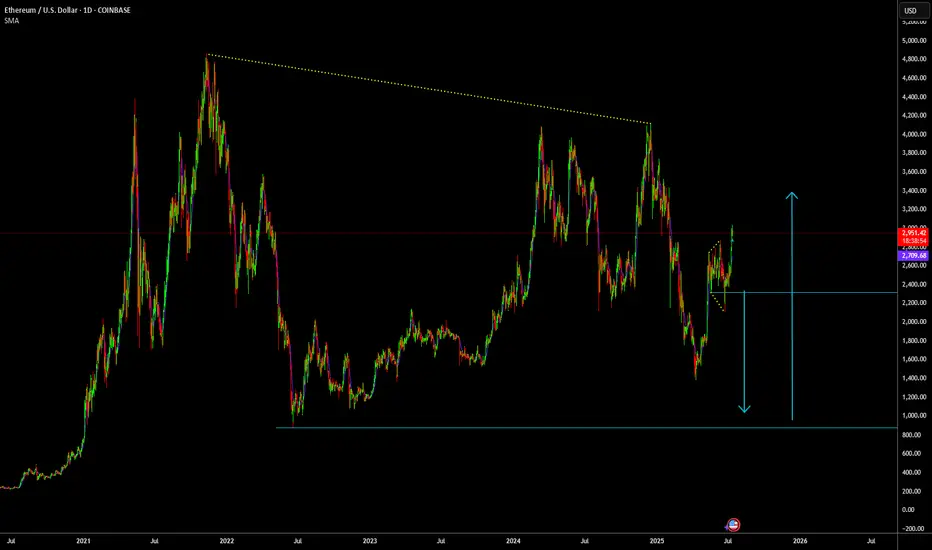
ETH Cycle TopETH is following a very similar setup to BTC in the previous cycle. This move should play out by the end of the year.
Will Ethereum reach 15K soon?In my video I share why is it possible for Eth to reach 14-17K in the next months.
Disclaimer: Not a financial advice

Ethereum - It's about damn time!Ethereum has been slacking for a couple of years.
The strong catalyst to excel Ethereum just seems to be lingering compared to the first 5 years.
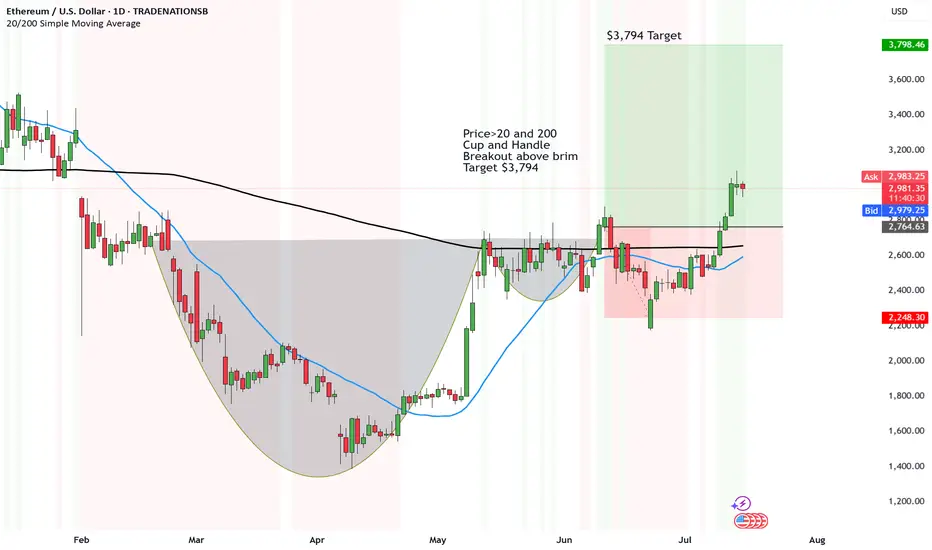
So, it looks like it's just following suit with Bitcoin current rally, as it hits all time highs and shines confidence to the rest.
So the update with Ethereum remains to be the same.
Price>20 and 200
Cup and Handle
Breakout above brim
Target $3,794
Disclosure: I am part of Trade Nation's Influencer program and receive a monthly fee for using their TradingView charts in my analysis.
ETHUSDHonestly, I’ve seen a lot of people say Ethereum isn’t what it used to be — not as active, not as hyped, maybe even “dying” compared to a couple of years ago. 🚶♂️📉
But here’s the thing: I didn’t get into ETH for the quick hype. I got in around $1,300, and I’m not planning on touching it until we’re somewhere around $6,500 or more. 🚀💎🙌
Ethereum is still the backbone of most real innovation in Web3 — smart contracts, DeFi, layer 2s, NFTs (yes, still alive), and massive institutional interest brewing beneath the surface. 🧠🔥
People forget: the best gains come when no one’s paying attention. The crowd’s asleep now… perfect. 😴🕵️♂️
I'm not here for short-term noise — I'm here for long-term value.
I’d rather hold strong while the market underestimates it, than chase FOMO later when it’s back on headlines. 💼🕰️📈
Let them doubt — I’m holding.
Let them forget — I’m positioning.
Let them sell — I’m accumulating. ⚖️🧘♂️
$6,500 isn’t a dream, it’s just the beginning.
ETH isn’t dead — it’s just recharging. ⚡️💻🧬

Ethereum Primed for Breakout as Institutional Interest SurgesBlackRock's aggressive ETH accumulation—$276M in February, $98M just this week—signals institutional conviction as Ethereum approaches a breakout towards $3,000. With real-world asset (RWA) tokenization exploding to $21B+ (Ethereum commanding 59% market share) and stablecoin volume hitting record $717B monthly highs, ETH is positioned as the backbone of traditional finance's blockchain migration.
The convergence of institutional buying, technical breakout signals, and Ethereum's dominance in the fastest-growing crypto sectors creates a perfect storm for the next major price surge 🚀
intel.arkm.com

Ethereum UP UP UPThe Perfect Storm: Multiple Technical Indicators Align for ETH's Next Leg Up
With Ethereum currently trading at $3,429, a comprehensive multi-faceted technical analysis reveals compelling evidence for continued bullish momentum through the remainder of 2025. Let's dive into the convergence of powerful technical signals pointing to ETH's next major move.
RSI: Hidden Strength Behind the Momentum
While Ethereum's daily RSI hovers around 72-73, typically considered overbought territory, this actually represents strength rather than exhaustion in a powerful bull trend. Historical analysis shows that during Ethereum's strongest rallies, RSI can maintain readings above 70 for extended periods, often reaching 80-85 before meaningful corrections.
The weekly RSI at 66 is particularly telling—showing robust momentum without reaching extreme levels. This creates the perfect scenario: strong enough to maintain upward pressure, yet not overheated enough to trigger immediate profit-taking. This "Goldilocks zone" for RSI often precedes the most explosive phases of bull markets.
Wyckoff Accumulation: The Smart Money Footprint
The recent price action perfectly aligns with Wyckoff's "Re-accumulation After Spring" pattern:
The May 2025 low represented a classic "Spring" that flushed out weak hands
The subsequent rally formed a textbook "Sign of Strength" (SOS)
We've completed the "Backup" phase with higher lows
Current price action suggests we're at the "Last Point of Support" (LPS)
According to Wyckoff methodology, this LPS typically precedes the most powerful "Mark-Up" phase—where institutional accumulation transitions to public participation and price discovery accelerates dramatically. The completion of this pattern projects a move to the $4,500-$5,000 range within the forecast period.
Order Blocks: Institutional Footprints Reveal the Path Forward
Order block analysis reveals significant institutional buying between $3,000-$3,200, creating a formidable support zone. More importantly, there's a notable absence of major selling order blocks above current levels until approximately $3,800-$4,000.
This "clean air" above current prices suggests minimal resistance and the potential for rapid price appreciation once momentum builds. The most significant buy-side order blocks have been forming during recent consolidations, indicating smart money accumulation before the next leg up.
Volume Profile: The Silent Confirmation
Volume analysis provides the confirmation needed to validate our bullish thesis:
Rising prices accompanied by increasing volume (particularly on up-days)
Volume Profile shows thin areas above $3,500, suggesting potential for rapid price discovery
The Volume-Weighted Average Price (VWAP) continues to slope upward, confirming the strength of the trend
The Volume Point of Control (VPOC) has shifted higher in recent weeks, indicating accumulation at higher prices—a classic sign of institutional confidence.
Fibonacci Projections: Mathematical Roadmap to Higher Targets
Using the recent swing low of $2,150 (May 2025) to the current level as our base measurement:
The 161.8% extension projects a target of approximately $4,200
The 200% extension suggests a move toward $4,700
The 261.8% extension (often reached in strong bull markets) points to $5,400+
What's particularly bullish is that these Fibonacci extensions align perfectly with key psychological price levels and unfilled liquidity pools above the market.
Elliott Wave Structure: The Roadmap to $5,000
The current Elliott Wave count suggests we're in the early stages of a powerful Wave 3 of 5 from the May lows:
Wave 1: $2,150 to $2,800
Wave 2: Pullback to $2,450
Wave 3: Currently underway, targeting $4,200-$4,500 (typical Wave 3 = 1.618 × Wave 1)
Wave 4: Future consolidation likely in the $3,800-$4,000 range
Wave 5: Final push potentially reaching $4,800-$5,200
Wave 3 is typically the longest and most powerful in the Elliott sequence, suggesting we're entering the most explosive phase of this bull cycle.
Price Projection Timeline
July-August 2025:
Initial push through the $3,600 resistance level, followed by accelerating momentum toward $3,800-$4,000. Any pullbacks will find strong support at $3,200, creating ideal entry opportunities for those who missed the initial breakout.
September 2025:
Breakthrough of the psychological $4,000 barrier, triggering increased media attention and retail participation. This phase could see rapid price discovery to $4,200-$4,400 as volume expands dramatically.
October-November 2025:
Final wave extension pushing ETH toward the $4,800-$5,200 range, potentially culminating in a blow-off top characteristic of Wave 5 completions. This represents a 40-50% appreciation from current levels.
The Confluence That Cannot Be Ignored
What makes this analysis particularly compelling is the rare confluence of multiple technical frameworks all pointing to the same conclusion. When Wyckoff accumulation patterns, Elliott Wave projections, Fibonacci extensions, RSI momentum, and order block analysis all align, the probability of the projected outcome increases exponentially.
Smart money is positioning for this move now, as evidenced by the order block formation and volume patterns. For the strategic investor, the current price level—despite being near recent highs—represents an attractive entry point before the next major leg up in Ethereum's journey.
The technical roadmap is clear: Ethereum is poised for a significant appreciation through the remainder of 2025, with multiple technical frameworks projecting targets in the $4,500-$5,200 range by year-end.

Ethereum´s local and possibly even macro bottom is in!- first ever White Stripe present on the 3W which is a very high time-frame
- Eth has experienced a more than 60% drop ever since the highs with no real relief inbetween
- at the very least, a strong bounce to 2400, 2500 is expected
- there is also the possibility that this is THE bottom before eventually Eth makes new ATHs, possibly this but probably next year

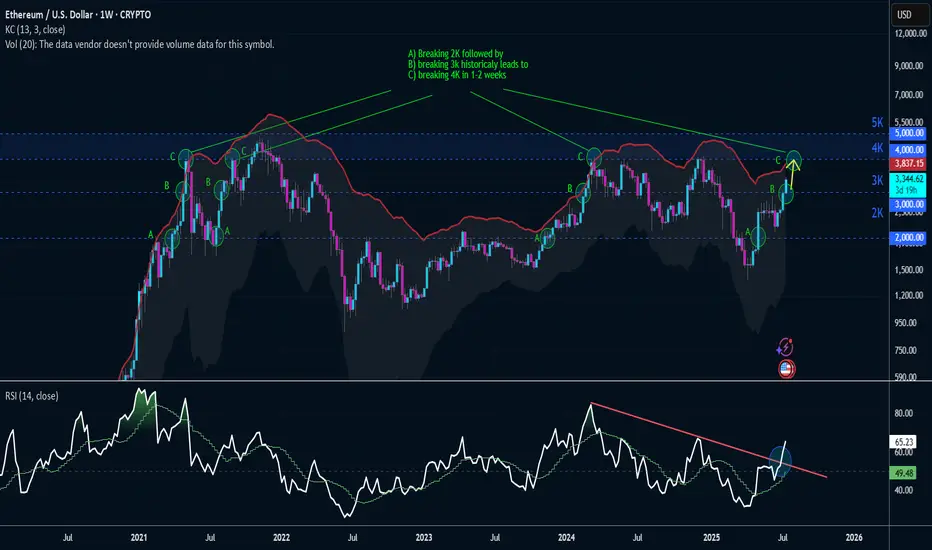
Next Stop -> 4K4 out of 4 historical times -> Ethereum has hit 4K in 1 to 2 weeks after breaking 2K and 3K sequentially.
ETHEREUM WILL KEEP GROWING|LONG|
✅ETHEREUM is trading in a
Strong uptrend and the coin
Broke the important horizontal level
Of 3000$ which is now a support
And we are very bullish biased
And we think that ETH will
Reach at least the previous ATH
Of just short of 5000$ but the
First target is to reach and break
A resistance level of 4100$
LONG🚀
✅Like and subscribe to never miss a new idea!✅
Disclosure: I am part of Trade Nation's Influencer program and receive a monthly fee for using their TradingView charts in my analysis.
