As you can imagine on this day... the trade is validated. and I'As you can imagine on this day... the trade is validated. and I'm OUT OUT OUT
ETHUSD trade ideas

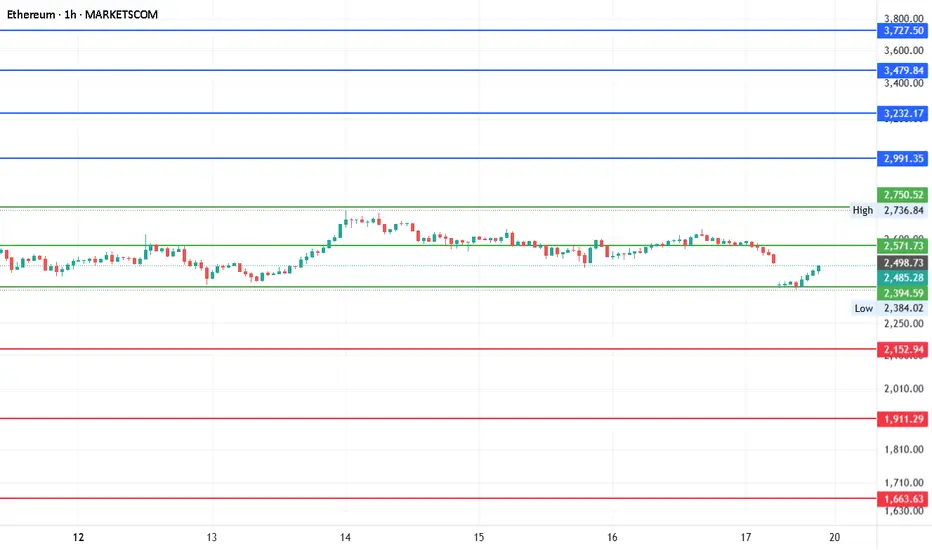
#ETHEREUM - 900 POINTS MOVE ON THE RADARDate: 19-05-2025
#ETHEREUM - The last time we posted an update on this scrip was on 24th April. In fact, we did have had a run-up for about 900+ points move and we are expecting the same this time around also. I am making it very clear that the number of points it can move but not a direction. The chart says so.
Current Price: $2469
Mid-Point: $2571.73
Upside Targets: $2991.35, $3232.17, $3479.84 and $3727.50
Downside Targets: $2152.94, $1911.29, $1663.63 and $1415.96
Support: $2394.59
Resistance: $2750.52
ETHUSDETH USD Conditional trade// High risk
Possible Head and shoulder in making
Wait for neck to break
Look for retest and bearish candle
then enter otherwise invalid

ETHUSD - ANOTHER GROWING WEEK
ETHUSD - ANOTHER GROWING WEEK✅
ETHUSD has been growing all these days together with a bitcoin. All the news, listed in my previous post for the BTCUSD are also valuable here. Really nice fundamental support, people are purchasing the asset.
But what's with technicals? 📊
Compared to the bitcoin, ETHUSD hasn't reached ATH. According to a daily chart (pic 1), the price has been moving sideways since 2021 and a strong resistance is waiting ahead at 4,000.00. However, for now we are good. I bet that during upcoming days the asset will reach this level and rebound from it. Will it break the resistance? I think it is too early to make any conclusions.

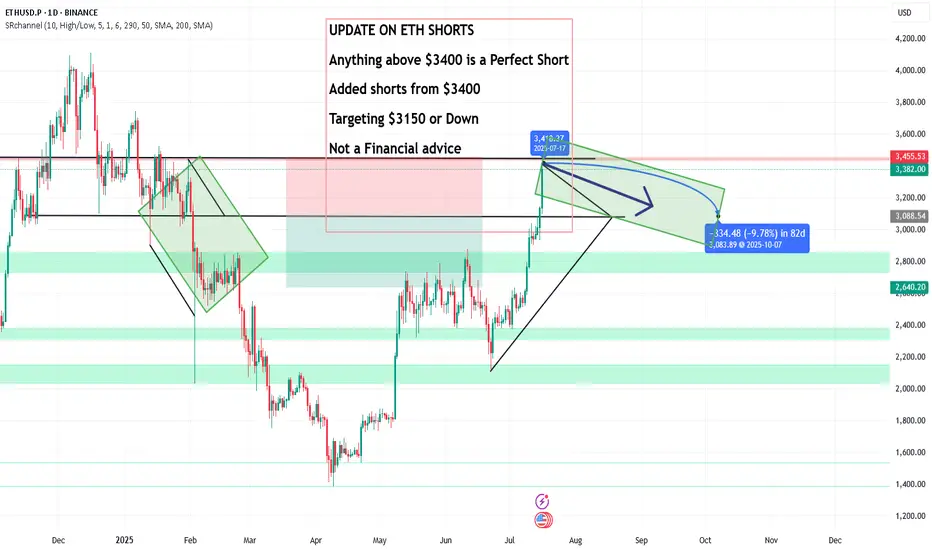
UPDATE ON ETH SHORTS, Anything above $3400 is a Perfect ShortUPDATE ON ETH SHORTS
Anything above $3400 is a Perfect Short
Added shorts from $3400
Targeting $3150 or Down
Not a Financial advice
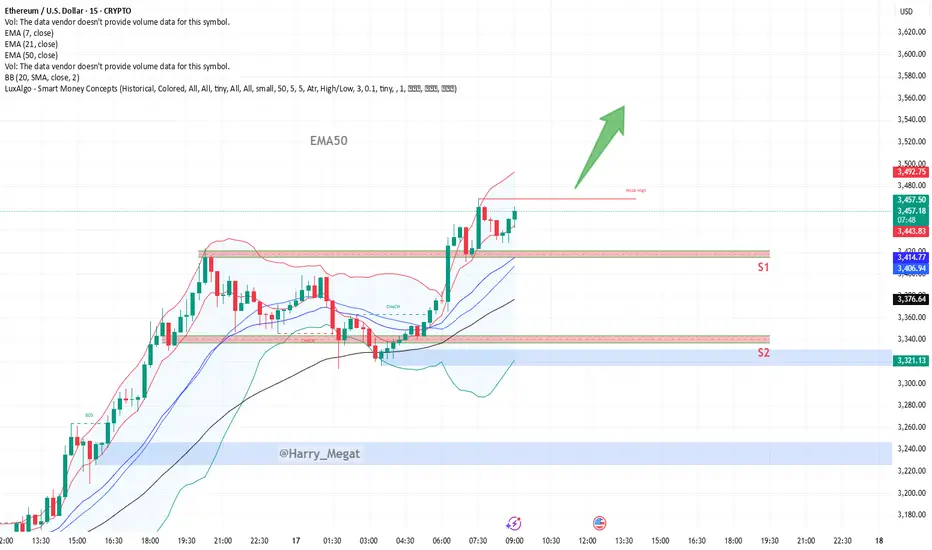
Technical **chart analysis** for ETH/USDTechnical **chart analysis** for **ETH/USD** based on (15-min timeframe) :
Bullish Outlook**
* **Price Action**: Ethereum is consolidating just above previous resistance (\~\$3,440) after a breakout from the range.
* **Current Price**: \~\$3,446
* **EMA Support**:
* EMA 7: \$3,441 (price holding above)
* EMA 21: \$3,413
* EMA 50: \$3,376 (strong dynamic support)
Key Levels**
* **Resistance Broken**: Former resistance zone (\~\$3,415–\$3,440) now acting as support.
* **S1 Support Zone**: \$3,415–\$3,440 (ideal retest zone for long entries)
* **S2 Support Zone**: \$3,335–\$3,350 (next demand zone if S1 fails)
Analysis Summary**
* **Trend**: Bullish momentum is intact above EMA cluster.
* **Setup**: Retest of breakout zone successful → price stabilizing above EMA7.
* **Target Area**: If momentum continues, next target zone could be \$3,500–\$3,560 (as shown by green arrow).
* **Invalidation**: Drop below \$3,413 (EMA21) and especially \$3,376 (EMA50) would weaken the bullish structure.
Ethereum (ETH) – Strategic Trade PlanEthereum (ETH) continues to show resilience, currently trading around $1,790 after a strong bounce earlier this month. While the crypto market remains volatile, ETH is holding key technical levels that could fuel a major move in the coming weeks.
🎯 Entry Points:
Market Price: $1,790 — Ideal for an early position, as ETH holds above critical support zones.
$1,645 — Secondary strong support, aligning with the 20-day EMA; great for scaling in if market pulls back.
$1,400 — Deep value zone, offering a high-risk/high-reward setup if broader market correction occurs.
💰 Profit Targets:
$2,500 — First major resistance. A realistic mid-term target if bullish momentum sustains.
$3,000 — Psychological milestone and breakout confirmation level.
$3,800+ — Ambitious but achievable with broader crypto market recovery and strong ETH network metrics.
🛡️ Risk Management:
Set stop-losses dynamically below each entry support level.
Scale into positions progressively to manage volatility.
Monitor macroeconomic trends and Bitcoin's influence closely.
🔍 Key Observations:
Strong on-chain activity supports a bullish thesis.
Current resistance around $1,812 must be broken to confirm bullish continuation.
Be cautious of sudden market-wide corrections — always plan your exits and manage your risk accordingly.
📢 Disclaimer: This is not financial advice. Trading cryptocurrencies involves significant risk, and you should only invest what you can afford to lose. Always perform your own research before entering any position.

eth,long trend is comingmaybe last from 2025 to 2026
key points:4000,4800
Big big guess, value around $1 trillion, price near $8000

ETH - UpdateETH has been "crashing" lately but I think it is in the end state of a long rally. In fact I think we are in the last stage of Wyckoff distribution and we could see a major rally soon. Looking at the 300 SMA we bottomed there in June 22 and if we hold there, it could be the spring board for a massive rally to new highs.
Also I think GLD will top in a week or so which will be good for BTC and ALTS.
Not investment advice. Please like and share and leave a comment.

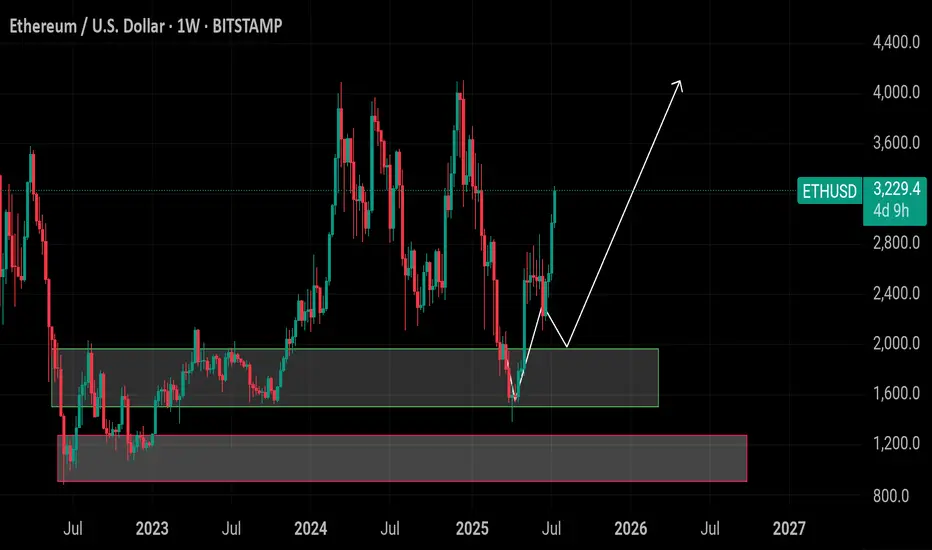
Ethereum $ETH – Perfect Accumulation to Rally Move!
🔸 Ethereum CRYPTOCAP:ETH – Perfect Accumulation to Rally Move!
ETH perfectly hit our long-term buying zone between $1,900 – $1,500, where we accumulated heavily. This range once again acted as a strong demand zone and launchpad.
🔸 Target: $4,000 – $4,500
After hitting our buying range, ETH has now rallied to $3,250 — showing strong bullish momentum. If price continues to hold above $3,000, the next target zone is $4,000 – $4,500.
🔸 Risk Level:
Any breakdown below $2,200 would weaken the structure and shift the bullish outlook. This is our invalidation level on a higher time frame.
🔸 Outlook:
Partial profit-taking around $3,200 – $3,500 zone
Hold remaining positions for $4,000+ targets
Use $2,900 – $3,100 zone for fresh or re-entries on dips
Maintain tight stop loss under $2,200 if adding new exposure
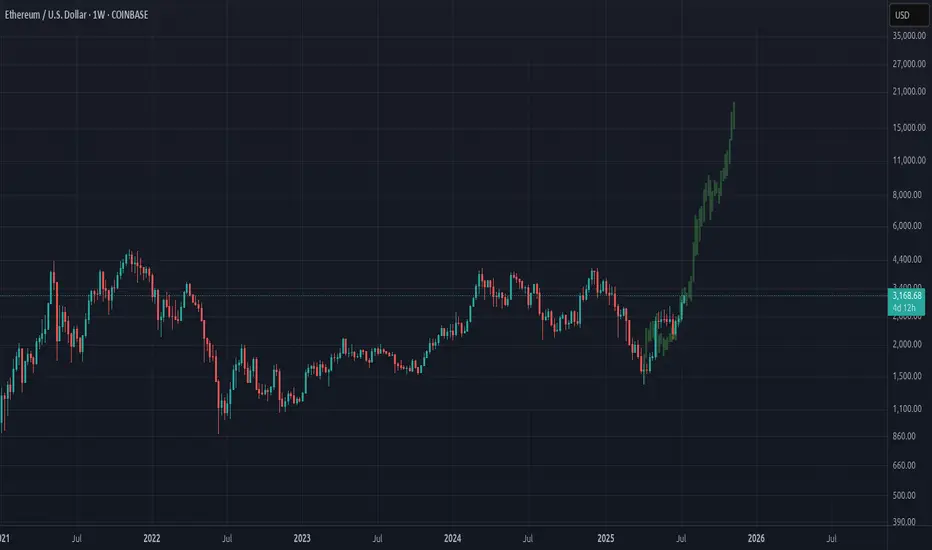
Ethereum LFGFractal from beginning of last cycles bull market. Estimated target $20K by November/December 2025. Significant pull-back around physiological level of $10K in autumn.
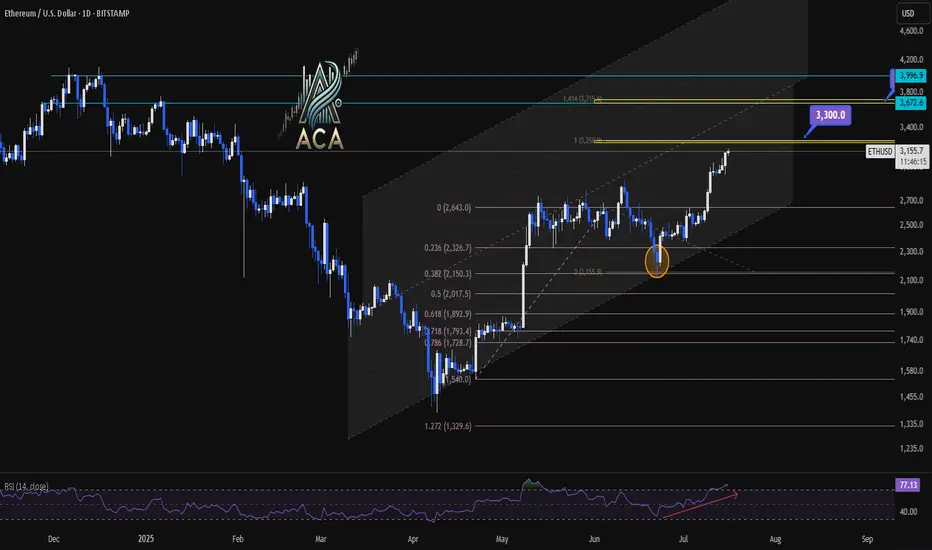
ETHUSDT 1D Chart Analysis | RSI Strength & Fibonacci TargetsETHUSDT 4H Chart Analysis | RSI Strength & Fibonacci Targets in Play
🔍 Let’s break down the latest ETH/USDT setup — bullish momentum is building with confluences pointing toward key upside targets.
⏳ 4-Hour Overview
Ether continues climbing within a well-defined ascending channel, with recent candles holding above mid-level support. Price is pressing higher from a clean bounce at the 0.5 and 0.618 Fibonacci retracement zone ($2,017–$1,899), signaling the correction has likely ended.
📉 Fibonacci Levels & RSI Confirmation
- The strong recovery aligns with rising volume and a bullish structure.
- RSI is pushing into overbought territory (above 73), often a sign of strength during trends—not exhaustion.
- ETH is now positioned for a breakout continuation move if momentum holds.
🎯 Bullish Targets Ahead
- Immediate resistance: $3,300 (1.414 Fib extension + historical supply)
- Next major target: $3,700 (1.618 extension + upper channel confluence)
- Pullback zones: $2,950 (mid-channel) and $2,017 (Fib support base)
📊 Key Highlights:
- Price is respecting the rising channel structure — higher lows, higher highs in play.
- Volume supports the breakout narrative, rising on green candles.
- RSI breakout supports trend continuation, not exhaustion.
- Targets at $3,300 and $3,700 remain actionable on a confirmed breakout.
🚨 Conclusion:
ETH is showing a multi-variable bullish setup with clear continuation potential. A strong move above $3,300 could quickly send price toward $3,700. Pullbacks to $2,950–$2,017 could offer high-risk/reward re-entry zones. Momentum favors bulls — stay alert.
Wrong call!I have absolutely ate shit calling for lower drop couple days ago
Keep in mind, per Elliott Wave this still could be lower high - not that I am rooting for it, just giving possibility here.
Invalidation is the red line

ETHUSD - Bullish RectangleETHUSD is making Bullish Rectangle Pattern, will it break & move towards target price?
Entry, Stop Loss & Take Profit are mentioned.

ETHEREUM WILL KEEP GROWING|LONG|
✅ETHEREUM is going up
Now and the coin made a bullish
Breakout of the key horizontal
Level of 3000$ and the breakout
Is confirmed so we are bullish
Biased and we will be expecting
A further bullish move up
LONG🚀
✅Like and subscribe to never miss a new idea!✅
Disclosure: I am part of Trade Nation's Influencer program and receive a monthly fee for using their TradingView charts in my analysis.

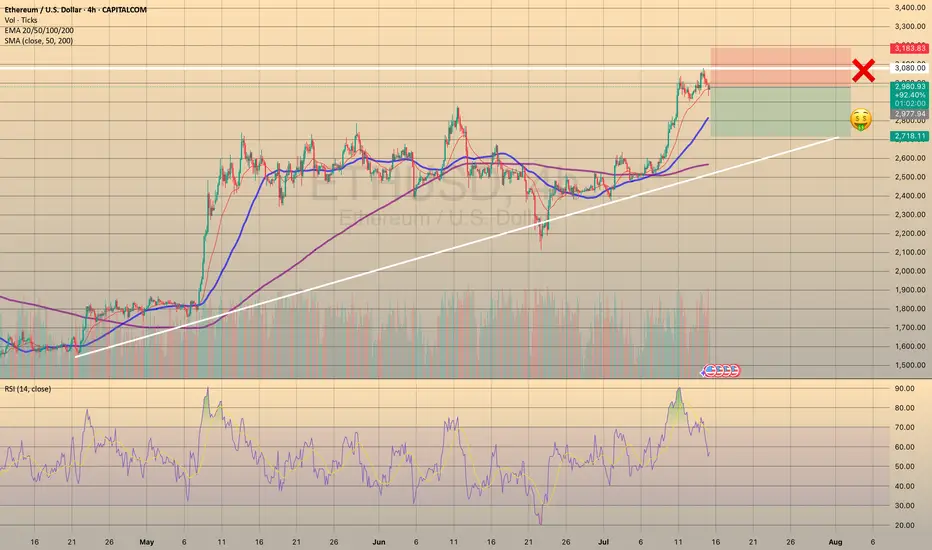
ETHUSD REACHED NEW HIGH - SHORT OPPORTUNITY
TRADING IDEA - ETHUSD REACHED NEW HIGH - SHORT OPPORTUNITY📉
The same as BTCUSD, ETHUSD has reached a new maximum at 3.083.52. After that the asset went sideways, waiting for some impulse. I see strong divergence on 4h timeframe on RSI and expect a decline within next 24-48 hours. Basically, it is the same story here as with the bitcoin, cause the nature of the recent hike is also the same. So, I put a
🔽 a market sell order at 2977.94 with
❌a stop loss at 3183.83 and
🤑a take profit at 2718.11
It is a counter-trend trade, so it's a bit more risky than usual.
Trade cautiously! Preserve your deposits!
ETHUSD-SELL strategy 6 hourly chart Reg. ChannelIt is quite overbought, and besides, negative divergence is developing, and considering negative indicators, we should see move back to $ 2,900 > 2,775.
Strategy SELL @ $ 2,975 - 3,050 and take profit initially @ $ 2,840 for now.

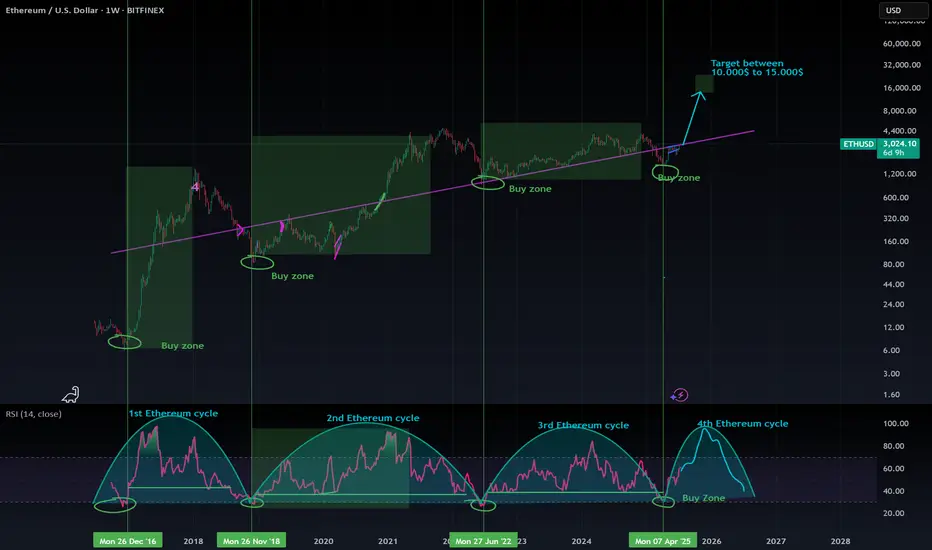
ETH reclaiming yearly support and going to the moon !The march bottom was a total reset of Ethereum price cycle and the beginning of a new one.
Now altcoin season is confirmed, ETH nicely reclaimed the yearly support.
And can now go to price discovery again !
Target around end of the year around 10k to 15k.
ETH 4H: Retest in Progress
ETH on the 4H starts the week strong, currently retesting support at the 0.382 Fib, a level that acted as resistance last week.
We’ve had two 4H candle closes above it, but now a close below seems likely.
I’ve set a TP at the 4H-50% line, just under the PSAR dots, to take 50% profit if price dips further.
Always take profits and manage risk.
Interaction is welcome.

Ethereum Breaks $3,000: Hype Meets UtilityEthereum (ETH) has surged above $3,000, driven by a wave of retail and institutional momentum following the presale success of Little Pepe (LILPEPE), a meme coin built on a new Ethereum-compatible Layer 2 network. With over $5 million raised during the presale, the appetite for meme-coin ecosystems continues to fuel Ethereum’s utility narrative, giving it both technical and psychological strength.
Key Levels to Watch:
• Short-term Structure (H4 Chart): ETH is currently forming a bullish flag pattern, a continuation structure that often precedes further upside.
• Upside Scenario: A confirmed breakout above $3,100 could extend the rally to $3,200, and potentially test $3,300, a level of major historical resistance.
• Downside Risk: Failure to hold current levels may see ETH retrace back toward $2,900, with the 50% Fibonacci retracement at $2,600 acting as the next support zone.
If sentiment in the broader crypto market remains elevated and Bitcoin holds firm near all-time highs, Ethereum’s bullish setup may have further room to run.

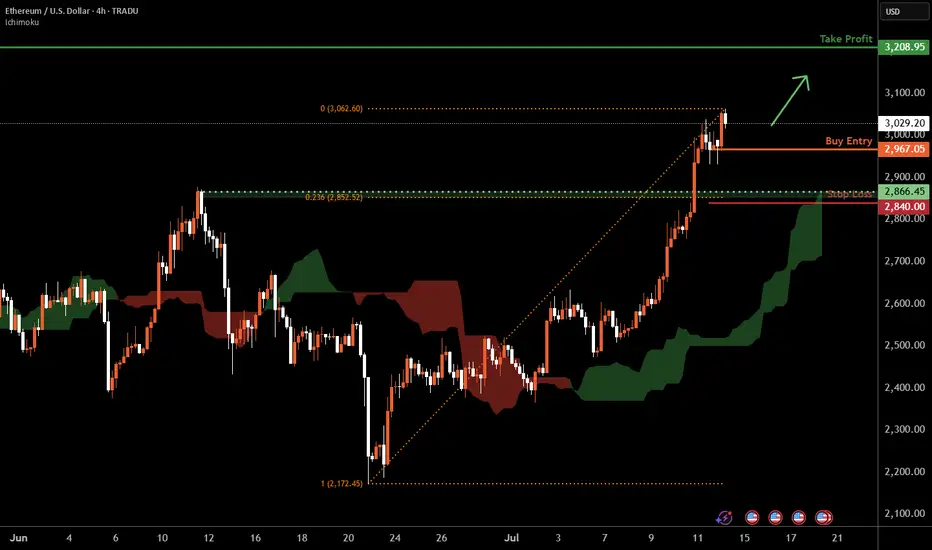
Ethereum H4 | Bullish uptrend to extend higher?Ethereum (ETH/USD) is falling towards a swing-low support and could potentially bounce off this level to climb higher.
Buy entry is at 2,967.05 which is a swing-low support.
Stop loss is at 2,840.00 which is a level that lies underneath a pullback support and the 23.6% Fibonacci retracement.
Take profit is at 3,208.95 which is an overlap resistance.
High Risk Investment Warning
Trading Forex/CFDs on margin carries a high level of risk and may not be suitable for all investors. Leverage can work against you.
Stratos Markets Limited (tradu.com ):
CFDs are complex instruments and come with a high risk of losing money rapidly due to leverage. 63% of retail investor accounts lose money when trading CFDs with this provider. You should consider whether you understand how CFDs work and whether you can afford to take the high risk of losing your money.
Stratos Europe Ltd (tradu.com ):
CFDs are complex instruments and come with a high risk of losing money rapidly due to leverage. 63% of retail investor accounts lose money when trading CFDs with this provider. You should consider whether you understand how CFDs work and whether you can afford to take the high risk of losing your money.
Stratos Global LLC (tradu.com ):
Losses can exceed deposits.
Please be advised that the information presented on TradingView is provided to Tradu (‘Company’, ‘we’) by a third-party provider (‘TFA Global Pte Ltd’). Please be reminded that you are solely responsible for the trading decisions on your account. There is a very high degree of risk involved in trading. Any information and/or content is intended entirely for research, educational and informational purposes only and does not constitute investment or consultation advice or investment strategy. The information is not tailored to the investment needs of any specific person and therefore does not involve a consideration of any of the investment objectives, financial situation or needs of any viewer that may receive it. Kindly also note that past performance is not a reliable indicator of future results. Actual results may differ materially from those anticipated in forward-looking or past performance statements. We assume no liability as to the accuracy or completeness of any of the information and/or content provided herein and the Company cannot be held responsible for any omission, mistake nor for any loss or damage including without limitation to any loss of profit which may arise from reliance on any information supplied by TFA Global Pte Ltd.
The speaker(s) is neither an employee, agent nor representative of Tradu and is therefore acting independently. The opinions given are their own, constitute general market commentary, and do not constitute the opinion or advice of Tradu or any form of personal or investment advice. Tradu neither endorses nor guarantees offerings of third-party speakers, nor is Tradu responsible for the content, veracity or opinions of third-party speakers, presenters or participants.
ETH / USDC Liquidity Pool RangeEthereum is climbing alongside Bitcoin, but it’s clearly outperforming. In many ways, ETH is the Microsoft of the crypto space—serving as a foundational platform on which countless networks and tokens are built, much like Windows supports a broad software ecosystem. In contrast to Bitcoin’s role as a digital currency, Ethereum functions more like a software operating system.
We broke out of the previous range for strong profits. The new range is tighter, with the lower boundary set just above the current ETH spot price at $2,995.91 and the upper boundary at $3,340.90, as marked by the horizontal yellow lines. On the 3-hour chart, momentum is beginning to turn upward. To enter the liquidity pool within this range, we must be fully allocated in ETH.

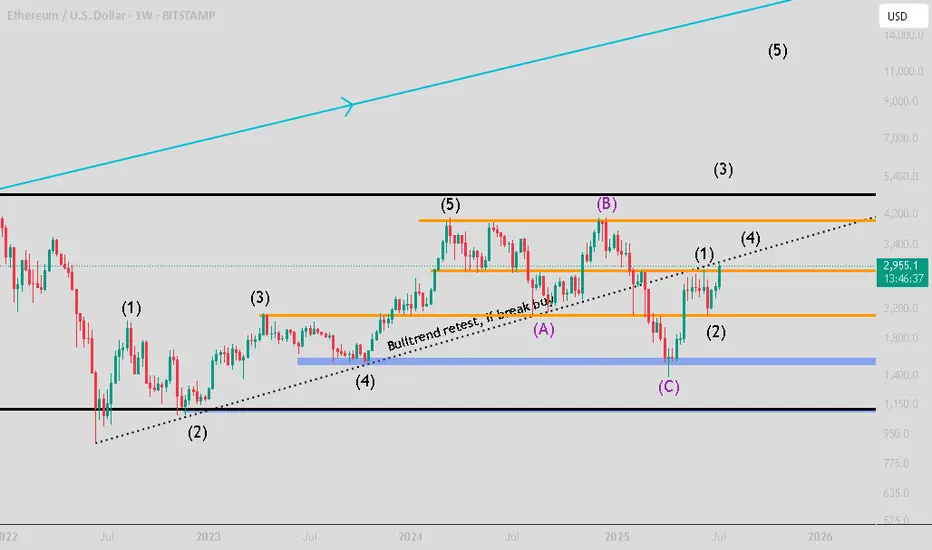
ETH : I'm not in yet and why ?Hello, good ?
Me yes or no.
I'm not in ETH move yet, because for the moment, we are in a retest of the bulltrend.
The wave C is a perfection if we look Elliot wave.
But now, if we look the actual move in BTC, we can easily imagine a breakout of ETH.
And we can see an elliot wave configuration for the new uptrend. Wave 3 can be between 4500 and 5000.. But more if we have a brutal move on BTC.
The best case for the wave 3 is above the ATH, then ATH retest, then discovering price.
Which target final target ? Best case 15-17k
Worst case : 5-7k
You have the intermediates levels (orange) to help you to enter.