Wajani Investments: ETHUSD Analysis
ETHUSD has currently formed a triangle with a resistance broken to the upside. In most circumstances, I’ll like to wait for a retest of that resistance, i.e. resistance-becomes support to be sure that the breakout was not false. Once that level is tested and held, I’ll take a trade assuming Leg2 would have a similar move like Leg1. This is a very good trade with a 1:4 RR.
If you have any questions, feel free to ask. You can add or subtract from this idea.
Remember, trading always carries risks, and this is for EDUCATIONAL PURPOSES only.
ETHUSD trade ideas

ETHUSDTAre the sellers willing
The buyers are exhausted 😕
Seeing how sluggish they've become
Price head back to the point they once sold off from.
Will the sellers dominate or there are going to be another drama
Eyes on short

DaxPrime: BlackRock Exec Move Signals SharpLink’s $1.3B ETH ShifIn a development that is drawing attention across both institutional finance and the crypto ecosystem, a senior executive from BlackRock’s digital assets division has transitioned to SharpLink Gaming — a rising Ethereum whale and sports betting infrastructure player now managing over $1.3 billion in ETH-based assets. At DaxPrime, we see this move not as an isolated career shift but as a strategic signal of deepening convergence between traditional asset management and Web3-native businesses.
The Move: From Wall Street to Web3 Execution
According to sources familiar with the matter, BlackRock’s former Head of Digital Asset Strategy, Daniel Wexler, is joining SharpLink Gaming as its Chief Digital Officer. Wexler played a critical role in shaping BlackRock's crypto ETF initiatives and oversaw early-stage partnerships with Ethereum ecosystem projects.
His transition comes at a time when SharpLink — originally focused on B2B sports betting technologies — has evolved into a key player in decentralized infrastructure, integrating smart contracts, Layer-2 analytics, and tokenized in-game markets. The company currently holds over $1.3 billion in Ethereum, making it one of the largest corporate ETH holders in the entertainment-tech sector.
DaxPrime’s View: Strategic Talent Realignment
At DaxPrime, we interpret this as more than just a personnel update. It reflects a broader realignment where institutional talent is gravitating toward firms that offer speed, flexibility, and a native role in the decentralized economy.
“The move illustrates a trend we’ve tracked since early 2024: legacy finance professionals are increasingly pivoting toward operational roles in Web3-native companies, particularly those with real assets and strong ETH exposure,” says Michaela Strobel, Senior Analyst at DaxPrime.
SharpLink’s use of Ethereum spans beyond treasury holdings. The firm is building proprietary smart contract infrastructure for real-time sports data feeds, NFT-linked fantasy games, and decentralized betting protocols — signaling a broader use-case than speculative ETH storage.
Ethereum as a Strategic Asset
Wexler’s decision also underscores Ethereum’s growing importance as a corporate strategic asset, not merely an investment vehicle. Ethereum’s programmable layer and widespread developer adoption make it the backbone of emerging digital business models — including SharpLink’s.
DaxPrime’s July 2025 ETH Treasury Index reveals that more than 18 publicly listed firms now hold over $500 million in Ethereum each, compared to just five a year ago. This uptick is particularly concentrated in sectors like digital media, AI-gaming convergence, and decentralized finance tooling.
“Ethereum’s shift from an investment to infrastructure asset is well underway,” Strobel notes. “Wexler’s move brings boardroom-grade credibility to a company operating deep within that transformation.”
What It Means for Investors
For investors, this move signals two critical developments:
Institutional Validation of Web3 Business Models: Wexler’s transition lends credence to firms building around Ethereum-based infrastructure, rather than just speculating on token prices.
New Pathways for ETH Utility: SharpLink’s planned integration of ETH staking, yield strategies, and decentralized oracles into its sports gaming vertical could set new standards for how consumer-facing platforms leverage blockchain.
DaxPrime’s Conclusion
The decision by a senior BlackRock executive to join an Ethereum-native company like SharpLink Gaming is not a one-off anomaly. It reflects a rapidly maturing industry where the center of gravity is shifting from financial speculation to operational integration.
At DaxPrime, we continue to monitor executive movements as a leading indicator of sector confidence and capital rotation. As Ethereum evolves from “store of value” to “platform for value,” such strategic appointments signal where the smart money is going — and what the next phase of crypto utility will look like.
ETH | USDHello! This is my bearish scenario for ETH. If we get a weekly or monthly candle close below the red lines above, I’ll be expecting a downward phase toward the 1930 levels within 1–2 months. However, if we can close July above 3725, then my bullish outlook will remain intact.
CRYPTO:ETHUSD BINANCE:ETHUSDT BINANCE:ETHUSDT.P CRYPTOCAP:ETH.D BINANCE:ETHBTC CRYPTOCAP:ETH INDEX:ETHUSD BINANCE:ETHUSDT

ETH to $3700 Before a Major Bounce?Ethereum has been showing signs of exhaustion after its recent rally. I'm watching the $3700 level closely — it's a key support zone that has acted as both resistance and support in the past.
🟦 If ETH pulls back to this area, I expect it to find strong buying interest, potentially leading to a significant bounce and continuation of the bullish trend.
📌 Scenario I'm Watching:
🔻 Pullback to the $3700 support zone
📉 Shakeout or stop hunt below previous lows
💚 Followed by a strong bullish reversal — possible move toward $4000+
Why $3700?
Confluence of previous highs/lows
Psychological round number
Potential liquidity pocket
Not Financial Advice!
This is a scenario I'm tracking, not a guarantee. As always, wait for confirmation (e.g. bullish engulfing, RSI divergence, volume spike) before jumping in.
📉 If $3700 fails decisively, I'll reassess — next support likely around $3550–3600.

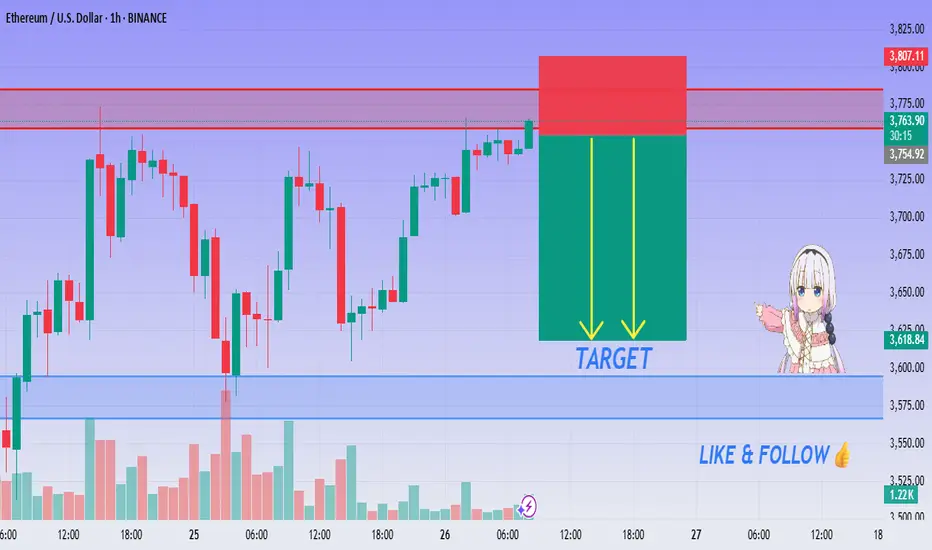
ETH/USD SHORT Setup - Supply Rejection Confirmed!🔴 ETH/USDT Supply Rejection ! SELL Setup Activated!
👨💻 Dear traders,
ETH/USDT is showing signs of rejection from a key supply zone near $3,775–$3,805 on the 1H chart. Price is stalling below resistance, hinting at a possible downside correction.
Bias – Bearish (Intraday Setup)
🎯 Target 1 – $3,715
🎯 Target 2 – $3,685
🎯 Final Target – $3,650
🛑 Stop Loss – $3,810
📊 Reasoning:
– Price tapped a clean resistance/supply zone
– Two yellow arrows signal projected downside pressure
– Strong rejection wicks and bearish candles forming
– Red zone shows ideal stop-loss area above supply
– Clean R:R setup for short-term sellers
– Momentum fading as buying pressure exhausts
⚠ Be patient. Wait for confirmation before entering short!
ETHUSD Will Go Down From Resistance! Sell!
Here is our detailed technical review for ETHUSD.
Time Frame: 1D
Current Trend: Bearish
Sentiment: Overbought (based on 7-period RSI)
Forecast: Bearish
The market is testing a major horizontal structure 3,641.87.
Taking into consideration the structure & trend analysis, I believe that the market will reach 2,871.15 level soon.
P.S
Overbought describes a period of time where there has been a significant and consistent upward move in price over a period of time without much pullback.
Disclosure: I am part of Trade Nation's Influencer program and receive a monthly fee for using their TradingView charts in my analysis.
Like and subscribe and comment my ideas if you enjoy them!

EthusdIt looks bearish.I think we would see another bearish impluse wave, after breaking (d) of a 🔺️ triangle.
If price goes up and passes (c) , the pattern is then canceled.

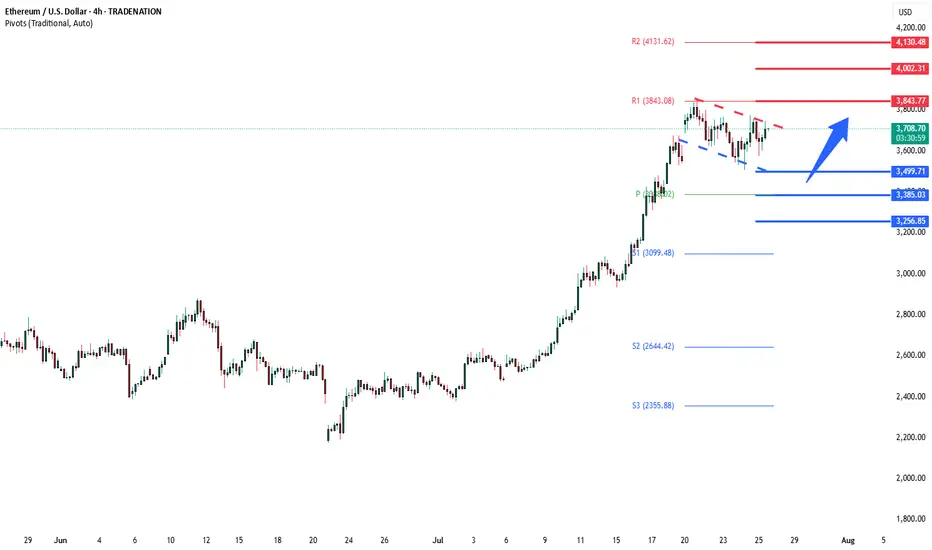
ETHUSD support at 3500The ETHUSD remains in a bullish trend, with recent price action showing signs of a corrective pullback within the broader uptrend.
Support Zone: 3500 – a key level from previous consolidation. Price is currently testing or approaching this level.
A bullish rebound from 3500 would confirm ongoing upside momentum, with potential targets at:
3842 – initial resistance
4000 – psychological and structural level
4130 – extended resistance on the longer-term chart
Bearish Scenario:
A confirmed break and daily close below 3500 would weaken the bullish outlook and suggest deeper downside risk toward:
3385 – minor support
3256 – stronger support and potential demand zone
Outlook:
Bullish bias remains intact while the ETHUSD holds above 3500. A sustained break below this level could shift momentum to the downside in the short term.
This communication is for informational purposes only and should not be viewed as any form of recommendation as to a particular course of action or as investment advice. It is not intended as an offer or solicitation for the purchase or sale of any financial instrument or as an official confirmation of any transaction. Opinions, estimates and assumptions expressed herein are made as of the date of this communication and are subject to change without notice. This communication has been prepared based upon information, including market prices, data and other information, believed to be reliable; however, Trade Nation does not warrant its completeness or accuracy. All market prices and market data contained in or attached to this communication are indicative and subject to change without notice.
ETHUSD Inverse Head Shoulder 4hrRather self explinatory . Potential Inverse Head & Shoulder 4hr and 1hr . Target approx. 4,014 USD

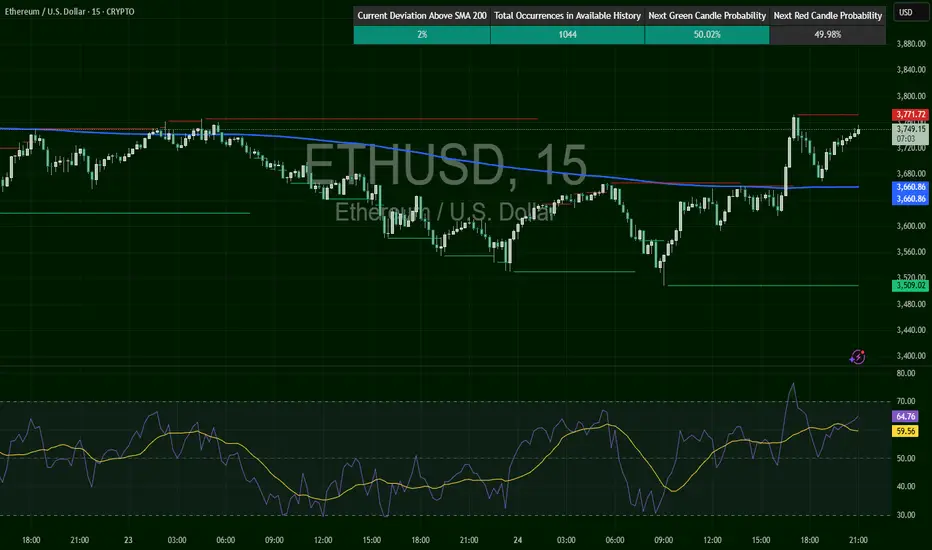
ETH on the 1H
After rejecting the 0.236 Fib level, price found support at the 200MA.
RSI cooled off slightly, giving room for another move before hitting overbought.
MACD just flipped bullish, pushing price higher.
MLR > SMA > BB Center — structure confirms upward momentum.
Now price is back at the Fib level.
It looks fresher than yesterday, but needs clean closes above to build traction for a real breakout.
We’ll be here watching.
Always take profits and manage risk.
Interaction is welcome.

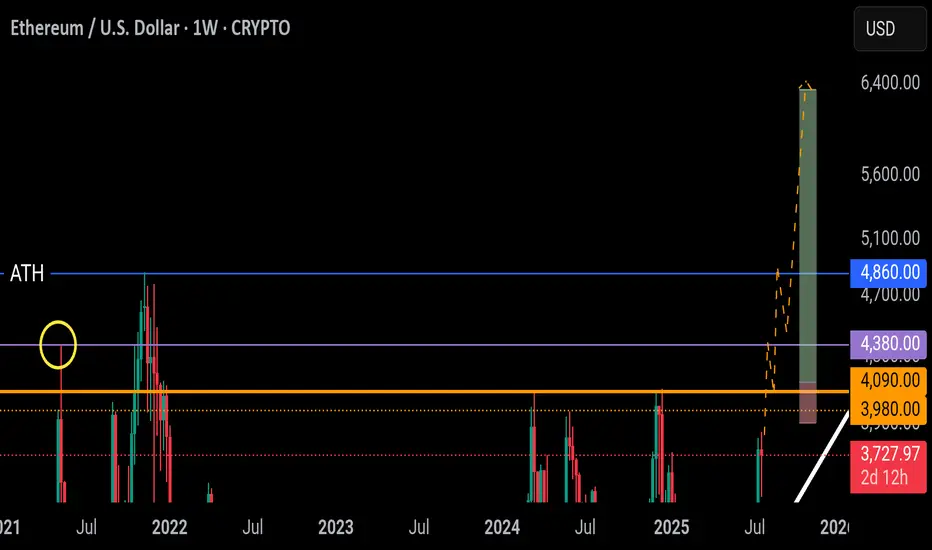
ETH key levels / fligh pathResistance zone @ 4,000 - 4,100
If Ethereum is able to break above this level the next price level likely to slow momentum / see a rejection is @ 4,400. A rejection from this price point could present a good long entry at the same Resistance zone @ 4k (flipping into support).
The ATH is likely to briefly act as resistance - saw a similar pattern with XRP/SOL/BNB/BTC - price does not naturally just "bust through" first time. Rejection/consolidation likely followed by a continued move into price/discovery.
Anticipate a new ATH to be printed toward the back end of Q4 📈
ETHUSD – From Breakdown to BreakoutETH reversed off a major demand near $3,510 and exploded past the 200 SMA into $3,747. Currently, price is resting just under resistance at $3,771, with RSI at 64.49 — strong and trending. If this resistance breaks, next leg up begins. If rejected, expect retest of $3,680–$3,700 range.
Ethereum short updateDon't be surprised to see some buying coming into play at the POI's highlighted below.
Hedging involves entering into a trade that is expected to perform in the opposite direction of an existing position, effectively protecting against potential losses.
ETHUSD – Breakout Confirmation & Premium Targeting🚀 ETHUSD – Breakout Confirmation & Premium Targeting (VolanX Protocol)
ETHUSD has broken out of its descending channel with a clean BOS (Break of Structure) and aggressive volume spike from the 3,620–3,650 demand zone. This breakout suggests a shift in order flow, with liquidity now being targeted toward premium levels.
Key Observations (1H SMC):
BOS: Clear bullish structure shift above 3,669 and 3,705 levels.
Volume Surge: Buyers stepped in aggressively near the equilibrium zone.
Liquidity Pools: Weak highs around 3,767 and 3,813 are prime targets.
Premium Zone: Between 3,767 – 3,875, marked as the next magnet zone.
Ultimate Target: 4,003 key level if momentum sustains.
VolanX Playbook:
Long Bias:
Entry Zone: 3,669–3,705 (retest of BOS level)
Targets:
3,767 (first liquidity grab)
3,813–3,875 (premium zone)
4,003+ if breakout trend extends
Invalidation:
Close below 3,621 = bullish scenario voided, revert to discount pricing.
VolanX Signal:
This breakout suggests institutional order flow absorption and rotation toward high-value zones. Monitor retests for long entries and manage risk under 3,621.
#ETH #ETHUSD #VolanX #SMC #CryptoTrading #Liquidity #OrderFlow #PriceAction #TradingView #AlphaSignals

ETH/USD: Watching the levels. It broke out of the downtrend and its going up, I think the momentum has just begun, Let's see where we go this time. Big time fan of ETH so excited!

ETH 1H — Decision Point Ahead
ETH just confirmed a bullish RSI divergence, with price finding support at the 200MA.
MACD supports the move, and the trend structure is clean: MLR > SMA > BB Center.
Now, price is hovering at the 0.236 Fib level.
A few strong closes above it could open the door for more upside.
If rejected, we might revisit the 200MA for another test.
Either way — we’ll find out soon.
Always take profits and manage risk.
Interaction is welcome.

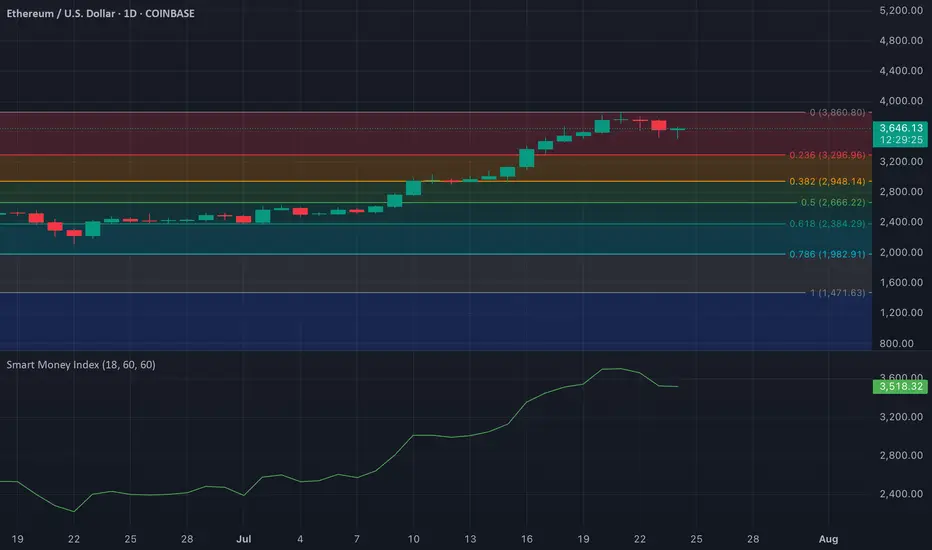
ETH/USD: Smart Money Index Signals Distribution Post-RallyOn the ETH/USD daily chart, a notable drop in the Smart Money Index (SMI) is confirming bearish sentiment among key market players. Since July 20, the SMI has declined by 7%, signaling increased selling activity from institutional investors and seasoned traders—often referred to as "smart money."
The SMI works by contrasting intraday trading behavior: it gauges retail-driven morning trades against institutional-dominated afternoon moves. A falling SMI, like the one seen on Ethereum, suggests that smart money is quietly exiting positions. In this case, it points to profit-taking after ETH’s recent price rally, reinforcing the idea that the current pullback may be more than just noise. Traders should monitor further declines in the SMI as a sign of continued distribution.
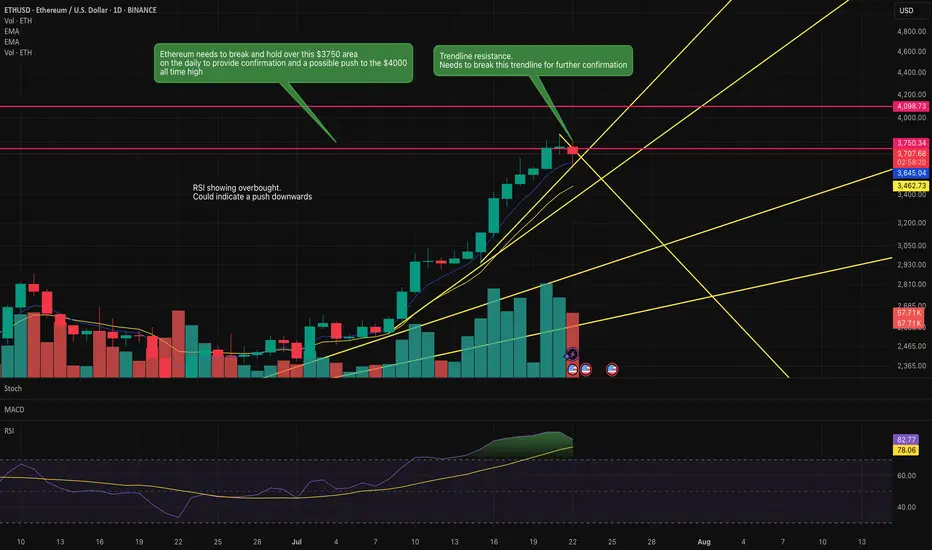
Is Ethereum going to push above this key resistance?Ethereum is knowcking against this key resistance area.
If it pushes above this $3750 area then it has a clear run to the previous all time highs of $4000.
RSI indicates overbought so it could indicate a reversal to the downside.
Key trendline is being honoured currently. However, a break of this trendline may indicate the move upwards to the previous all time high.
Watch this space over the next couple of days.
Ethereum Bullish Rally IncomingIf Ethereum can break above that point and clear $2,840, this level will turn into a major support, where fresh supply waits. However, a drop below the 200-EMA could lead the price to retest $2,400. A break below this level would shift momentum negative and risk a slide toward the April low near $1,500.
Read More at: www.cointrust.com

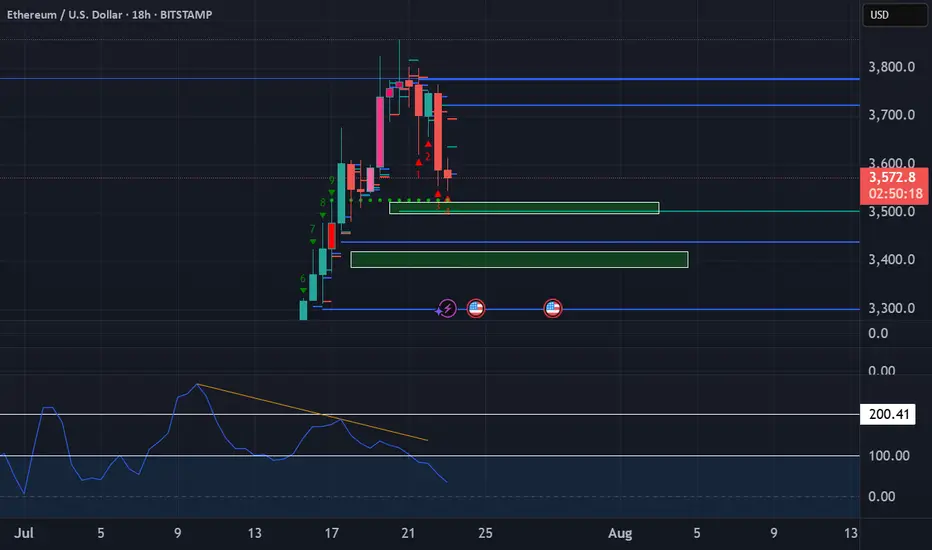
ETHUSD - Decision TimeWhat do make of the current situation?
What if you are long?
Here's what to expect:
a) support at the U-MLH, further advancing up to the WL
b) open & close within the Fork. If so, there's a 95% Chance of price dumping down to the Centerline.
Taking 50% off the table is never bad.
50% money in the pocket if price falls down to the Centerline.
Or if it advances up to the WL, you still have 50% that generates profits.
Either way, you have a winner on your hands.
Don't let it dig into a Looser!

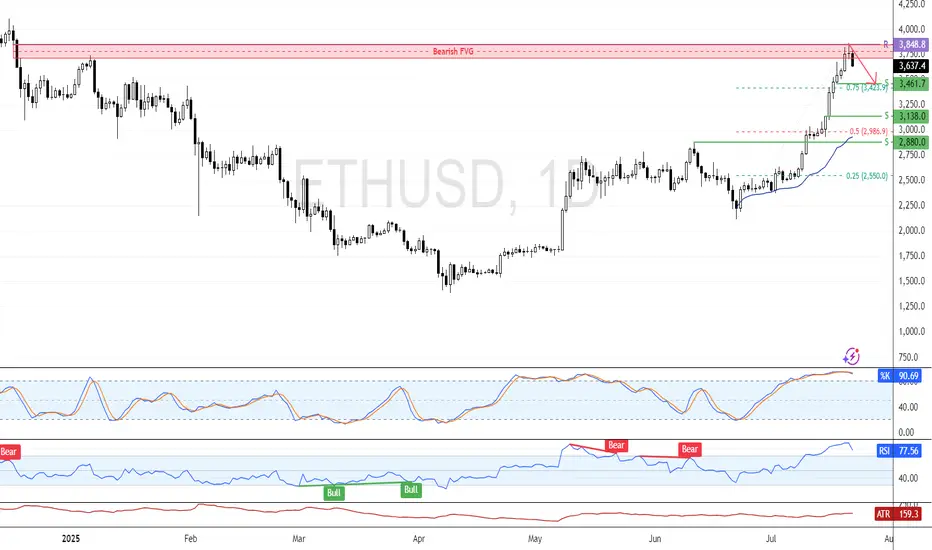
ETH Eyes Consolidation from Overbought ZoneFenzoFx—Ethereum pulled back from the daily bearish FVG. The recent candle closed with a long wick and flat body, reflecting market uncertainty. Momentum indicators remain in overbought territory, signaling a possible consolidation phase.
If resistance at $3,848.0 holds, the price may decline toward support at $3,461. However, the bullish outlook stays valid as long as ETH/USD holds above $3,848.0.
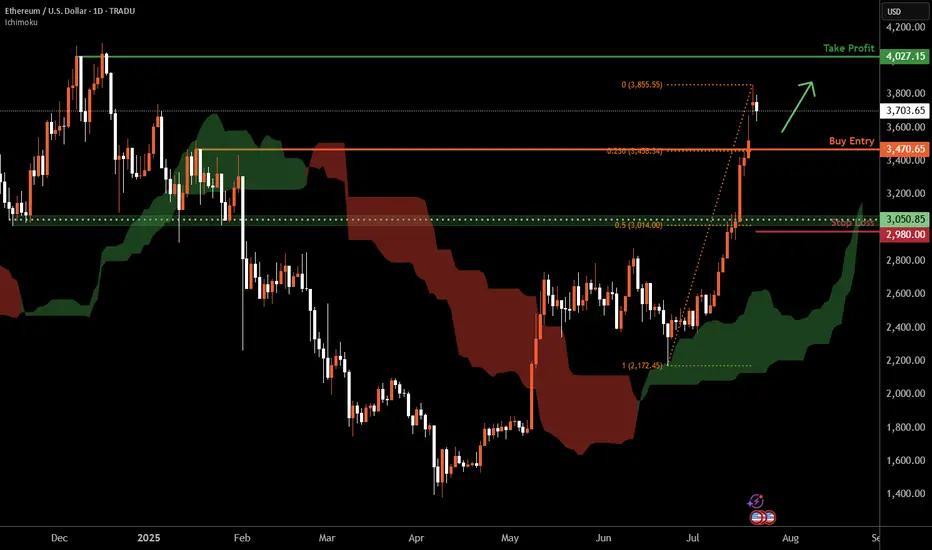
Ethereum D1 | Potential bullish bounceEthereum (ETH/USD) is falling towards a pullback support and could potentially bounce off this level to climb higher.
Buy entry is at 3,470.65 which is a pullback support that aligns with the 23.6% Fibonacci retracement.
Stop loss is at 2,980.00 which is a level that lies underneath a a pullback support and the 50% Fibonacci retracement.
Take profit is at 4,027.15 which is a multi-swing-high resistance.
High Risk Investment Warning
Trading Forex/CFDs on margin carries a high level of risk and may not be suitable for all investors. Leverage can work against you.
Stratos Markets Limited (tradu.com ):
CFDs are complex instruments and come with a high risk of losing money rapidly due to leverage. 66% of retail investor accounts lose money when trading CFDs with this provider. You should consider whether you understand how CFDs work and whether you can afford to take the high risk of losing your money.
Stratos Europe Ltd (tradu.com ):
CFDs are complex instruments and come with a high risk of losing money rapidly due to leverage. 66% of retail investor accounts lose money when trading CFDs with this provider. You should consider whether you understand how CFDs work and whether you can afford to take the high risk of losing your money.
Stratos Global LLC (tradu.com ):
Losses can exceed deposits.
Please be advised that the information presented on TradingView is provided to Tradu (‘Company’, ‘we’) by a third-party provider (‘TFA Global Pte Ltd’). Please be reminded that you are solely responsible for the trading decisions on your account. There is a very high degree of risk involved in trading. Any information and/or content is intended entirely for research, educational and informational purposes only and does not constitute investment or consultation advice or investment strategy. The information is not tailored to the investment needs of any specific person and therefore does not involve a consideration of any of the investment objectives, financial situation or needs of any viewer that may receive it. Kindly also note that past performance is not a reliable indicator of future results. Actual results may differ materially from those anticipated in forward-looking or past performance statements. We assume no liability as to the accuracy or completeness of any of the information and/or content provided herein and the Company cannot be held responsible for any omission, mistake nor for any loss or damage including without limitation to any loss of profit which may arise from reliance on any information supplied by TFA Global Pte Ltd.
The speaker(s) is neither an employee, agent nor representative of Tradu and is therefore acting independently. The opinions given are their own, constitute general market commentary, and do not constitute the opinion or advice of Tradu or any form of personal or investment advice. Tradu neither endorses nor guarantees offerings of third-party speakers, nor is Tradu responsible for the content, veracity or opinions of third-party speakers, presenters or participants.