Ethereum at Crucial Resistance – Will the Bulls Hold or Fade?Ethereum at Crucial Resistance – Will the Bulls Hold or Fade?”
Ethereum is currently trading near a key resistance zone around $3,800, as marked on the chart. After a strong bullish rally with clear Break of Structures (BOS) along the way, ETH has now reached an extended point where price may face selling pressure.
The Bollinger Bands are stretched, showing overextension, and the marked arrow suggests a possible correction or pullback from this level. A retest of previous support zones (~$3,400–$3,200) could be expected if the resistance holds.
⸻
Key Levels:
• 🔼 Resistance: ~$3,800
• 🔽 Support: ~$3,400 / ~$3,000
• 🔄 Price Action: Watching for rejection or breakout confirmation
This is a textbook case of price approaching a strong resistance level after a bullish wave, where caution and confirmation are key for the next move.
ETHUSD trade ideas

ETHUSD-SELL strategy 12 hourly chart REG CHANNELAs always crypto movements are severe, and one can never judge the corrective timings. Overall the view remains the same, and when carefully scaling in, is always warrented and proper risk management strategies.
Strategy SELL @ $ 3,675-3,750 area and take profit @ $ 3,175 area. On previous shorts if applicable, scale down slowly.

ETH Season?Well, in all of its history Ethereum’s recent lows remind me the most of December 2019 while the recovery after reminds me the most of the bull rally after March 2020. Either way I think the time for ETH and crypto as a whole is very near. Here’s my charted roadmap. If BTC hit a new high and then some over a whole year already since it hit a new high, then how do we not expect ETH to do the same and probably amplified as well as certain alt coins too. Curious to see how this thesis plays out. Not financial advice

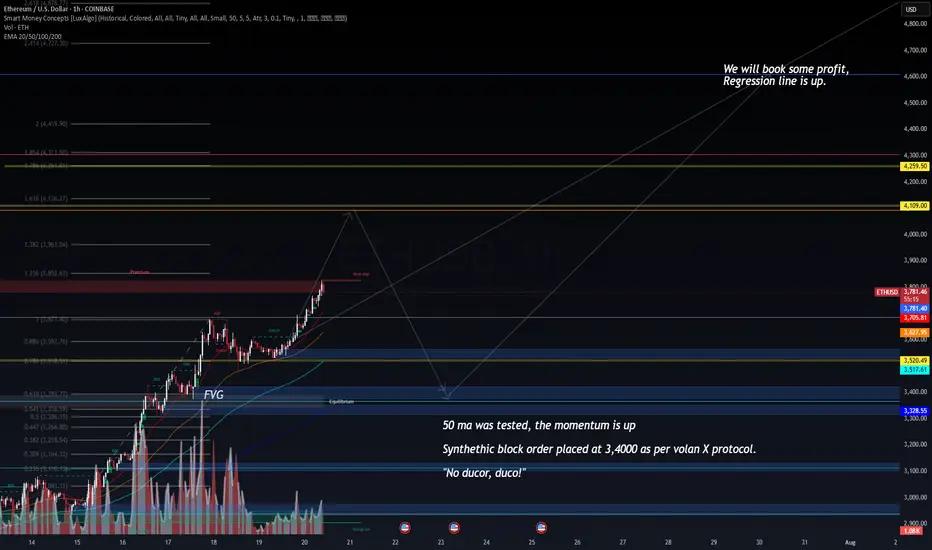
ETHUSD – Deploying Synthetic Capital as per VolanX Protocol📈 ETHUSD – Deploying Synthetic Capital as per VolanX Protocol
1H Chart | July 20, 2025
"No ducor, duco!"
(“I am not led, I lead.”)
🧠 Market Context:
Price is holding above the 50 MA, confirming upward momentum. Liquidity has been taken from prior internal highs, and price continues pushing into the premium zone above the 1.0 Fibonacci level.
🔧 VolanX Protocol Deployment Update:
✔️ Synthetic Block Order: Placed at $3,400, with precision according to Volan X synthetic injection model.
✔️ Regression Line: Sloping upward – momentum remains in favor of bulls.
✔️ Weak High Targeted: $3,850 zone approached with clear aggression.
✔️ Volume Uptick: Observed near FVG and mitigation zones – ideal for synthetic deployment timing.
📍 Key Zones:
🚩 Block Order Zone: $3,400
🎯 First Profit Target: $3,852 – $3,961 (Premium zone)
🟡 Ultimate Target: $4,259 – $4,419
🔵 Equilibrium Support: $3,328
💬 Narrative:
"We will book some profit, Regression line is up."
Price is behaving according to expectations. The 50 MA retest confirms the continuation bias, and we now monitor for the next volatility compression before expansion. Expect smart money to aim for the inefficiencies left near the $4,100–$4,250 level.
📊 Deployment Signal: LIVE
🧬 VolanX Engine: Active
📍 Next Review: Upon 1.382 fib reaction or volatility compression
#ETHUSD #VolanX #SyntheticCapital #SmartMoney #MomentumTrading #TradingStrategy #FVG #PriceAction #CryptoAnalysis

ETH is up about 50% Since June 2025Relying on the absolute intraday low from June to claim that ETH is “up 70%” is a textbook data‑skewing mistake often found in AI‑generated headlines. A more robust approach is to average prices over several days (or even a full week). On that basis, ETH has risen roughly 50% since June— not 70%. Don’t let a distorted headline push you into adding leverage through perpetuals just because your strategy’s returns lag spot performance; that reaction only compounds impermanent‑loss risk.

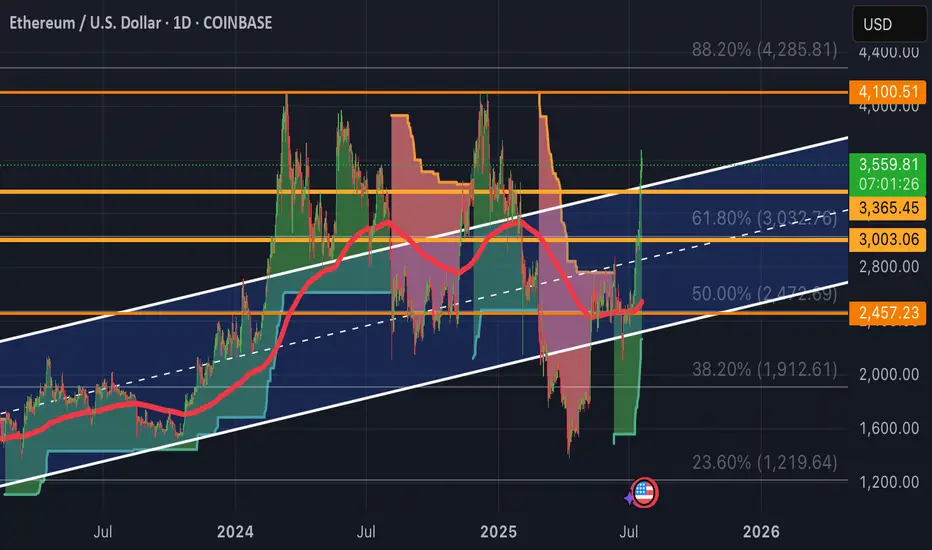
Inspired my Benjamin CowenWhilst this is also high speculation and to not be used to predict the market, using Benjamin Cowen's idea of using the SPX Index's 1990's timeframes and extending them to match the potential ETHUSD cycle.
You'll see how the early parts to the moves are near 1/1 of each other. Looking into the future, you'll also see that the SPX's moves interact with the middle part of the channel multiple times, and begins to decline in the potential bear market (yellow dashing lines). This also looks pretty convincing. Charts are so fascinating.

the Inverse Golden BullrunJust a joke maybe but here some considerations...
each peak is reached in 1/0.606 * previous cycle length, which is oddly close to the inverse of the golden ratio. The Q1 peak in 2024 seems to have occurred oddly in advance.
Resistance of bear markets can be found at a common focal points and all have an angle of approx 20° on the linear scale.
this inverse golden bullrun will produce a very turbolent market with a new local top in 2025. This seems reasonable considering the whole global situation, crypto narrative, oversaturation and how we got rejection before breaking the past ATH.
the overall superstructure could break out or be confirmed after next "inverse golden bullrun"
oddly again, should the breakout occurr, it would happen around 1/3rd of the triangle, which is typical for those structures.
overall, not bullish nor bearish, don't hate.
most certainly mostly wrong ;)
not a financial advice, just for fun.

8 straight days of green candles for Ethereum. This 8 days long rally for Ethereum is bound to see a retracement. I've taken some profits and am sitting on the side to see that dip before redeploying my capital.

+4K Incoming FastI think ETH just melts up from here to ~4100 short term high. We're seeing inflows into the ETH ETFs that are larger than the BTC ETF inflows now.
ETH on the 1H timeframe
Indicators are showing slight weakness:
MLR < SMA < BB Center
Price is trading below the 50MA
RSI is under the midpoint, and green volume is fading
This could just be a pause before the next leg up
but I’m curious whether the last high of $3,678.86 was this week’s top,
or if price will try to break it tomorrow.
Always take profits and manage risk.
Interaction is welcome.

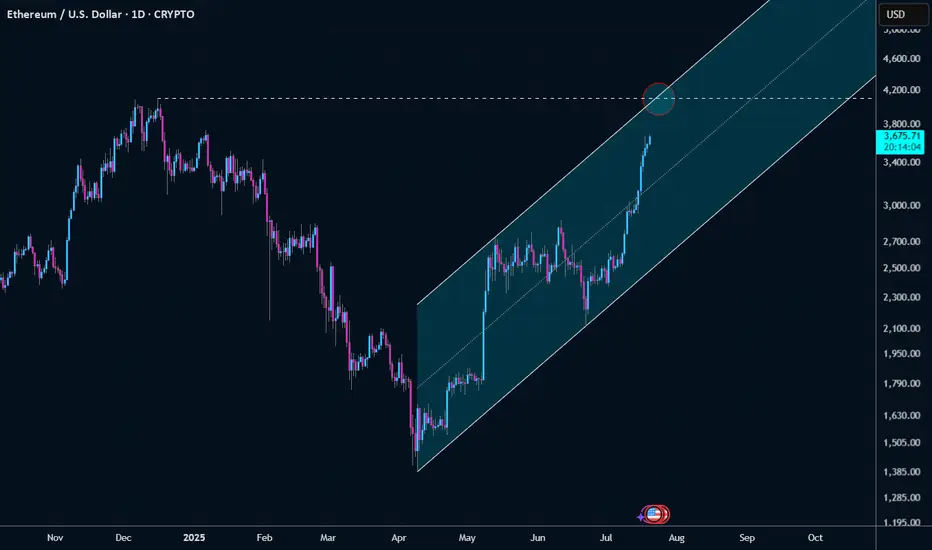
ETH-Update from February post at $2700, $3300 target hitTook some time after the big dip down to $1500 in April to get back into the ascending macro parallel price channel to eventually hit our goal of $3300.
Totally worth the wait.
ETH 1.0It is important not only to sell on time, but also not to return money to the market when it seems like the best opportunity to make money...

*ETH 4H — Charging the 0.236 @3700$ETH on the 4H is getting ready to charge the 0.236 Fib level.
MLR > SMA > BB Center — momentum is aligned.
Volume confirms the move.
Even though I don't enjoy it — and last time I sold just a part of the position too soon —
I placed a partial TP again. It needs to be done. The market can always turn.
We’ll be here to see it unfold.
Always take profits and manage risk.
Interaction is welcome.

As you can imagine on this day... the trade is validated. and I'As you can imagine on this day... the trade is validated. and I'm OUT OUT OUT

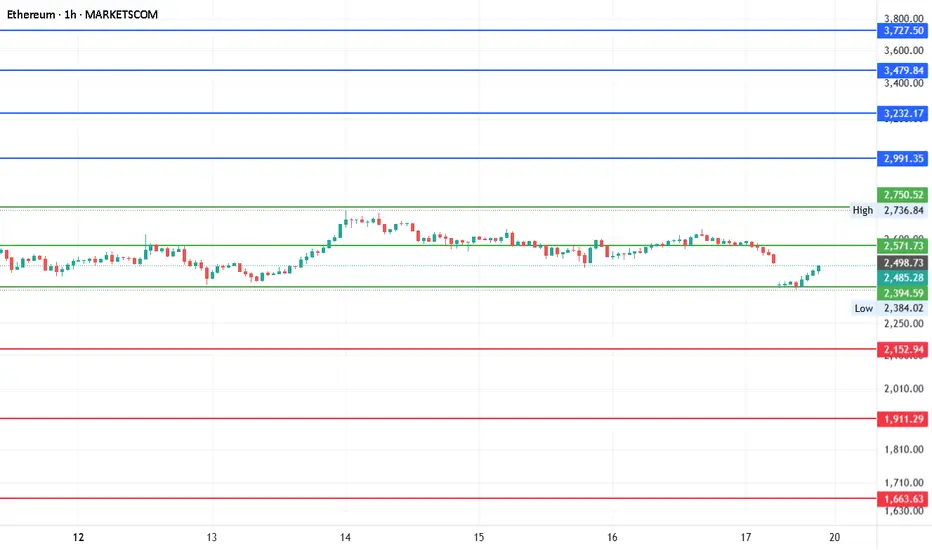
#ETHEREUM - 900 POINTS MOVE ON THE RADARDate: 19-05-2025
#ETHEREUM - The last time we posted an update on this scrip was on 24th April. In fact, we did have had a run-up for about 900+ points move and we are expecting the same this time around also. I am making it very clear that the number of points it can move but not a direction. The chart says so.
Current Price: $2469
Mid-Point: $2571.73
Upside Targets: $2991.35, $3232.17, $3479.84 and $3727.50
Downside Targets: $2152.94, $1911.29, $1663.63 and $1415.96
Support: $2394.59
Resistance: $2750.52
ETHUSDETH USD Conditional trade// High risk
Possible Head and shoulder in making
Wait for neck to break
Look for retest and bearish candle
then enter otherwise invalid

ETHUSD - ANOTHER GROWING WEEK
ETHUSD - ANOTHER GROWING WEEK✅
ETHUSD has been growing all these days together with a bitcoin. All the news, listed in my previous post for the BTCUSD are also valuable here. Really nice fundamental support, people are purchasing the asset.
But what's with technicals? 📊
Compared to the bitcoin, ETHUSD hasn't reached ATH. According to a daily chart (pic 1), the price has been moving sideways since 2021 and a strong resistance is waiting ahead at 4,000.00. However, for now we are good. I bet that during upcoming days the asset will reach this level and rebound from it. Will it break the resistance? I think it is too early to make any conclusions.

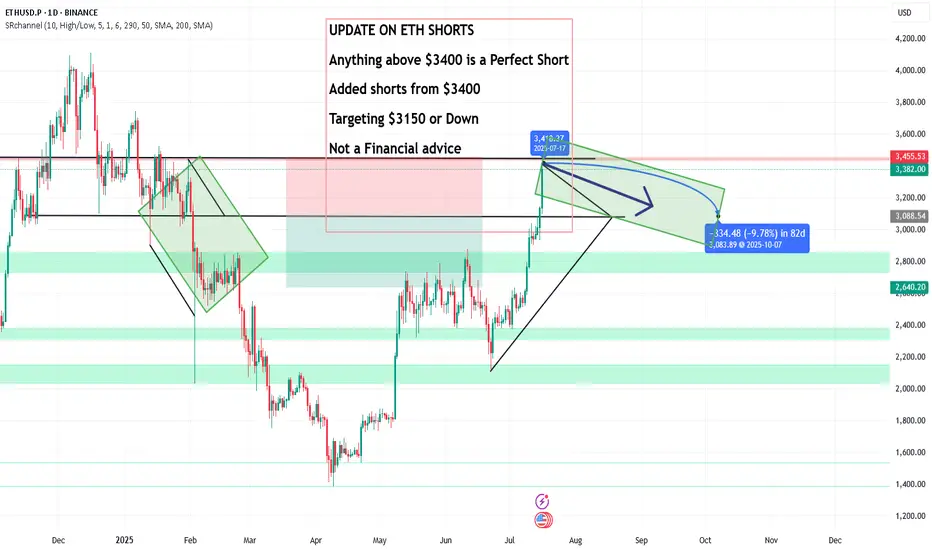
UPDATE ON ETH SHORTS, Anything above $3400 is a Perfect ShortUPDATE ON ETH SHORTS
Anything above $3400 is a Perfect Short
Added shorts from $3400
Targeting $3150 or Down
Not a Financial advice
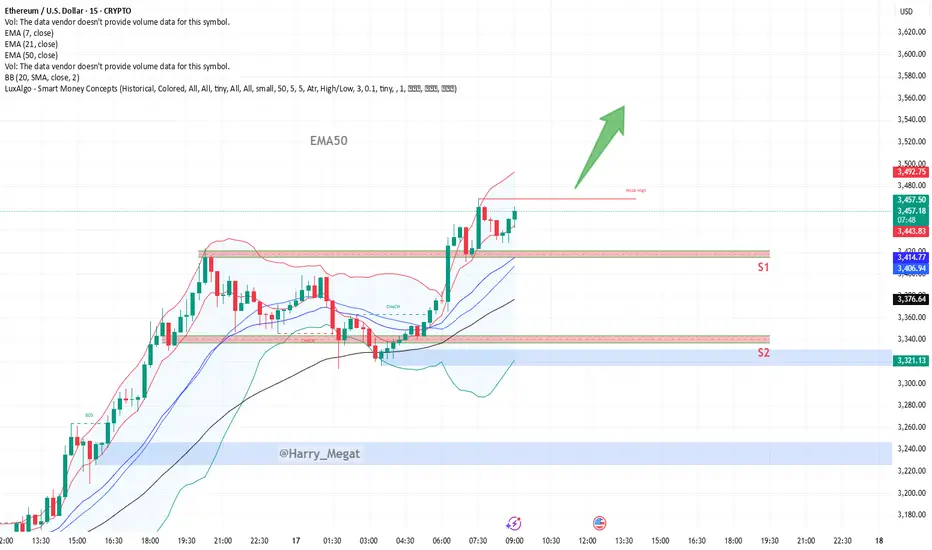
Technical **chart analysis** for ETH/USDTechnical **chart analysis** for **ETH/USD** based on (15-min timeframe) :
Bullish Outlook**
* **Price Action**: Ethereum is consolidating just above previous resistance (\~\$3,440) after a breakout from the range.
* **Current Price**: \~\$3,446
* **EMA Support**:
* EMA 7: \$3,441 (price holding above)
* EMA 21: \$3,413
* EMA 50: \$3,376 (strong dynamic support)
Key Levels**
* **Resistance Broken**: Former resistance zone (\~\$3,415–\$3,440) now acting as support.
* **S1 Support Zone**: \$3,415–\$3,440 (ideal retest zone for long entries)
* **S2 Support Zone**: \$3,335–\$3,350 (next demand zone if S1 fails)
Analysis Summary**
* **Trend**: Bullish momentum is intact above EMA cluster.
* **Setup**: Retest of breakout zone successful → price stabilizing above EMA7.
* **Target Area**: If momentum continues, next target zone could be \$3,500–\$3,560 (as shown by green arrow).
* **Invalidation**: Drop below \$3,413 (EMA21) and especially \$3,376 (EMA50) would weaken the bullish structure.
Ethereum (ETH) – Strategic Trade PlanEthereum (ETH) continues to show resilience, currently trading around $1,790 after a strong bounce earlier this month. While the crypto market remains volatile, ETH is holding key technical levels that could fuel a major move in the coming weeks.
🎯 Entry Points:
Market Price: $1,790 — Ideal for an early position, as ETH holds above critical support zones.
$1,645 — Secondary strong support, aligning with the 20-day EMA; great for scaling in if market pulls back.
$1,400 — Deep value zone, offering a high-risk/high-reward setup if broader market correction occurs.
💰 Profit Targets:
$2,500 — First major resistance. A realistic mid-term target if bullish momentum sustains.
$3,000 — Psychological milestone and breakout confirmation level.
$3,800+ — Ambitious but achievable with broader crypto market recovery and strong ETH network metrics.
🛡️ Risk Management:
Set stop-losses dynamically below each entry support level.
Scale into positions progressively to manage volatility.
Monitor macroeconomic trends and Bitcoin's influence closely.
🔍 Key Observations:
Strong on-chain activity supports a bullish thesis.
Current resistance around $1,812 must be broken to confirm bullish continuation.
Be cautious of sudden market-wide corrections — always plan your exits and manage your risk accordingly.
📢 Disclaimer: This is not financial advice. Trading cryptocurrencies involves significant risk, and you should only invest what you can afford to lose. Always perform your own research before entering any position.

eth,long trend is comingmaybe last from 2025 to 2026
key points:4000,4800
Big big guess, value around $1 trillion, price near $8000

ETH - UpdateETH has been "crashing" lately but I think it is in the end state of a long rally. In fact I think we are in the last stage of Wyckoff distribution and we could see a major rally soon. Looking at the 300 SMA we bottomed there in June 22 and if we hold there, it could be the spring board for a massive rally to new highs.
Also I think GLD will top in a week or so which will be good for BTC and ALTS.
Not investment advice. Please like and share and leave a comment.
