Short ETHJust MY opinion But there is nothing healty in the market now....
institutions are building short positions.
Lets first Hit the 1200$ eth.
ETHUSDC trade ideas

Ethereum to $2k** swing trade opportunity - trade only **
Ethereum is in a bear market, however there will be bear market rallies from time to time. This is now the expectation.
On the above 2-day chart price action has corrected 80% after a 5000% rally from the 2020 March lows. Now is an excellent long trade moment. Why?
1) The ‘incredible buy’ signal prints.
2) Regular bullish divergence. Seven oscillators are currently printing bullish divergence with price action.
3) Broken RSI resistance.
4) Everything that was said above is also true for the ETH/BTC pair.
5) Price action is testing the 0.382 Fibonacci level. Ethereum loves this level, history shows that time and time again.
Is it possible price action falls further? For sure. People are petrified. Retail traders can't sell fast enough in patient hands.
Is it probable? No.
Ww
Type: trade
Risk: <=6% of portfolio
Timeframe: 1 - 2 months
Return: 2x
2-day ETH/BTC pair

ETH measured move = DoomPut your tinfoil hats on for this one folks.
I felt compelled to post this (yes, my first on TV) after running across this.
Ethereum is currently in another bear flag, as is BTC.
If we consider a measured move from the last pattern we can see that it would end up at around $200. Now granted that's a pretty horrific move from here.
The sheer coincidence is when I put that into a log scale. Seeing this line up with the lower trendline gave me shivers.
We know that the crypto market is in turmoil right now with the 3AC, Voyager, Luna debacles etc.. And then there is the global macro on top of that. So anything is possible, as is the usual saying anyways with crypto.
What do you think about this?

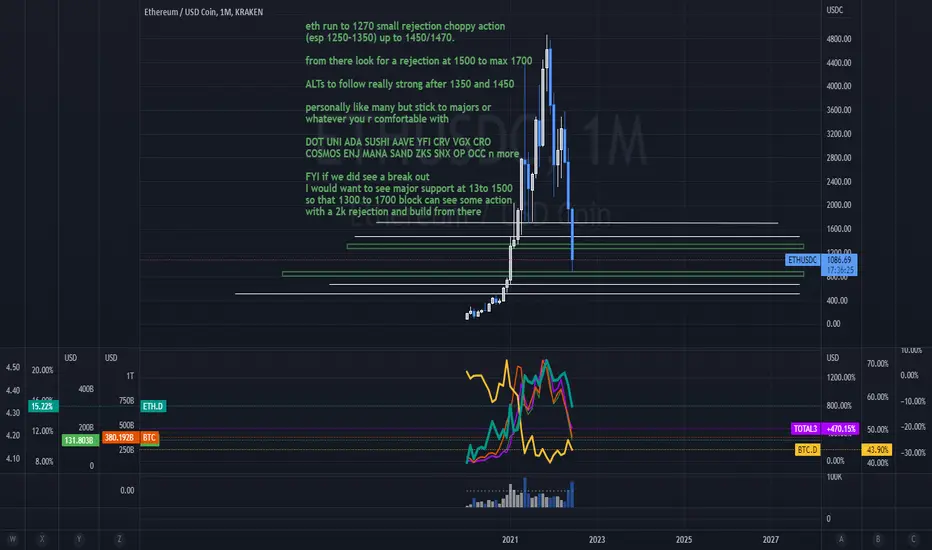
start your engines. look 4 pump after dump hereeth run to 1270 small rejection choppy action
(esp 1250-1350) up to 1450/1470.
from there look for a rejection at 1500 to max 1700
ALTs to follow really strong after 1350 and 1450
personally like many but stick to majors or
whatever you r comfortable with
DOT UNI ADA SUSHI AAVE YFI CRV VGX CRO
COSMOS ENJ MANA SAND ZKS SNX OP OCC n more
FYI if we did see a break out
I would want to see major support at 1300 to 1500
so that 1300 to 1700 block can see some action
with a 2k rejection and build from there to 3k etc.
whats more likely is a cold savage rejection at 1700 ish as blood pours in the streets and what left of ALT market dies. in that scenario stink bids on eth from 870 to hi 400s maybe 500s
(ie buy orders at 900 to 600) if you do see some alt action here just look to move quickly and dont get stuck holding the bag. profits will be spectacular but this middle lane not bear or bull gets tricky so try to not spread to thin and keep as much dry powder in stable coin etc you can mentally handle. like TraderMayne always says "I would rather show up to the rite party late then the wrong one early" HMG out ya all
Double top in ETH on hourly scaleDouble top forming in ETH, stull a litle continuation needed for complete pattern

12 !! TWELVE WEEKS OF UNINTERRUPTED FALL OF ETH. IT GOES FOR 13 It feels like only Yesterday we predicted that ETHEREUM FALL FOR 12 ! TWELVE CONSECUTIVE WEEKS.
IT TOOK ETHEREUM JUST A SINGLE DAY ! TO FULFILL THAT ANALYSIS OF FURTHER FALL OF ETH PRICE - PERFECTLY.
Registering for the trade history that our analysis was correct - we now predict that
The fall of Ethereum WILL continue uninterrupted for THIRTEEN 13! WEEKS.

ETHEREUM WILL FALL FOR 12 WEEKS TOO.EVERYTHING IS IN THE CHART.
The volume continues its Unabated rise,
while ETH continues its UNabated FALL FOR 11 consecutive weeks.
Think about it - ELEVEN WEEKS OF STRONG FALL.
Plus
RISING VOLUME
IT WILL FALL NEXT WEEK TOO.

SHOOTINGSTAR CANDLE IS GOOD WAY TO SHORT ETH. JAPANESE homageWell, high tide followed by low tide, followed by high tide...
The market always in motion - it is , as Japanese say 'A floating world'
A pin-bar top candle is aptly named Shooting Star in Japanese candle formations.
As we owe the invention of candles themselves to the Japanese, and specifically the shooting star, it brings Japanese ideas of the world.
Such as the EPHEMERAL state of everything , including prices.
Beautiful art.
The term Ukio-e translates as "picture of the floating world".
en.wikipedia.org
Be flexible the way of the water
u

CLEAR ETH SHORT TO 889 $ = NEXT SUPPORT, ETHEREUM BACK TO BASISThe week is still young and ETHUSD has FALLEN -20 % IN THREE DAYS
to about a 3 Year average.
Now the NEXT SUPPORT LEVEL IS AT 889 $
(though quite a flimsy support at that)
Which is a rather conservative - 40% for the next 30 DAYS
One got to give some respect to the current rate of -20 % in just THREE days
(Check out my previous BACK TO BASICS a few days ago)


ETH Upwards Movement? Building shorts at high,
three green candles suspicious.
One last attempt at 50EMA to
make believe that it's the new
resistance and won't go higher.
Next candle drops to convince
retail to go shorter, MM takes
advantage and brings price up.

ETH long
Breakout already confirmed
Open long 2833.9
Stop 2719.5
Layer out on the way up
Final target 3199.2
Trade well friends!!

Crypto Over View of Alts ADA SAND XRP and OthersFeel free to come into my streams and ask my opinion on anything with a chart and to share your ideas. Most of the alt pairs I look at are from viewers suggestions. I obviously do not trade the ~140 cryptos I have in my list, but it isn't a lot of work to keep tabs on things and go through them.
I stream Weekdays on TV
9:20 EST
1:20 EST
Sundays on TV
6:20 EST
EST = UTC-5
Take care and stay healthy y'all.

ETH Trend LineThis trendline on ETH played out pretty well. Would've been a good long if I got in on it, sadly didn't since I'm in class.

ETH Will Crash to $730 by the End of the YearETH is bonded to BTC. BTC has painted a crash pattern. An 85% correction is in the Almanac for both of these assets. Smart money will dump these two assets into HEX for trustless yield during this bear market.

Thoughts on ETH - upward channels and downward channelEth seems to be traveling in 2 opposing channels. A narrow upwards channel, and we might be forming a wider downward channel. The channels provide good support (entry) and resistance exit areas. We are currently in the upper half of the downward channel and the longer we stay there, the higher the probability to break out of it.
The yellow arrow shows just one potential scenario that I think has a fairly high probability.

ETH to go into the $5200 realm ... Listening to other analysis and looking at the world as a whole Eth is set to rise is my understanding and extrapolating and averages leads towards my projection.
I am new to this, but lets see.


hex ethhex has been steadily going up for a while now. Hex founder said that many were expecting rug pull, but he may be giving a magic carpet ride

ETH Rose 10% in the past 36 hoursETH is rose nearly 10% in the past 36 hours. The bullish momentum might expand further TARGET $4000 in September.

Where is Eth just now?200, 100 and 50 Week MA. 4 hour chart, What are your thoughts?, where is Eth going?


One More Dump! With A Very Bullish Aftermath! Many Analysis like this have been done so I will save you the long story. On the 4hour chart a bullish upside down head and shoulders can be seen forming. However, with a bearish head and shoulders forming on a one hour chart, the possibly of the price touching the lower support before recovering seams likely.
As always be patient and see how it plays out.
