ETH Net Position points to up pricingETH net shorts positions are at the lowest point in the historical range. This reduces constraints on pricing and you can also see that the shorts are being closed as the pricing moves up. This clears the way for ETH price to move up significantly before bears start reacting again. Everything is poi
Key data points
Previous close
—
Open
—
Day's range
—

ETHUSDLONGSETHUSDLONGS
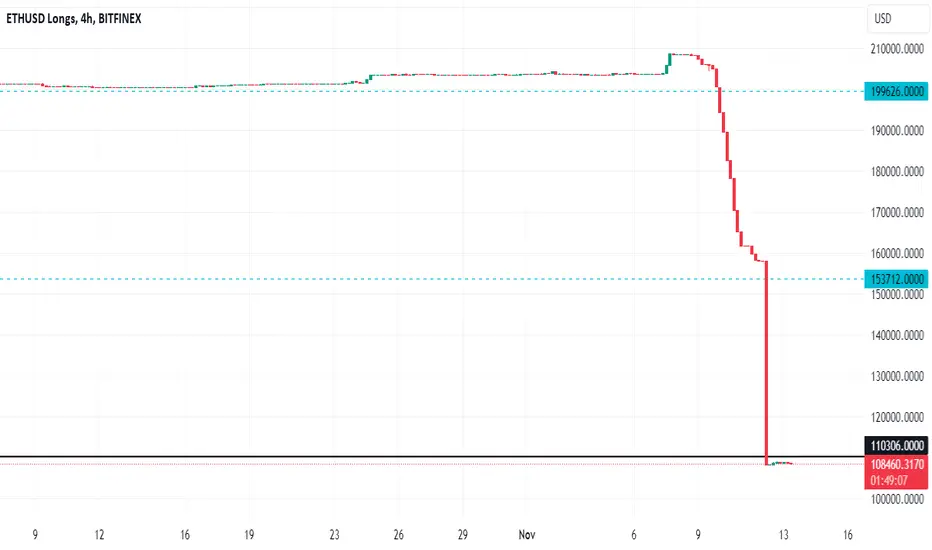
On the chart, there was a sharp collapse in ETH longs. This is a likely signal for a subsequent correction of the coin.
But this does not mean at all that the collapse will happen tomorrow or within a week. Perhaps the correction will follow only after six months.
If there is an updat
ETHUSDLONGSETHUSDLONGS
Thoughts
At the moment, we are seeing a new surge of interest in ETH long positions from traders. This growth is extremely interesting, because the last time such "green" sentiment was observed at the beginning of 2023, after which we saw a strong drop and subsequent consolidation almos

ETH's canary in the coal mineThe ETH long to short ratio can tell us a lot about positions in the market and the corresponding impact on price. When this ratio is over .5 start to worry. When it moves into the high water mark, it is time to start closing longs and building shorts. This is a long term perspective and not for sho


ETHUSDLONGS are buying again wait for the bottom... in 40 daysNot that we are at the bottom yet, but whales are beginning to accumulate. I believe there will be more downside over the next few weeks. but when this is up 32% already today, somebody sees this as a buying opportunity.
notice the pattern, 2 large buying days plus 40 days from the first large purc

ETHUSDLONGS have closed positions, Divergence signals reversalNotice the ETHUSDLONGS vs ETHUSD
When the longs close their positions rapidly, this has indicated the local top is completed.
And as you can see the longs have rapidly closed. Prepare for a local top in ETH.
Good Luck

ETH USDT LONG TERM PERSPECTIVEAccording to Elliot wave theory eth had completed its ABC corrective waves and now we are in impulsive wave 1. 2nd wave will be corrective wave so be ready guys for short targets.

Longs Being LiquidatedA lot of people are liquidating their longs going in to the weekend. I can see us falling through Sunday

ETH Q2-Q3 2022Publishing my outlook on Ethereum for the next month or two. If I had to guess, this does another fake out short-term before both equities + crypto go through their capitulation stage.
Expecting ETH to reach the 440-530 range before it's starts a true accumulation range.
Note : all lines draw

See all ideas
Summarizing what the indicators are suggesting.
Oscillators
Neutral
SellBuy
Strong sellStrong buy
Strong sellSellNeutralBuyStrong buy
Oscillators
Neutral
SellBuy
Strong sellStrong buy
Strong sellSellNeutralBuyStrong buy
Summary
Neutral
SellBuy
Strong sellStrong buy
Strong sellSellNeutralBuyStrong buy
Summary
Neutral
SellBuy
Strong sellStrong buy
Strong sellSellNeutralBuyStrong buy
Summary
Neutral
SellBuy
Strong sellStrong buy
Strong sellSellNeutralBuyStrong buy
Moving Averages
Neutral
SellBuy
Strong sellStrong buy
Strong sellSellNeutralBuyStrong buy
Moving Averages
Neutral
SellBuy
Strong sellStrong buy
Strong sellSellNeutralBuyStrong buy
Displays a symbol's price movements over previous years to identify recurring trends.