Sunday, 6 July 2025 - ETH/USDT.P ShortTrading Journal Entry: ETH/USDT SHORT
Date of Entry: July 7, 2025
Asset: ETH/USDT Perpetual Futures
Position: SHORT
Entry Price: $2,580.00
Stop Loss: $2,615.00
Take Profit: $2,510.00
Risk/Reward Ratio: 2.00:1
Setup Grade: A+
1. Core Thesis
The trade is a high-confluence short position designed to capitalize on a probable liquidity hunt below an obvious daily support level. The core thesis is that the market is incentivized to purge over-leveraged longs, whose positions are revealed by order flow data, within the context of a clear daily downtrend.
2. High-Timeframe Context (The Strategic Landscape)
My analysis began with a top-down approach to understand the broader market environment.
Weekly Context: The market is in a large-scale consolidation range. This tells us that expecting a massive, sustained trend breakout is a lower probability. Instead, trading between major support and resistance zones is the governing dynamic.
Daily Context: The immediate trend on the daily chart is bearish. Price had established a series of lower highs and lower lows, bringing it down to a major area of historical support and the Volume Profile Point of Control (POC) around the ~$2,550 zone. This created the central conflict: a bearish trend meeting a significant support level. A naive analysis would be to buy this support.
3. Order Flow & Sentiment Analysis (The Deciding Factor)
This layer of analysis was the key to resolving the trend vs. support conflict and formed the backbone of my bearish bias.
Liquidation Analysis: The liquidation maps revealed a very large and proximate pool of long liquidations clustered between $2,470 and $2,500. This liquidity acts as a powerful magnet for price, as market makers are incentivized to push price toward these zones to absorb orders.
Funding Rate Analysis: Funding rates across almost all exchanges were consistently positive. This provided clear evidence that derivative traders were predominantly positioned long, were paying a premium to maintain those longs, and were betting on the daily support holding. This identified a crowded trade.
Synthesis: The presence of a large downside liquidity target (the "magnet") combined with a vulnerable and crowded group of participants (the "fuel") created a high-probability scenario for a contrarian move. The path of least resistance was for the market to push through the "obvious" support to liquidate these longs.
4. Tactical Execution (The Entry Trigger)
With a firm directional bias, the final step was to find a low-risk entry.
4-Hour Structure: The price action at the daily support level was weak. The 4H chart showed a low-volume, sideways consolidation, not a strong bullish rejection. This lack of a decisive bounce was my first clue that the support was fragile.
1-Hour Entry Pattern: I identified the perfect entry trigger by observing the 1H chart.
Price staged a minor rally toward the $2,580 resistance level.
Crucially, this rally occurred on visibly declining volume, signaling a lack of genuine buying interest. It was a corrective, not an impulsive, move.
My entry at $2,580 was placed at a clear support-turned-resistance flip zone, allowing us to short into weakness at a favorable price.
5. Risk Management (The Trade's Foundation)
Stop Loss ($2,615): The SL was not an arbitrary price but a logical invalidation point. It was placed just above a recent 1H structural swing high. A move above this level would have proven the "weak rally" thesis incorrect and signaled that buyers had taken control.
Take Profit ($2,510): The TP was chosen for two reasons:
Rule Compliance: It mathematically secured my required 2:1 risk/reward ratio.
Strategic Placement: It sits just ahead of the psychological $2,500 level and the densest part of the liquidation pool, increasing the probability of a fill before any potential support-driven bounce.
This trade represents a textbook example of my strategy: using high-timeframe analysis to build a directional bias, confirming it with order flow and liquidity data, and executing with precision on a low-timeframe pattern, all while adhering to strict risk management rules.
ETHUSDT.3S trade ideas

ETHEREUM ETHUSDT is awaiting a directional bias .but at the moment it has to break a weekly supply roof and sustain the gains as buy confirmation.

Weekly trading plan for EthereumLast week's price action followed our bullish scenario perfectly. Currently trading above the weekly pivot point, we've already hit target 1. Now anticipating target 2 - either directly or after a local pullback. However, if we lose the pivot with no buyer recovery, expect downside momentum toward support. Also explained the $2,112 target rationale in the video analysis
Which scenario do you think will play out? 👀

FULL MARGIN TEST ETH✅ 2. ETHUSD (Strong bias rising)
Entry: 2565 Long on retracement
Stop Loss: 2540
Take Profit: 2600
Recommended lot size: 0.20 lot (1:100)

ETH 30min: Bearish Triangle Forming After RSI Divergencehelo guys
Ethereum is currently trading within a clear range, and recently formed a bearish triangle pattern near the top of the consolidation. A visible RSI divergence confirmed the loss of bullish momentum as price made a higher high, but RSI printed a lower high — a common sign of exhaustion.
Now, ETH is moving downward within the triangle, and pressure is building near the lower edge of the range. If the pattern breaks down as expected, the next likely move is a drop toward the support zone around $2,370–2,380, which marks the bottom of the range.
This setup shows a typical structure:
Divergence → Triangle → Breakdown toward range low
Unless price reclaims the triangle top quickly, bears have the upper hand in the short term.

ETH/USDT : Gearing Up for a Major Breakout? (READ)By analyzing the Ethereum chart on the weekly timeframe, we can see that the price has started rising just as expected and is now approaching the first target. For now, ETH faces major resistance in the $2,600–$2,900 zone.
If price breaks above this key area, I expect a strong bullish move from Ethereum!
Based on the main analysis, the short-term targets are $2,700 and $2,890, while the mid-term targets are $3,100 and $4,100.
Please support me with your likes and comments to motivate me to share more analysis with you and share your opinion about the possible trend of this chart with me !
Best Regards , Arman Shaban

ETH FAST TRADE [15M]📝 My ETH Short Idea (Test Trade)
This is a test idea where I’m simply practicing my analysis and trade execution. It’s built entirely on my own personal strategy, so it’s primarily for self-development and tracking.
💡 The main setup:
I’m looking for a short position on ETH, but this idea will only be valid if all my levels and conditions align exactly.
Otherwise, I’ll skip the trade.
📌 How to enter:
I’ve detailed exactly how to enter the trade:
Wait for my specific trigger conditions to be met (price levels + confirmation by my indicators).
Enter only after the setup is fully formed — no early entries.
Manage risk properly with stop-losses beyond key invalidation levels.
Scale in only if price structure continues to validate my scenario.
⚠️ Important:
This is not financial advice. I’m using this idea mainly to test and refine my strategy. Sharing it here for transparency and to improve my analytical discipline.
✅ Plan:
If the setup completes exactly as planned, I’ll look for targets according to my strategy’s rules, trailing stops along the way.

HolderStat┆ETHUSD retest of the resistance lineBINANCE:ETHUSDT has exited a falling wedge and is forming a bullish continuation pattern. With price action building above $2,500, a breakout toward $2,800 is in play, targeting the supply zone around $3,000. Structure favors bulls.

Long trade
ETHUSDT 4H Chart Analysis
Date: Sat 05th July 2025, 4:00 PM
Session: London to NY AM
Key Trade Details
Entry: 2,515.17
Profit Target: 2,864.44 (+13.89%)
Stop Loss: 2,479.01 (−1.43%)
Risk-Reward: 9.66
Key Reasons for the Trade:
Bullish Breakout above 2,515, supported by strong volume surge.
Price Above EMA & WMA: Clear trend confirmation.
Strong Momentum: The RSI is overbought, indicating bullish strength, but watch for a potential short-term pullback as the price approaches resistance.
Target Zone: Prior resistance cluster at 2,820–2,860.
Current RR in Play: Trade already moving

When does Bolran start?Read carefullyhello friends👋
💰Many of you are asking when Bolran will start or if it will start at all, we decided to explain it to you in a full post.
Well, you can see the Ethereum chart moving in a channel, and with a drop, it created a big fear that a fall is coming, and meanwhile, the buyers returned the price to above 2000 dollars with a strong and unexpected return.
✅️Now the price is stuck in the specified box between 2200 and 2500, and if this range is maintained, the price will easily move up to the range of 3200 in the first wave, and if it fails to maintain this range, the price will fall below 1500 dollars.
🧐Now, in our opinion, due to the rapid return of the price from the channel, this failure is a fake channel and the range will be maintained, and we are likely to see Ethereum rise in the coming weeks.
🤔You know that Ethereum is the leader of altcoins, and if it grows, important altcoins will grow, which is the beginning of Bolran, and there are important altcoins that can be used for good profit.
🌟You can join us if you like.🌟
🔥Follow us for more signals🔥
*Trade safely with us*

Resistance zone: 3265.0-3321.30
Hello, traders.
If you "Follow", you can always get the latest information quickly.
Have a nice day today.
-------------------------------------
(ETHUSDT 1D chart)
It is showing an upward breakout of the important zone of 2419.83-2706.15.
We need to see if the price can be maintained by rising above the Fibonacci ratio of 0.5 (2788.93).
If so, it is expected to rise to the resistance zone of 3265.0-3321.30.
The important zone of 2419.83-2706.15 is the support and resistance zone that can lead to a full-fledged uptrend.
Therefore, if it falls below this zone, we should stop trading and watch the situation.
-
Thank you for reading to the end.
I hope you have a successful trade.
--------------------------------------------------
- This is an explanation of the big picture.
(3-year bull market, 1-year bear market pattern)
I will explain more details when the bear market starts.
------------------------------------------------------

ETH Long Swing Setup – Sideways Hold with Dip-Buy OpportunityETH continues to hold above the key $2,300 support, showing resilience and consolidating within range. We’re watching for one more dip into the $2,300–$2,375 zone to trigger a long entry, with momentum building for a potential breakout.
📌 Trade Setup:
• Entry Zone: $2,300 – $2,375
• Take Profit Targets:
o 🥇 $2,900 – $3,000
o 🥈 $3,300 – $3,400
o 🥉 $4,000 – $4,200
• Stop Loss: Daily close below $2,000

Ethereum Facing Key Resistance, Breakout or Fakeout?ETH is pressing into major horizontal resistance near $2,600 after breaking out from a double-bottom structure. Price is moving within a wide range capped near $2,900 and supported by the 0.5 and 0.618 fib zones.
🟢 Scenario 1 – Bullish:
Clean break and hold above $2,600 opens room to test the top of the range around $2,900. Watch for a higher low retest to confirm strength.
🔴 Scenario 2 – Bearish:
Rejection here could send ETH back toward $2,340 (0.5 fib) or even $2,220 (0.618). The stochastic RSI is approaching overbought, signaling caution.
This chart is for educational purposes only — not financial advice.

Ethusdt bullish cup and handle dailyEthusdt is forming a big cup and handle pattern in daily time frame. A close above 2850 in daily time frame may activate the pattern.
Targets are 3300, 4000 and 5500
Pattern invalidation: A close below 2100

Ethereum & monthly 20MAEthereum is gaining strength and will likely break above the monthly 20 MA. Will it maintain this momentum by month's end and remain bullish in the coming months?
Good luck HODLRS ✌️🤞

Short-Term ETH Setup – Bearish Bias with Target at $2536Short-Term ETH Setup – Bearish Bias with Target at $2536 🐻
Ethereum is showing signs of weakness below resistance, and a short-term pullback could be on the table. If bearish momentum holds, I’m watching $2536 as the next key target.
Tight risk management is crucial — this setup offers solid R/R if played with precision.
📉 Follow for real-time analysis, sharp entries, and no hype.

ETH Bullish Update
Ethereum is looking bullish, and is respecting clearly defined support and resistance levels.
In my primary count, we have finished black wave 1. The question is to determine if black 2 is already finished, which could lead to strong upside.
There is no way to know without further price action, and a break of green resistance is a very bullish signal.

ETH BEARISH AT RESISTANCE ETH rejecting daily resistance, likely price will look to find supports at zones marked below
DYOR

ETHUSDT.P I Daily CLS I KL OB I Model 1Yo Market Warriors ⚔️
Fresh outlook drop — if you’ve been riding with me, you already know:
🎯My system is 100% mechanical. No emotions. No trend lines. No subjective guessing. Just precision, structure, and sniper entries.
🧠 What’s CLS?
It’s the real smart money. The invisible hand behind $7T/day — banks, algos, central players.
📍Model 1:
HTF bias based on the daily and weekly candles closes,
Wait for CLS candle to be created and manipulated. Switch to correct LTF and spot CIOD. Enter and target 50% of the CLS candle.
For high probability include Dealing Ranges, Weekly Profiles and CLS Timing.
Trading is like a sport. If you consistently practice you can learn it.
“Adapt what is useful. Reject whats useless and add whats is specifically yours.”
David Perk aka Dave FX Hunter
💬 Don't hesitate to ask any questions or share your opinions

ETHUSDTThis is very easy...
best support level 2300 to 2500 for jump price. but was needed for jump price for get enrgy for movement to high levels by fake breakout.
First level of resistance 2800 to 3000.
⚠️Control Money Management in your capital.

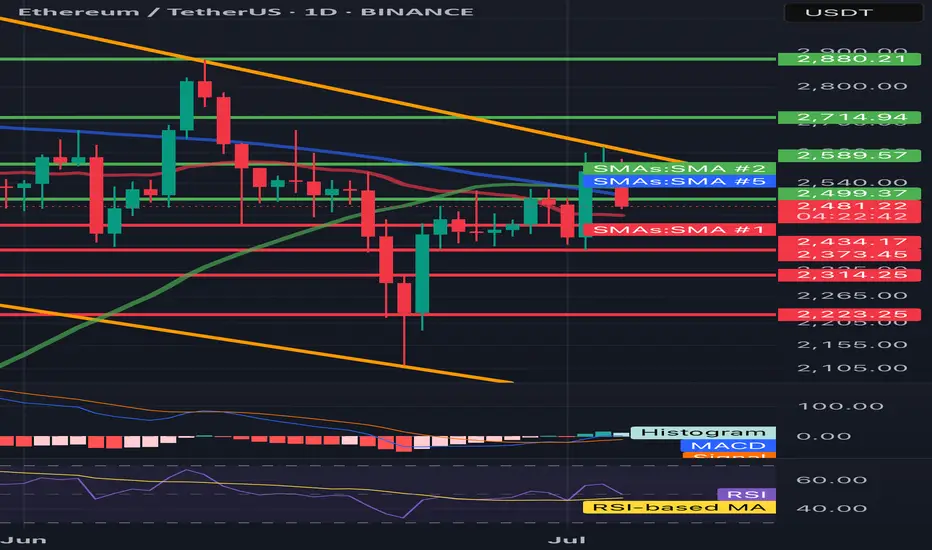
ETH/USDT 1D🔍 ETH/USDT - technical analysis (1D interval):
📉 Price: 2478 USDT (-4.36%)
🔧 Resistance:
• SMA 200 (green): ~ 2589
• Resistance zone: ~ 2715 → 2880 USDT
• SMA 100 (blue): ~ 2500 (just rejected)
🔧 Support:
• SMA 50 (red): ~ 2434 - currently tested
• Strong support: 2373, 2314, 2223 USDT
📊 indicators:
• MacD: freshly intersected, but the momentum is weakening
• RSI: ~ 45 - neutral/weak, under 50 (no bull strength)
• Trend: Still in the downward channel (yellow trend lines)
⸻
⚠️ Conclusions:
• Price rejected from 2500 (SMA 100) and flies down.
• If 2434 falls, a further discount is possible to 2373–2314.
• Lack of bulls with key resistance - the inheritance scenario dominates.
• Watch behavior at 2434 - this is now a key level.
Ethereum (ETH): Good Bounce | $2800 IncomingWe had a rather sharp but clean breakout recently where price has shown us that buyers are dominating currently, pushing the price toward the local high at $2800. This is our current target and so far ETH had been perfoming more than well.
Swallow Academy

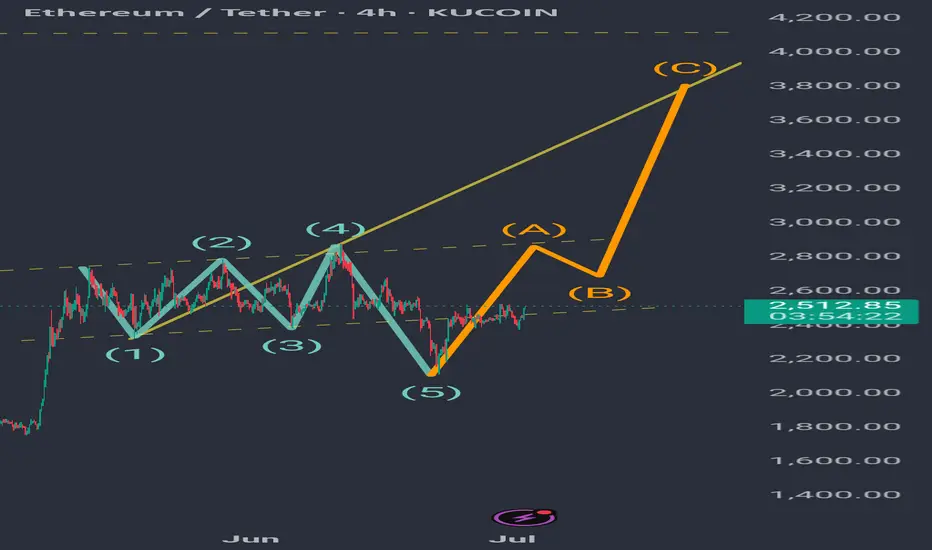
A probability: Bullish Wolve Wave on ethEth hit a low near $1,400 in early April and from there charted a sharp rise, doubling its price. Around $2,800, it clearly encountered resistance corresponding to the 0.5 Fibonacci of the previous downward movement. From that point, it moved sideways in a range whose downward breakout reached the 0.5 Fibonacci of the current upward movement, $2,113, where it found strong support and has returned to the range. So far, this appears to be forming a bullish Wolve wave, whose target would be reached at the yellow line, which is the projection of waves 1 and 4 connecting. If Eth manages to break through the range and consolidate above it, it is very likely to achieve that target.