ETH/USDT High winning scalping signals in 15 minutes are as foll- Signal: LONG
- Admission: 2,436 ~ 2,442
- Take Profit: 2,462, 2,478
ETHUSDT.3S trade ideas


FRD/FGDFRD happen when there is a red day after 2 or more breaks of daily high to the up side. after the trigger to the downside, it will be highly likely to continue to breakdown

doing the homeworktesting 3days of breakout, frd,fgd, day one false break with the break of daily level as trigger to start to build position. for entry . buy if it dip below daily vwap during the sessions. stop is above the high or the low of the signal day. targeting the second push. for inside day, trying to capture the false break back to the other side or daily high or low 90% winrate. let see when I apply it in real time

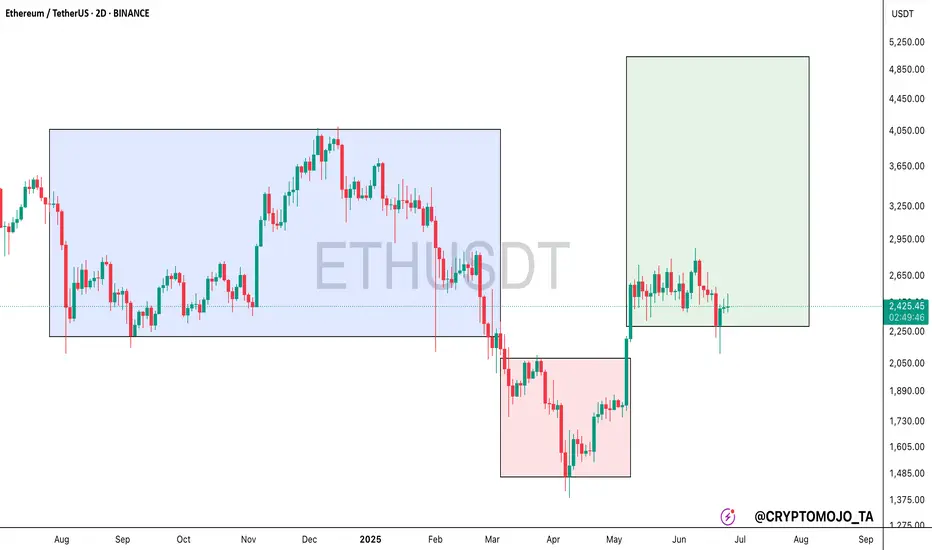
Weekly trading plan for EthereumBINANCE:ETHUSDT Last week, price mostly traded in a range. For this week, I've updated key levels, marked them on the chart, and modeled several scenarios. We can expect a pullback—possibly a deeper correction—before another push toward resistance levels. If price breaks the local low but then reclaims the weekly pivot point, I'll consider opening long positions without waiting for a deeper pullback.
Write a comment with your coins & hit the like button and I will make an analysis for you
The author's opinion may differ from yours,
Consider your risks.
Wish you successful trades ! mura

ETHUSDT WEEKLY UPDATE — PART 1
When Conviction Fails: Apex Rejection, Hidden Redistribution, and the Illusion of Demand
Good morning, good afternoon, good evening, wherever you're tapping in from. Now, as always, I’m not here to waste your time with unnecessary waffle. Let’s get straight into it and unpack this mess step-by-step.
THE APEX REJECTION | MORE THAN JUST A WICK
So picking up from last week's update, we find ourselves right at the crossroads, and not the romantic kind either. What we’re looking at right now so far, is a clean yet 100% conclusive rejection from the apex of a key macro structure.
This isn’t just any level. This is the intersection of vertical momentum and horizontal memory, the apex of a triangle that’s been forming for months. This is where bullish intent was supposed to hold, supposed to assert dominance, but instead, what did we get? A strong push into resistance, a failure to fix above it, followed by exhaustion and signs of institutional unloading.
Now, to the untrained eye, this may look like a pullback, or even a healthy correction. But we’re not here to look at charts with retail goggles. We’re here to track the true intent behind the price action, and if you know your schematics, this is screaming redistribution. And not just any redistribution, the kind that happens right before the market changes its personality.
WHERE ARE WE IN THE SCHEMATIC?
If we overlay Wyckoff logic on top of this structure, it's very clear:
We’ve had our PSY (preliminary support).
Followed by a spring, a shakeout, and a fake rally.
Now we’re dancing around what appears to be the UTAD (upthrust after distribution) — but weaker.
This isn’t classic distribution, it’s redistribution masked in macro confusion.
Here’s the thing this range isn’t just price consolidation, it’s behavioural conditioning. This long, choppy sideways movement is designed to wear out both bulls and bears, making them question their bias, mismanage their risk, and either overstay or exit too early.
The market is methodical, not random. These candles aren’t accidents, they are footprints of algorithmic trap setting, and right now, it looks like the net is about to close.
VOLUME TELLS THE TRUTH
Let’s not forget volume. Look at the weekly volume through this recent push:
Decreasing volume on the rallies,
Higher volume on the red closes,
And multiple spikes that failed to carry price past resistance.
That’s your dead giveaway. You don’t need to be a wizard, just follow the clues. Price is being pushed, not lifted. Demand isn’t stepping in, liquidity is being removed. This isn’t smart money accumulation, if confirmed by the endd of this week, this most recent move up cout be doing of smart money unloading, Quietly and Efficiently.
THE MARKDOWN IS PRIMED
Let’s now address the elephant in the room, the range low and point C of the triangle on the 4H.
T hat’s where liquidity is sitting.
That’s where the market’s next objective lies.
We’ve now failed to reclaim the apex, the wick was slapped down, and unless something significant shifts, the next logical move is to sweep that C point, take out the emotional support, and either:
Tap into true demand (if it exists), or
Begin the cascade toward the final green demand zones between 2,150–2,070, which we marked weeks ago.
And don’t forget, this sweep may not be clean. We could get a fakeout bounce mid-range — enough to bait in more longs, only to roll over again.
PSYCHOLOGICAL LAYER
What’s happening here isn’t just technical, it’s emotional warfare. This entire range has been one long gaslight for the average trader. Between the failed breakouts, failed breakdowns, and chaotic intraday behaviour, retail has been turned into liquidity.
And if you’re still trying to long blindly at the top of this, hoping for 3k ETH without a confirmed structure reclaim, then respectfully, you’re the product right now.
Coming next in Part 2:
A full breakdown of the 4H macro setup
Analysis of the internal range mechanics
Recalculated fib zones
Where the liquidity pockets are
What the most probable path is short, medium, and long-term
Stay tuned — I’ll keep the flow coherent, structured, and aggressive. No fluff. No hopium. Just structure, psychology, and execution.

ETH IN NO-MAN'S LANDEthereum is caught in no-man’s land. After a sharp rally in May that pushed price cleanly above the 200-week moving average, ETH has now slipped back between the 200 MA (around $2,400) and the 50-week MA (just under $2,600). It’s a classic case of being stuck in the middle – too weak to break higher, too strong to roll over completely. This is where momentum goes to die.
Until one of those moving averages gives way, expect more chop and indecision. A breakout above the 50-week could reignite bullish momentum, but a drop below the 200-week would bring $2,141 support back into play. For now, Ethereum’s just dancing between the lines.

ETHUSDTThis movement downtrend. If breake 2.790 movr to 3.500$ but breke 2.200 move trend to 1.500$.

Ethereum Rebounds from Strong Base – ATH in Sight?Hello traders, here’s the CRYPTOCAP:ETH Monthly Outlook
Ethereum is flashing early signs of a bullish reversal, with a clean Morning Star candlestick pattern forming right above the $1,050–$1,200 support zone, a historically strong base.
After bouncing hard from this level, ETH is now approaching the major resistance area at $3,400–$3,800, the same zone that previously rejected upward moves.
If ETH can break and close above this resistance, we could see the start of a fresh bullish leg. But until then, this zone remains a major hurdle.
Keep an eye on the monthly close, it could confirm a shift in long-term momentum.
DYOR, NFA
Thanks for following along — stay tuned for more updates!

ETHEREUM PRICEACTION TRADINGETHUSET have tested the broken demand floor and it looks like buyers are going for another .
if that level is broken ,it will be a wave of long which will hope to take profit on the supply zone .

EthusdttHis asset has presented my expectation information, in which my my sell confident level is 90% for now, while the 10% left can be defined by FA.
the entry zone is valid. but if price kick my stoploss then , i will like to see price seek little higher price to the zone i point magnifier.

ETH 1D Analysis – Eyes on the 21EMAETH is currently hovering near $2,420, right above the key support at $2,415. Price is trying to reclaim the 21 EMA, which is crucial for bullish momentum.
🔹 Two Fair Value Gaps (FVGs) acting as demand zones
🔹 Daily close above 21 EMA = strong bounce expected
🔹 First major resistance at $2,740
🔹 Breakout could trigger a rally toward the $2,900+ zone
Bias: Bullish if reclaim confirmed
📌 Watch daily close – reaction from this level is key
NFA | DYOR
#ETH #Ethereum #Altcoins #Crypto #FVG #21EMA

$ETH is showing signs of a potential bullish move!CRYPTOCAP:ETH is showing signs of a potential bullish move.
The recent consolidation looks like it's building up for a strong breakout.
With market sentiment improving and growing interest in ETH-based projects, this could be a good time to accumulate before the next move up.
I’m watching the key resistance levels closely, if they break, we could see a fast rally.
#Ethereum
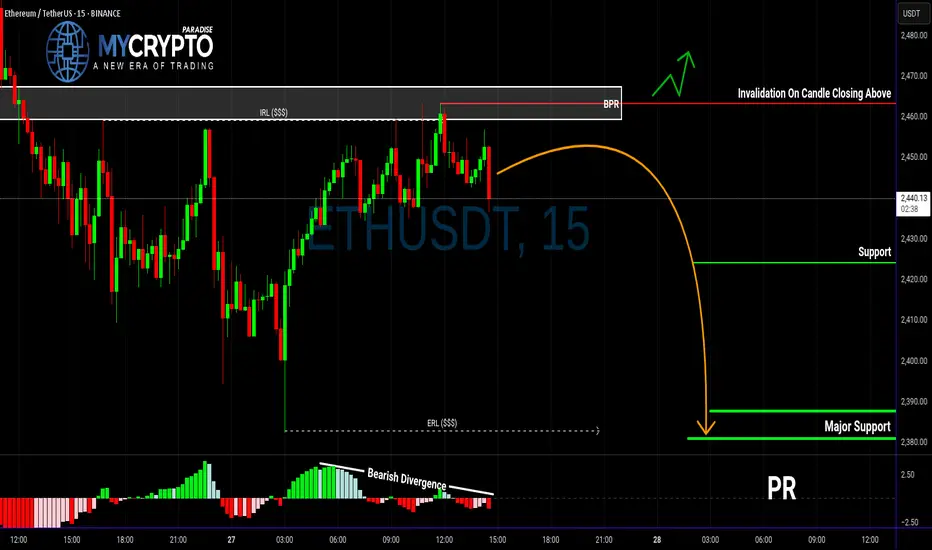
ETH in Trouble? This Breakdown Could Be Just the BeginningYello, Paradisers — are you spotting the same warning signs we did before the last major ETH correction? If not, now’s the time to pay close attention.
💎ETHUSDT is currently showing multiple bearish signals across both higher and lower timeframes. On the higher timeframe, we’ve confirmed a bearish Change of Character (CHoCH), which is often the first major clue that momentum is shifting from bullish to bearish. This shift suggests that ETH could be preparing for a deeper move down.
💎On the 15-minute timeframe, price has reacted directly from the BPR zone. What adds even more weight to this reaction is the clear bearish divergence we’re seeing on the MACD indicator. Together, these signs point to increased bearish pressure in the short term.
💎More importantly, ETH has already taken out Internal Range Liquidity (IRL), which often sets the stage for a move toward the External Range Liquidity (ERL). When IRL gets swept and momentum remains bearish, it’s typically a sign that the market is hunting for liquidity on the other side of the range—and that’s exactly where we believe ETH is headed next.
💎That said, to take this setup with high confidence, we’re waiting for a clean bearish candlestick pattern to form. Confirmation is key. A solid entry backed by strong price action improves the probability of success and allows for tighter, more efficient risk management.
💎However, if ETH breaks out and closes decisively above our invalidation zone, the entire bearish idea is off the table. In that scenario, patience will be our best tool—we’ll wait for price action to realign and only re-enter the market once a new high-probability setup presents itself.
🎖Strive for consistency, not quick profits. Treat the market as a businessman, not as a gambler. Patience and discipline are what separate the professionals from the herd. Stick to the process, trust the strategy, and you’ll stay ahead of 90% of the market.
MyCryptoParadise
iFeel the success🌴
ETH.... You can do it. Get back into structure. ETH is struggling below resistance; however, an exchange of hands on lower timeframes can give the bulls a bit more wind. A break back into structure would be bullish. Don't mind me, I've been smoking that hopium.
Full TA: Link in the BIO

Ethereum has been in bear market since 2021When the matter is in charts, I tend to speak less
I am not the best speaker, so the chart says it for me!
Ethereum is and has been in bear market since 2021
I think entry between 700/600 is a good point
I want to buy BTC, ETH, XMR

ETH Long.As we can see on the weekly timeframe, ETH made a breakdown after which it consolidated for a while and then made a false breakdown of the zone, now showing a reversal. One can plan to take the long position at the target of the higher trendline.

Inverse Head and Shoulders on Ethereum: Short Opportunity ETH?I'm currently watching Ethereum , and things are starting to look interesting.
We’re seeing early signs of a potential break in structure to the downside, and I’m closely monitoring a bearish inverse head and shoulders pattern. On the 30-minute timeframe, I’m waiting for a clear break of market structure within the current range before considering a short entry.
Stop loss would be placed above the range, with the target outlined in the video.
This is not financial advice—please trade responsibly and always manage your risk.

$ETHUSDT 1H Trade Setup CRYPTOCAP:ETH – 1H Trade Setup
- Entry: CMP
- SL: $2,410
- Target: $2,506
ETH broke above the falling trendline and retested it. Clean breakout setup, bullish continuation likely above $2,445.
DYRO, NFA

ETH Long / Buy SetupAs of many times mentioned that, will short eth above 3k or 3k, but it still shows Bullish momentum no sign of weakness, maybe this entry triggers during weekend due too low volume, search for ifvg, if any 1D or 4hr Bullish fvg truns into bearish ifvg then will take short on ETH. For now will take long with SL and proper risk management.

EthusdEasy target here if it can keep pushing above 3k and the weekly ends above it it will sure go to 4k where is a good point to sell . Alt season it’s starting now
ETH Needs big money injection ASAPRising wedge presented in the chart is a bearish pattern.
To cancel this bearish pattern we need :
- Break the $2,800 level with bigh green candle
- The break should occur with big volume
- The break should be as soon as possible.
Otherwise, the downtrend will continue and he decline will be sharp.
COINBASE:ETHUSD BITSTAMP:ETHUSD CRYPTOCAP:ETH CRYPTOCAP:ETH.D

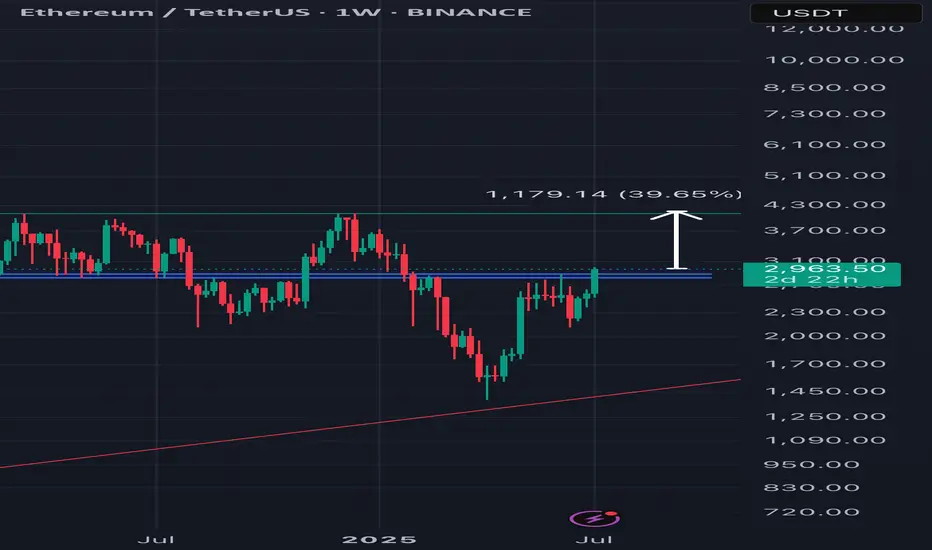
ETH BREAKING OUT?Ethereum is making a strong weekly push into resistance around $2,817 – a key level that acted as support throughout 2023 before flipping to resistance in early 2024. Price is now testing this zone after a steady string of higher lows, and the move is backed by increasing volume, signaling genuine momentum. ETH has already reclaimed its 200-week moving average and is now challenging the 50-week MA from below. A weekly close above both would mark a major technical shift, suggesting the end of a long consolidation phase and the potential start of a sustained uptrend. If bulls can push decisively above this level, the next major target sits near $4,093. For now, all eyes remain on whether Ethereum can reclaim this final resistance before the path higher opens up.
