ETHUSDT - BEARISHETH/USDT Chart Overview (Short-Term Trading Idea)
- **Current Price**: ~$2,516.91
- **Volume**: 11.91K (moderate activity)
---
### 💡 **Trading Idea: Short-Term Bounce Play and then bloodbath.**
#### ✅ Setup
- Wait for ETH to retest the $2,100–$2,2000 support zone
- Look for bullish candlestick patterns (e.g. engulfing, hammer)
- Confirm with rising EMA or bullish divergence in RSI (if available)
#### 🚀 Entry
- Buy near $2,280 if price shows strength
#### 🛑 Stop Loss
- Around $2,220 (below recent support and wick levels)
### 🧠 Notes for Strategy
- Keep your position size conservative due to high intraday volatility.
- News around BTC can affect ETH—watch both charts.
- Great for scalping or a quick day trade, not ideal for long-term holds in this timeframe.
NFA
DYOR
ETHUSDT.3S trade ideas

Wait for ETH to rebound to $2528-2542 and place a short order.Short
$2528~$2542
Take Profit
$2480, $2460
Stop Loss
$2555
If the price falls below $2510, do not chase short, wait for a rebound.

ethererum
how to play around crypto and win the day
every crypto traders needs to know the following before taken any action.
(1) US10Y
(2)DXY
(3) GREED AND FARE INDEX
(4) BTCMARKET CAP CHART FOR CAPITAL INFLOW AND OUTFLOW.
(5) US FED INTEREST RATE DECISION.
(6) BITCOIN DIRECTIONAL BIAS AND SEASON(BULL/BEAR)
#SHAVYFXHUB #BITCOIN #BTC #CryptoTrading #Ethereum #Solana #AVAX #BNB #CryptoEducation

ETHEREUM ETHUSDT is awaiting a directional bias .but at the moment it has to break a weekly supply roof and sustain the gains as buy confirmation.

ETH BEARISH AT RESISTANCE ETH rejecting daily resistance, likely price will look to find supports at zones marked below
DYOR

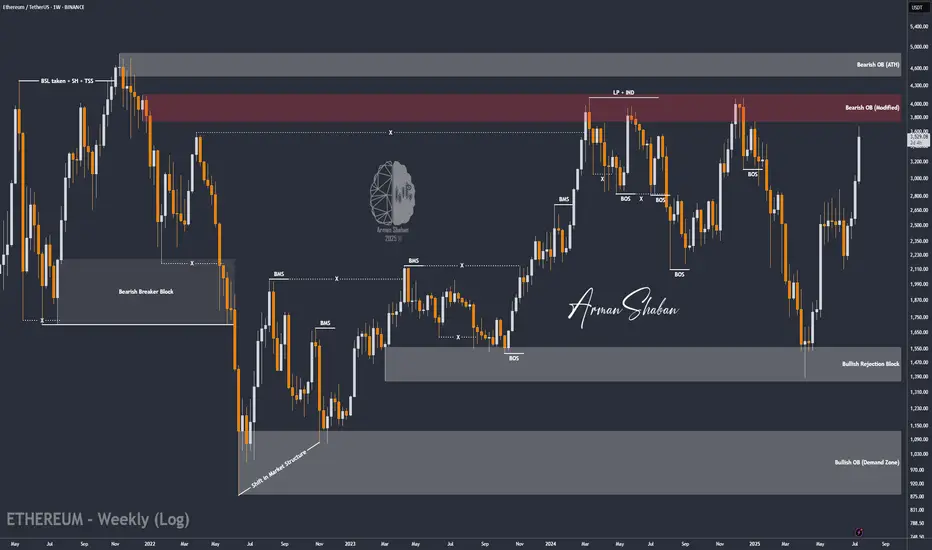
ETH/USDT | The Next Target is $4000 and it's Close! (READ)By analyzing the Ethereum chart on the weekly timeframe, we can see that this cryptocurrency remains one of the strongest major cryptos in the market, continuing its bullish rally despite the overall market correction. It has already hit the next target at $3500, and I believe we might see Ethereum reaching $4000 sooner than expected! Based on previous analyses, if this bullish momentum continues, the next targets will be $3740, $4100, and $4470.
Please support me with your likes and comments to motivate me to share more analysis with you and share your opinion about the possible trend of this chart with me !
Best Regards , Arman Shaban
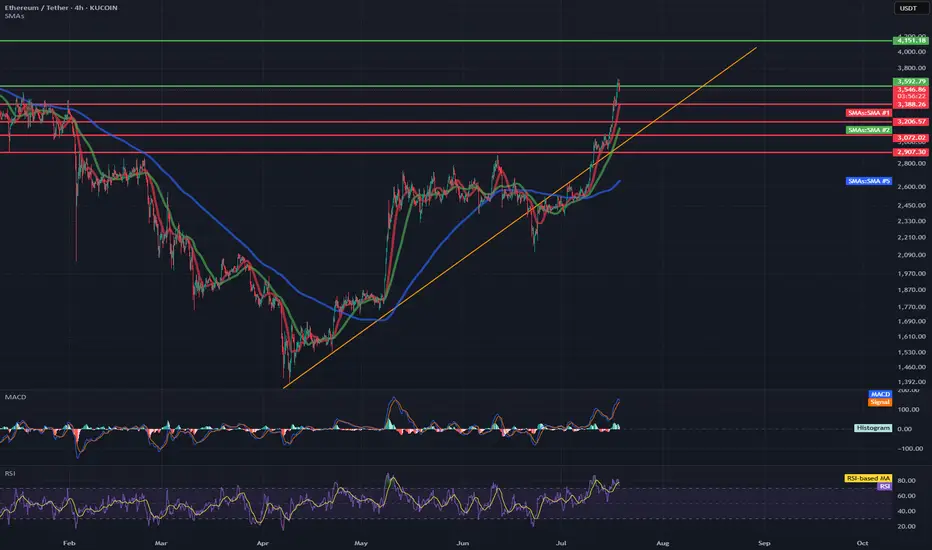
ETH/USDT 4H Chart✅ Market Trend and Structure:
Uptrend: The highlighted orange trend line shows continuous growth since mid-April. The price is trading above the 50- and 200-period moving averages (EMA and SMA), confirming bullish sentiment.
Current price: around 3556 USDT – very close to local highs.
Resistance break in the 3200–3300 USDT area, which now acts as support.
📈 Technical Levels:
Resistance (red horizontal lines):
3600–3650 USDT – local resistance resulting from market reaction.
3888 USDT – next historical resistance level.
4133 USDT – established long-term target (green dashed line at the top).
Support:
3300 USDT – strong support after a previous breakout.
3080 USDT – previous high, now the next support level.
3070 / 2900 USDT – key technical support levels in the event of a larger correction.
📊 Indicators:
MACD:
The MACD is in a strongly bullish zone, but:
The histogram is flattening.
A bearish crossover pattern is possible in the following candles – a signal of weakening momentum.
RSI:
RSI ~74 – is in the overbought zone, which often heralds a correction or at least consolidation.
A value above 70 confirms the bullish trend but may suggest that momentum is overheated.
📌 Conclusions and Scenarios:
🔼 Upside Scenario (trend continuation):
If the price remains above 3300–3350 USDT, it could move towards 3888, and then 4133 USDT.
A break above 3650 USDT on heavy volume will be a strong continuation signal.
🔽 Corrective scenario (short-term pullback):
The RSI and MACD suggest a possible correction.
Potential pullback to:
3300 USDT (retest of previous resistance as support).
SMA 200 (~2600 USDT) with a deeper downward move.
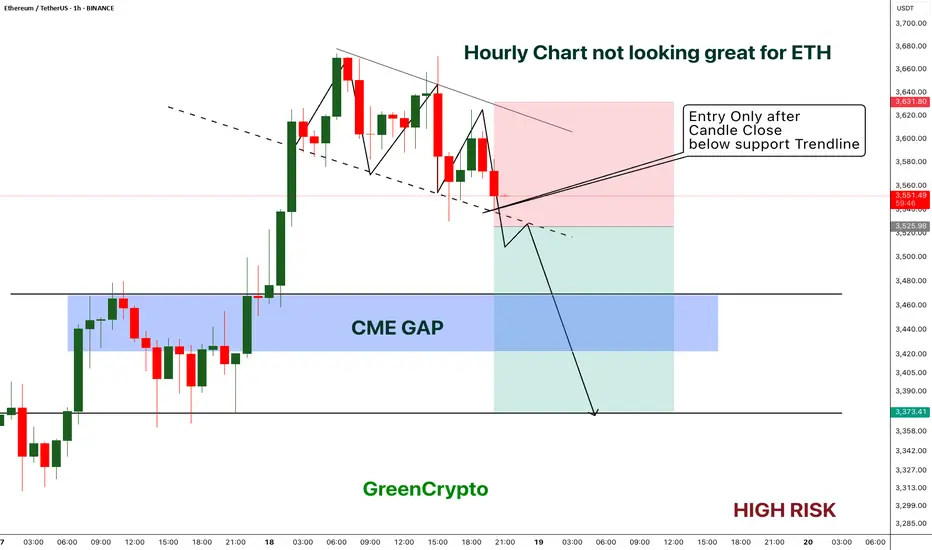
ETH - Short Trade with HIGH RISK- ETH got reject from resistance multiple times on 1H timeframe and now the price is playing near the support.
- I'm expecting overall market to cooldown this weekend, this could push the ETH to break the support
- ETH has CME gap around 3422 - 3467 range, im expecting this CME gap to be filled soon.
Entry Price: Below 3525
Stop Loss: 3631
TP1: 3471.15
TP2: 3381.76
Move SL to breakeven on TP1 hit.
Don't forget to keep stoploss.
Cheers
GreenCrypto
ETH 3rd Attempt at Resistance — Breakout or Bull Trap?Ethereum is back at a major level that’s rejected it twice already. A breakout here could finally end the range and send price into discovery — but if history repeats, this might be the ultimate fakeout before a sharp reversal. All eyes on the next few candles.

ETH-----Buy around 3600, target 3660 areaTechnical analysis of ETH contract on July 18:
Today, the large-cycle daily level closed with a small positive line yesterday, the K-line pattern continued to rise, the price was above the moving average, and the attached indicator was running in a golden cross. The general trend of rising is still relatively obvious. Recently, you can see that Ethereum is stronger than the big cake, and the continuous high-breaking prices are getting closer and closer to the previous historical highs. So this month there is a chance to touch or test; the short-cycle hourly chart rose strongly in the morning and broke the previous day's high position. The current price is above the moving average, and the attached indicator is running in a golden cross. The intraday and European sessions still depend on the trend of continuing to break high.
Today's ETH short-term contract trading strategy:
Buy in the 3600 area, stop loss in the 3570 area, and target the 3660 area;

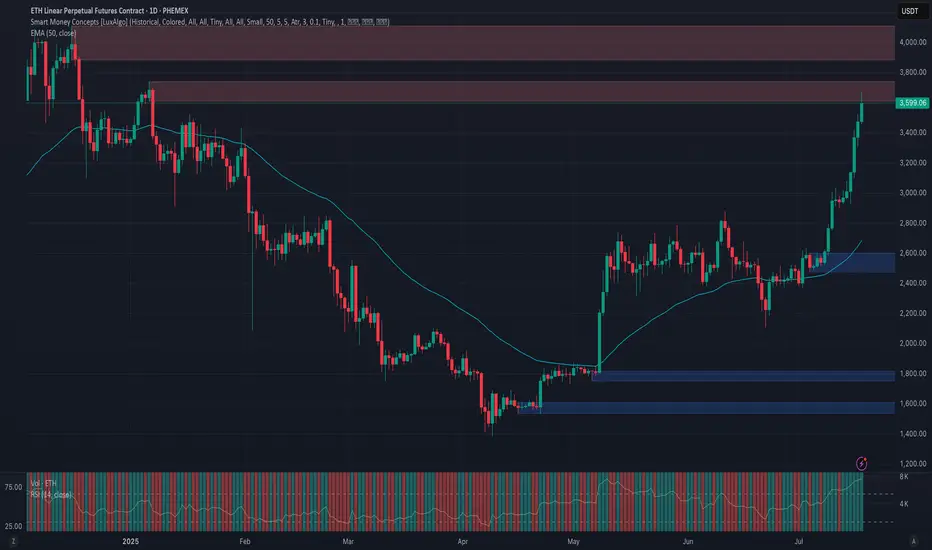
Phemex Analysis #98: ETH Price Explodes— Is $5,000 Finally Next?Ethereum ( PHEMEX:ETHUSDT.P ) has recently shown impressive strength, surging past significant resistance levels and stirring excitement in the crypto market. After an extended consolidation, ETH decisively broke through the crucial $3,300 resistance level, rallying more than 15% in just three days, and is now trading confidently around $3,500.
This renewed bullish momentum has traders and investors eagerly speculating: Could this be the start of Ethereum's next major run? Or should caution prevail amid ongoing market uncertainty? To help navigate this critical period, let's explore several key trading scenarios.
Possible Scenarios
1. Bullish Continuation – Targeting New Highs
Ethereum’s recent breakout above the $3,300 resistance signals strong bullish sentiment. If buying volume continues increasing, ETH could swiftly move towards higher resistance levels at $3,800 and potentially challenge the psychological milestone of $4,100.
Pro Tips:
Profit Targets: Consider locking in partial profits as ETH approaches strong resistance zones around $3,800 and $4,100.
Risk Management: Place tight stop-loss orders on recent lows, approximately around $2,902 to minimize downside risks.
2. Short-term Retracement – Healthy Pullback
Given ETH’s rapid surge, a short-term pullback to retest the recently broken resistance zone at $3,300 to $3,000 (now acting as strong support zone) is plausible. A successful retest would strengthen the bullish case, signaling healthy consolidation before further upward momentum.
Pro Tips:
Buying the Dip: If ETH holds above $3,000 with declining volume, consider cautiously adding to your positions or initiating new longs.
Volume Confirmation: Closely watch trading volume; lower volume during pullbacks typically indicates a healthy retracement rather than a bearish reversal.
3. Bearish Reversal – Breaking Below Critical Support
If Ethereum’s price experiences heavy selling pressure and breaks below the key support at $3,000, bearish sentiment could escalate, potentially driving ETH towards lower support levels near $2,470 and possibly even $2,110.
Pro Tips:
Short Positions: Experienced traders might consider initiating short positions if ETH decisively breaks below the crucial $3,000 support zone on increasing selling volume.
Long-term Accumulation: Long-term investors may strategically accumulate ETH near stronger support areas at $2,470 and $2,110, after clear signs of price stabilization.
Conclusion
Ethereum (ETH) currently offers attractive opportunities, propelled by recent bullish momentum yet balanced by market uncertainties. Traders must closely observe key resistance at $4,000, critical support around $3,000, and carefully analyze trading volumes for confirmation of market direction. By maintaining disciplined risk management and strategically capitalizing on outlined scenarios, investors can effectively navigate ETH’s price action in the weeks ahead.
🔥 Tips:
Armed Your Trading Arsenal with advanced tools like multiple watchlists, basket orders, and real-time strategy adjustments at Phemex. Our USDT-based scaled orders give you precise control over your risk, while iceberg orders provide stealthy execution.
Disclaimer: This is NOT financial or investment advice. Please conduct your own research (DYOR). Phemex is not responsible, directly or indirectly, for any damage or loss incurred or claimed to be caused by or in association with the use of or reliance on any content, goods, or services mentioned in this article.
ETH vs 200MA: Another TestETH on the daily has been pushed back so many times by the 200MA. Will price conquer it this time? I guess we’ll just have to wait and see.
Today is Friday, July 4th, so probably a long weekend for most traders. Somehow, price got pushed back again. Just a hunch, but I believe long traders are touching grass this weekend while sellers are grinding.
Anyway, we now have a support zone under price, made up of the 200MA and the 0.5 Fib — which, in theory, should hold against any attempts to push the price lower this weekend.
Always take profits and manage risk.
Interaction is welcome.

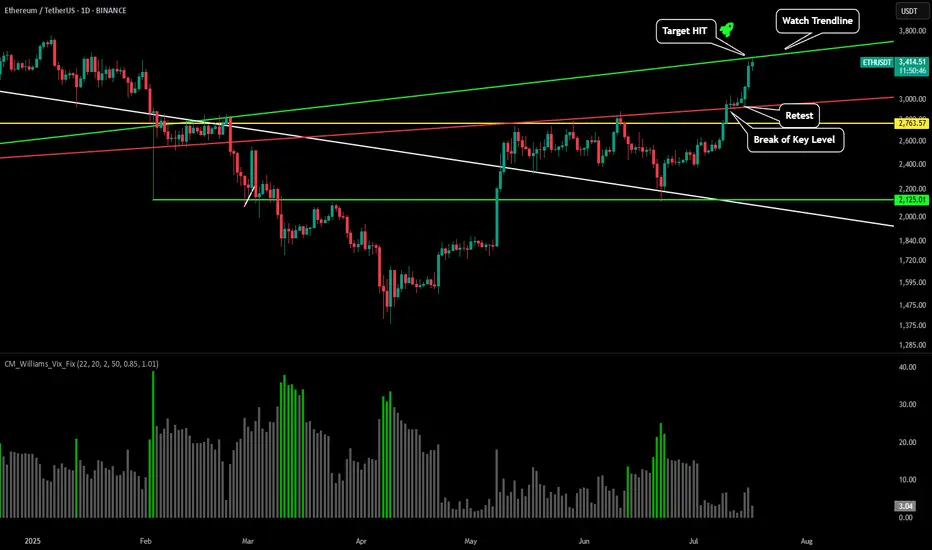
ETH - Charts Don't LiePlease refer to our previous post:
As stated here after breaking our red key trendline our prediction was price would move up swiftly to test the green trendline between between $3,400-$3,500.
After a successful retest of the red trendline it only took price 48 hours to increase 19% and reach our green trendline. This is a major area where we could see some profit taking starting to occur.
Once price is able to break through this level we should see a move to the most important price zone throughout the past couple years around $4k-$4,100.
ETHUSDT UPDATELooking at the ETH daily chart, we see a flag formation. If it breaks, it could take us to 3500.

Divergence Gap on CMP PAR indicatorPlaying the Divergence Gap on CMP PAR indicator to compound longs/shorts in a strong trebnd.

Ethereum Wave Analysis – 16 July 2025
Ethereum: ⬆️ Buy
- Ethereum broke resistance area
- Likely to rise to resistance level 3400.00
Ethereum cryptocurrency recently broke the resistance area located at the intersection of the resistance level 3200.00 and the resistance trendline of the daily up channel from May.
The breakout of this resistance area should accelerate both of the active impulse waves 3 and (3).
Given the clear daily uptrend, Ethereum cryptocurrency can be expected to rise to the next resistance level 3400.00 (which reversed Ethereum multiple times in January).

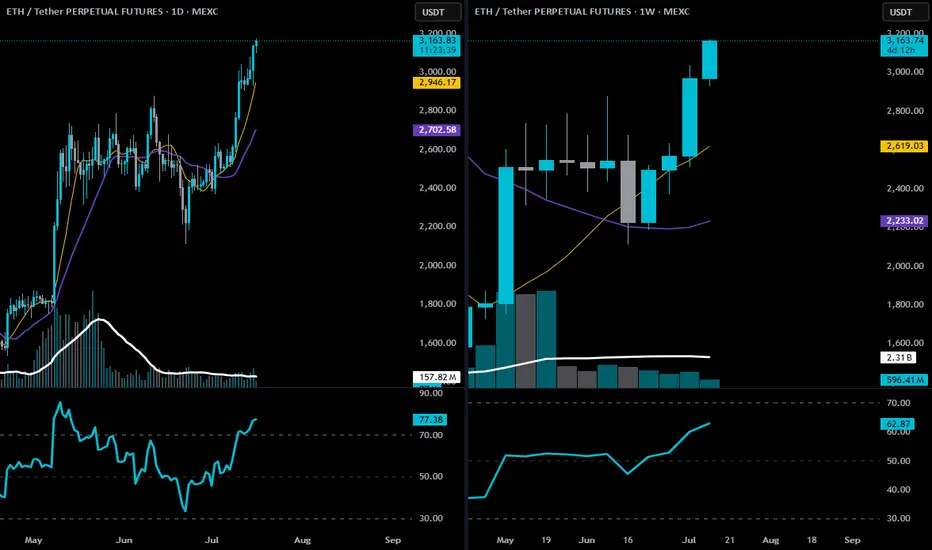
ETH-technical structure, momentum, and confirmation🕐 Daily Chart Analysis
Trend: Clear uptrend. Price is trading well above both the 9 EMA (gold) and 20 EMA (purple), with strong angle and separation.
Price Action: ETH is pressing into multi-month highs with no major resistance between here and the $3,350–$3,500 range.
Volume: Healthy increase in volume on bullish candles; recent bullish expansion looks organic, not low-volume driven.
RSI: At 77.15 — yes, overbought, but in a trending market, this is confirmation, not a sell signal. You want RSI to stay elevated during impulsive legs.
📅 Weekly Chart Analysis
Breakout Structure: This is the second full bullish candle after breaking out of a multi-month base ($2,800 range), following an accumulation period.
9 EMA Just Crossed Over 20 EMA: First time since early 2024 — bullish trend confirmation.
Volume: Large expansion bar from May shows institutional interest; current bar remains strong and building.
RSI: Pushing up to 62.75 — well below overbought, meaning there’s room to run.
🧭 Strategic Trade Plan (Swing Long)
✅ Bias: Long
Targeting $3,300–$3,500 with trailing logic to extend if momentum continues.
THIS IS NOT FINANCIAL ADVICE. Drinkin Smöökëē Whizkee. Edumacational Purpiz Only!
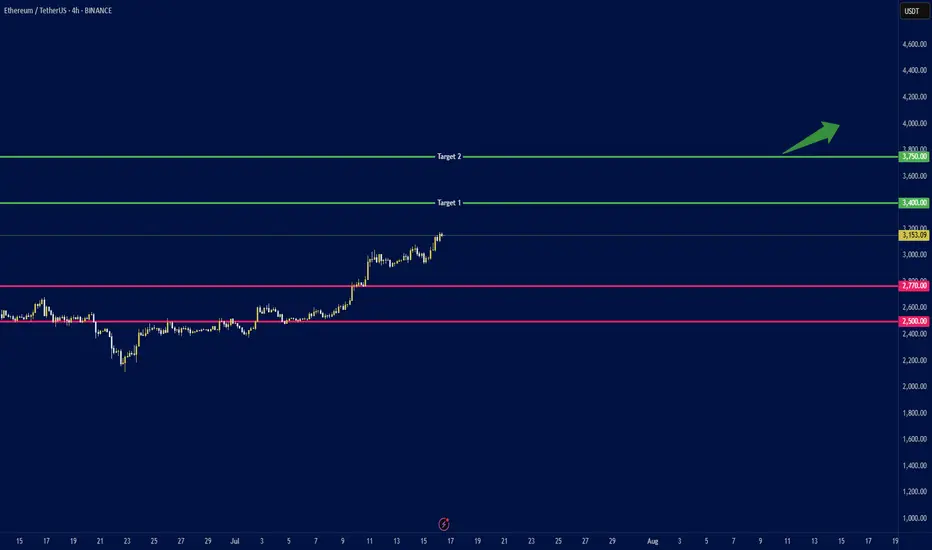
ETH to $4K ? Whales Accumulate as ETFs Break Records🕞 Timeframe: 4H
.
🟢 Bias: Bullish
1. 🧭 Fundamental Overview:
📈 Massive Institutional Inflows:
Ethereum ETFs have recorded over $1.2 billion in net inflows this July, with $908M just in the week ending July 11. This strong demand from institutional players (notably through ETHA and Bitwise) has pushed ETF AUM above $13.5 billion.
🏢 Corporate Accumulation:
Companies such as SharpLink Gaming have begun adding ETH to their balance sheets. SharpLink's 10,000 ETH (~$49M) purchase highlights growing corporate adoption of Ethereum as a store of value and strategic reserve.
🛠️ Ecosystem Resilience:
Ethereum continues to lead in network upgrades (e.g., Dencun), institutional DeFi, and tokenized assets—strengthening the long-term fundamentals of the chain.
2. 🧠 Sentiment & On‑Chain Metrics
🏦 Institutional Sentiment:
Ethereum ETFs have seen 12 straight weeks of inflows, outperforming Bitcoin in institutional allocation growth (ETH: 1.6%, BTC: 0.8%).
🐋 Whale Activity & Exchange Flows:
Declining ETH balances on exchanges suggest accumulation and reduced sell pressure. Whales and smart money are taking positions.
📊 Public Sentiment:
Bullish expectations remain strong amid price consolidation above key levels and positive ETF momentum.
3. 🔼 Key Levels:
Support: $2,770 and $2,500 (major trendline and psychological level).
4.🎯 Price Targets:
Short‑term (2–4 weeks):
If ETH breaks above $3,150: next targets at $3,400 and $3,750.
Medium‑term (by end of Q3 2025):
ETH could reach $3,500 with potential upside to $4,000.
.
.
.
⚠️ Disclaimer: This analysis is for educational purposes and not financial advice. Please do your own research and risk management.
.
✅ If you like this analysis, don't forget to like 👍, follow 🧠, and share your thoughts below 💬!
ETHUSD – Final Resistance Test Ahead Ethereum is ripping toward a major historical resistance zone between $4,000–$4,300 — a level that rejected price cleanly in both 2024 and early 2025. With momentum high and sentiment bullish, this area becomes the real test of trend strength.
Failure here could form a triple top.
Breakthrough? Expect fireworks.
#ETHUSD #Ethereum #Crypto #ResistanceZone #SmartMoney #QuantTradingPro #TradingView

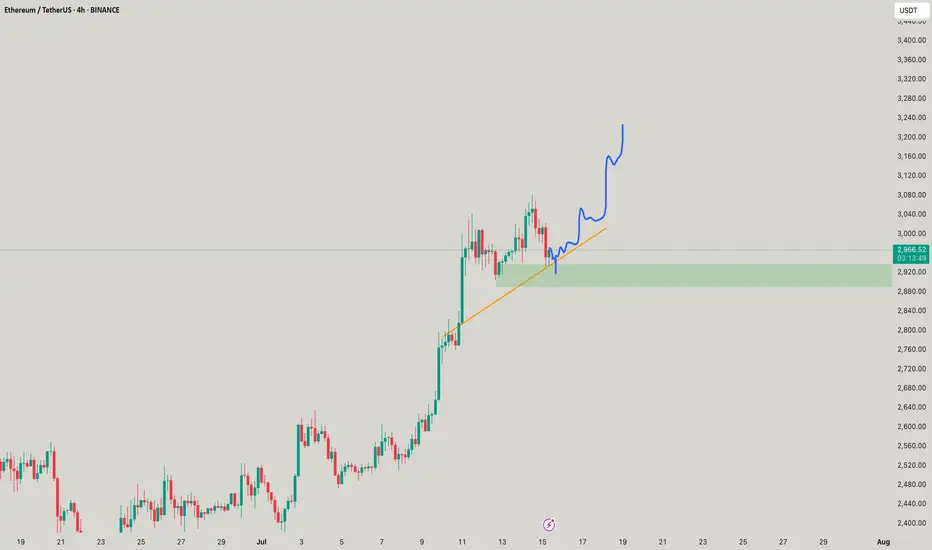
#ETH Update #3 – July 15, 2025#ETH Update #3 – July 15, 2025
After its recent impulsive move, Ethereum appeared to make a slight correction. However, this correction did not complete and instead formed a second peak. Since a full correction hasn't played out yet, caution is still warranted when trading Ethereum.
The first correction level is around $2,850, the second around $2,780, and the third around $2,700. If Ethereum pulls back to the second correction level, it will balance out the second imbalance zone created during the last impulse, which could allow for a healthier continuation upward.
As long as Ethereum doesn't break down below the $2,900 zone, I do not expect a correction. But if it does break below $2,900, corrections are likely to occur one after another.
At this point, neither a long nor a short position seems suitable for Ethereum.

ETH - Can it go $3200??Yes looks good until stays above 2890, all buys are good in this range as scalps! AWESOME aint it?
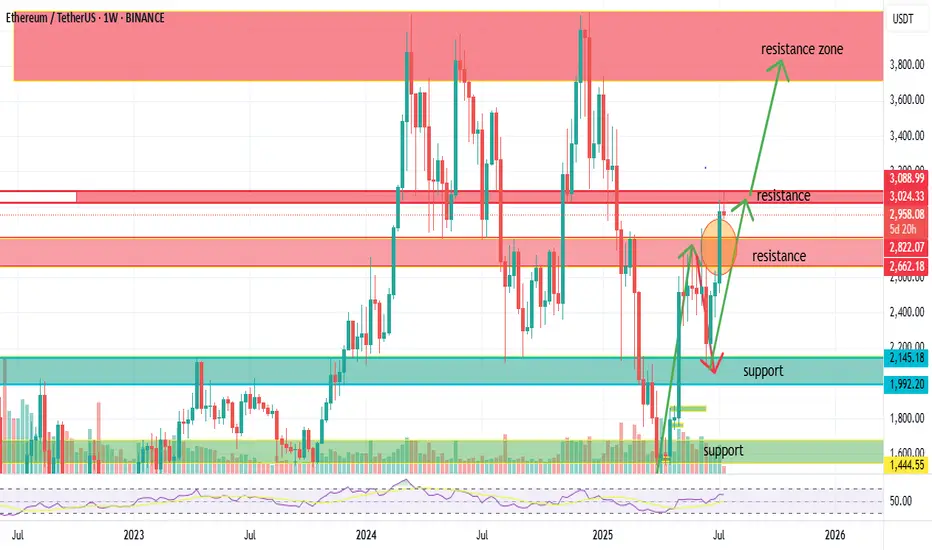
Ethereum Just Broke Out! Is $4,000 Next?Looking at the chart, ETH had a solid bounce from the key support zone around $1,992 to $2,145.
After consolidating, ETH broke above the critical resistance zone between $2,600 and $2,822 last week.
And more importantly – ✅ Last week’s candle closed firmly above this zone, backed by strong volume.
This was one of the most difficult resistance areas in recent months – and now that ETH has broken it, it’s a clear confirmation that the bullish trend is continuing.
🎯
📌 With this breakout confirmed, ETH is now targeting the next major resistance between $3,100 and $3,750.
If that area gets cleared, we could see a move toward the psychological level of $4,000.
📌 However, if ETH faces rejection at $3,100 – we may see a pullback to retest the breakout zone around $2,822 – $2,662 before another leg up.
📈
RSI is currently neutral and has room to climb – a good sign for further upside
Volume on the breakout was strong, confirming that smart money is stepping back in
🎙️
So here’s the bottom line:
✅ ETH successfully broke out of the $2,600–$2,822 resistance zone
✅ Weekly candle closed strong with high volume
✅ Uptrend looks ready to continue
🎯 Short-term target: $3,100 – $3,750
🎯 Long-term breakout target: $4,000+
📌 Support zone to watch: $2,822 – $2,662 (for potential retest)
⚠️ Disclaimer: This is just my personal analysis – not financial advice.
Always do your own research and manage risk properly!
👉 Follow Dat Vinh Airdrop for more solid crypto insights every week!
Ethereum Just Hit Resistance — Will It Explode or Recoil?Ethereum has powered through previous resistance levels, riding a clean ascending trendline and now entering a key supply zone around $3,000. While bulls have dominated the recent run, price is now brushing up against historical resistance with Stoch RSI entering overbought territory.
This is a pivotal area — if ETH breaks through with volume, the next target sits near $3,400–$3,700. But if momentum fades, a pullback into the $2,800 zone or even a retest of trendline support could offer better entries.
Momentum is hot, but traders should stay sharp — this zone has rejected price before. Smart money watches reactions, not just breakouts.
