Ethereum (ETH): Still Cheap Don't You Think? | $2800 NextEthereum is still cheap compared to what is about to happen. Now saying "about to happen" is a little broad, saying as it might be weeks or months until we see the full potential of ETH but we are bullish for sure.
Bitcoin had its moment of money inflow and now money has to flow somewhere else, which should be ETH. This is the next stage for the bull market and that's what we are looking for.
Targeting currently $2800, but overall we want to see at least $4000.
Swallow Academy
ETHUSDT.P trade ideas

ETH Needs big money injection ASAPRising wedge presented in the chart is a bearish pattern.
To cancel this bearish pattern we need :
- Break the $2,800 level with bigh green candle
- The break should occur with big volume
- The break should be as soon as possible.
Otherwise, the downtrend will continue and he decline will be sharp.
COINBASE:ETHUSD BITSTAMP:ETHUSD CRYPTOCAP:ETH CRYPTOCAP:ETH.D

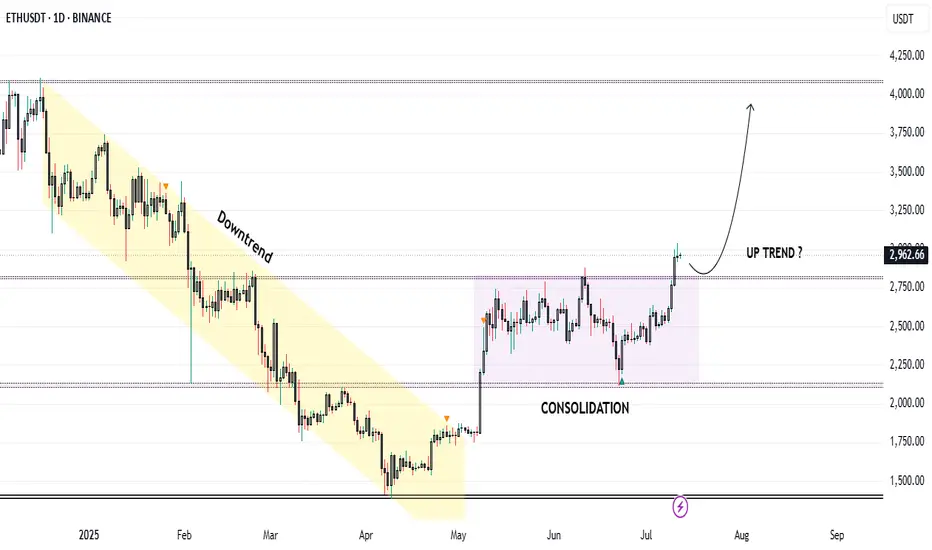
Trend Resumes: Ethereum Breaks Consolidation, Eyes $4050Market Structure Overview:
Markets typically move in two major phases:
🔹 Trend Phase (directional movement)
🔹 Consolidation Phase (sideways movement or accumulation/distribution)
These phases repeat as: Trend → Consolidation → Trend → Consolidation
Ethereum Price Action Breakdown (Daily Timeframe):
Mid-December to End-April: Clear downtrend phase.
May to Early July: Entered a consolidation zone, forming a tight range.
Current Status (July):
🔹 Ethereum has broken out of the consolidation range.
🔹 Currently trading around $3000, confirming strength.
🔹 This breakout may potentially signal the start of Altcoin Season.
Trade Setup – Long Position Idea:
Entry (Buy Zone): Around $2850 (retest of breakout resistance).
Target:
🔹 Primary Target: $4050
🔹 This aligns with a major resistance and Fibonacci extension zone.
Stop Loss: $2600 (below key structure support).
Technical Confluences:
* Breakout above multi-week range.
* Retest of resistance turned support at \$2850.
* Psychological round level near \$3000 acting as a magnet.
* Volume confirmation on breakout (optional to mention if on chart).
Risk Note:
⚠️ Caution: The Market may turn volatile due to unexpected geopolitical or macroeconomic news. Always follow risk management and avoid overleveraging.
Conclusion:
Ethereum’s breakout from a multi-month consolidation phase indicates a potential shift in momentum. If retest levels hold, this could be the beginning of a strong upside rally, possibly leading to a broader Altcoin Season. Traders can position themselves accordingly with a well-defined risk-reward setup.
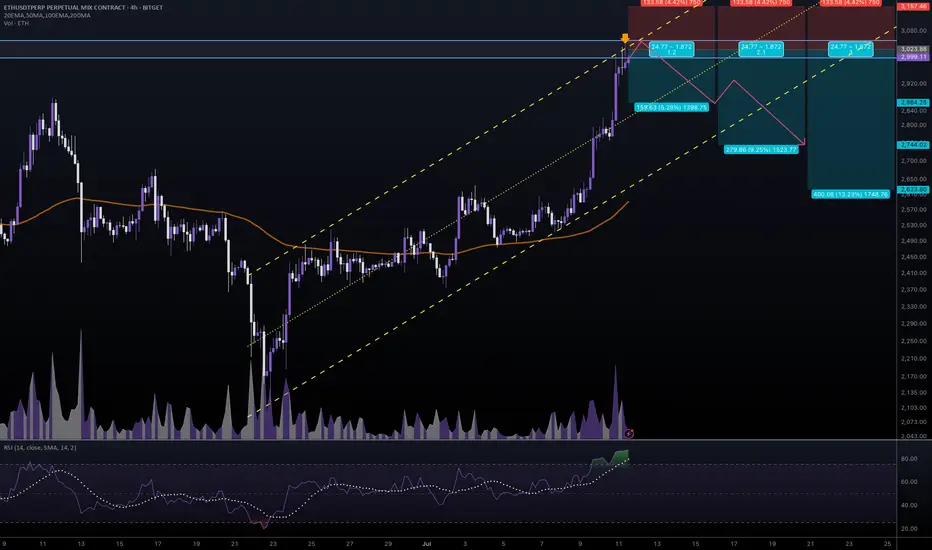
#ETHUSDT #4h (Bitget Futures) Ascending channel on resistanceEthereum printed a gravestone doji followed by a shooting star, RSI is overbought, local top seems in.
⚡️⚡️ #ETH/USDT ⚡️⚡️
Exchanges: Bitget Futures
Signal Type: Regular (Short)
Leverage: Isolated (9.0X)
Amount: 5.0%
Entry Zone:
2996.99 - 3050.49
Take-Profit Targets:
1) 2864.25
2) 2744.02
3) 2623.80
Stop Targets:
1) 3157.46
Published By: @Zblaba
CRYPTOCAP:ETH BITGET:ETHUSDT.P #4h #Ethereum #PoS ethereum.org
Risk/Reward= 1:1.2 | 1:2.1 | 1:3.0
Expected Profit= +47.5% | +83.3% | +119.0%
Possible Loss= -39.8%
Estimated Gaintime= 1-2 weeks
Why You Still Lose Money Even With Perfect AnalysisYour setup was on point, your entry was clean, your stop-loss was tight.
Everything looked perfect.
And yet, you still lost.
Maybe the real issue isn’t in your chart, maybe it’s in your head.
Hello✌
Spend 3 minutes ⏰ reading this educational material.
🎯 Analytical Insight on Ethereum:
BINANCE:ETHUSDT is currently trading inside a well-defined parallel channel 📈. It is approaching a key daily support level that coincides with an important ascending trendline. A breakout above this channel could lead to a bullish move, targeting at least a 16% gain with a primary resistance zone near $2900 🚀. Monitoring how price reacts around this area will be critical for confirming the next leg up.
Now , let's dive into the educational section,
🧠 Analysis Is Half the Game
Having a clean technical analysis doesn’t guarantee anything if your behavior ruins it.
Most traders change their minds mid-trade because of fear, hope, or noise from other sources.
Market psychology doesn’t always respect your Fibonacci retracement. You might be right and still lose because you couldn’t hold on to the plan.
🕒 Don’t Enter Before the Market Does
Timing is underrated. Many traders get in too early. Your analysis may predict a breakout, but price isn’t ready yet.
Zoom out. A solid setup on the 1-hour chart might need confirmation from the 4-hour or daily.
A great trade is not just where you enter, but when.
😤 It’s Not the Chart — It’s Your Mind
Many times, the chart setup is perfect. But when price wobbles a bit, you lose confidence.
Imagine this: a clean uptrend, higher highs forming, but a small retracement hits and you close the trade. Why? Fear. Not logic.
You lost not because of analysis, but because you couldn’t handle being right under pressure.
📊 TradingView Tools: More Than Just Indicators
If all you're using in TradingView are the typical RSI or MACD indicators, you're barely scratching the surface.
Tools like Bar Replay can simulate real-time reactions to past price action, not just for backtesting, but for testing your discipline under real psychological pressure.
Try this: pick a point where you lost money despite solid analysis. Use Bar Replay and “re-live” the chart without knowing what happens next. Was your entry early? Did you panic exit? Or did your stop-loss placement ignore structure zones?
Also, use the Long/Short Position Tool to visually plan your risk/reward, and adjust your bias if the chart structure doesn’t validate it.
For those wanting a deeper layer, add Volume Profile Fixed Range to identify value zones, where whales are active, and overlay it with your own trade setup.
TradingView isn’t just a charting platform. It’s a behavioral mirror. You don’t just look at the chart, it shows how you act when money’s on the line.
🎯 Your Stop-Loss is for the Chart, Not Your Emotions
If your stop-loss is placed based on what feels safe rather than key market structure, you’re not trading the chart. You’re managing anxiety.
Let structure dictate where your risk lies, not your nerves.
😬 Not Executing = Not Trading
If you don’t follow through with your own trade plan, your analysis is meaningless.
Did you cut early just because a big red candle scared you? Or because someone tweeted a bearish take?
That’s not discipline, that’s reactive trading. It has nothing to do with your original logic.
📉 Losses Are Part of Trading… But Not These Ones
There’s a difference between calculated losses and emotional mistakes.
The first is expected, even professional. The second will drain your account and confidence.
Take losses when the plan fails, not when your emotions freak out.
🔍 Reverse-Engineer Your Entry Logic
Next time you trade, take a screenshot and write down your full reasoning.
Why this entry? What did you see? How will you exit?
Later, go back and compare it to what actually happened.
This habit alone can fix more issues than a dozen trading books.
💡 Perfect Analysis ≠ Profitable Trading
Analysis opens the door, but execution and consistency keep you in the room.
Most traders think the problem is their indicator, but it’s usually the part of themselves that doesn’t listen to the indicator at the critical moment.
🧠 The Power of “Logged Experience”
The real difference between amateurs and veterans isn’t screen time. It’s tracked behavior.
Use TradingView’s built-in Note feature, place icons or comments on every trade setup, and keep a record of your actual thought process.
That feedback loop is gold. It builds self-awareness, the rarest edge in trading.
📺 Make It Visual to Make It Stick
Don't rely solely on indicators.
Use Chart Pattern Drawing Tools, head and shoulders, flags, triangles, and reinforce visual memory.
Also, by managing Visibility Settings, you can keep your charts clean while viewing different structures across timeframes.
The result? You start to see the story behind price, not just numbers.
🔚 Final Thought
If you're still losing money with accurate analysis, maybe it’s time to analyze your reactions instead.
TradingView gives you the tools, but the real upgrade is learning to trust your system under stress.
✨ Need a little love!
We put so much love and time into bringing you useful content & your support truly keeps us going. don’t be shy—drop a comment below. We’d love to hear from you! 💛
Big thanks , Mad Whale 🐋
📜Please remember to do your own research before making any investment decisions. Also, don’t forget to check the disclaimer at the bottom of each post for more details.

ETH Gearing Up for Lift-Off — Eyes on $4,000+ETH Weekly Outlook
ETH is currently trading around $2,660 on the weekly timeframe and holding up well at these levels.
If the momentum continues, the upper resistance zone near $3,550 could act like a magnet — pulling price higher. A breakout above this zone may trigger a strong rally toward $4,000+.
And when ETH starts to move big… altcoins usually follow.
Keep an eye on it. The next few weeks could get interesting.
DYOR, NFA

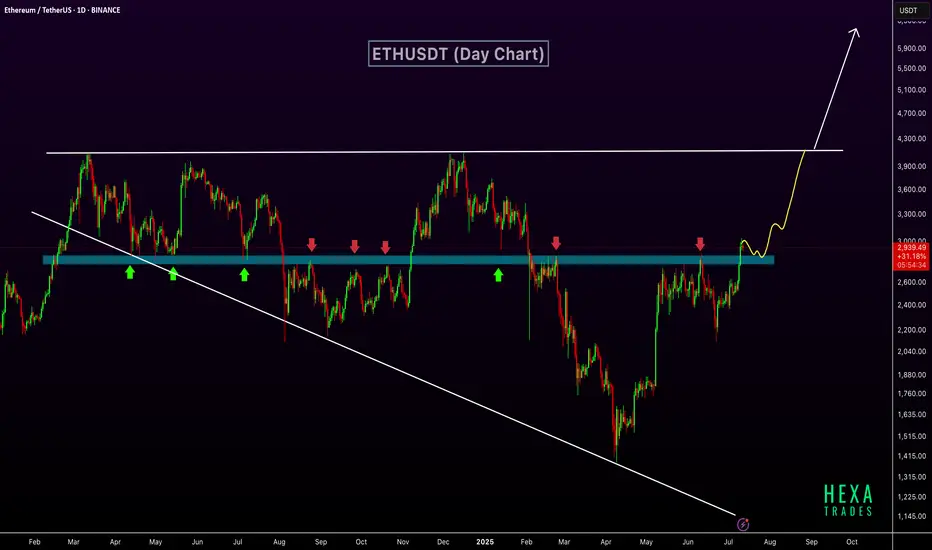
ETH Breaks Key Resistance – $6K Possible if Wedge BreaksETHUSDT has broken out above a key horizontal resistance zone that has historically acted as a strong support and resistance level. This zone, marked in blue, has seen multiple rejections and bounces over the past year, confirming its significance.
The recent breakout above this zone indicates a shift in market structure and suggests growing bullish momentum. The price action shows a clean move above resistance, with potential for a retest before continuing higher. The market is also forming a long-term broadening wedge pattern. The next target lies near the upper resistance of the wedge, around $4,000. If the price breaks above this broadening wedge, it could open the path toward the $6,000 level.
Regards
Hexa
ETHUSDT Long Term Structure Signals Imminent ExpansionEthereum has been consolidating within a large-scale symmetrical pennant formation following its peak at $4,851. This macro structure, spanning several years, reflects sustained accumulation within a clearly defined corrective range, bounded by well-established trendline support and resistance.
After reaching its all-time high, ETH entered a structured correction that has unfolded into what appears to be an ABCDE wave pattern. Currently, price action is developing near point D, approaching the upper boundary of the pennant a crucial area that could define the next directional move.
In addition, the daily chart presents a developing Inverse Head and Shoulders (IH&S) pattern, with the neckline anchored around $2,855. This level is acting as a key resistance, temporarily halting ETH’s short-term upside. A confirmed breakout above the neckline would likely validate both the IH&S and the breakout from wave D, setting the stage for a potential expansion move toward the $6,000 target and beyond.
However, in the event of a temporary rejection at the neckline or pennant resistance, a retracement toward wave E becomes likely. This would bring price back into the $1,400–$1,800 support region a high-confluence demand zone that aligns with the long-term ascending trendline, previous breakout levels, and multiple historical reaction points. This zone may serve as a base for a strong bullish reversal.
Recent price behavior shows compressed volatility and increased buying interest on dips, reinforcing the possibility of an imminent directional breakout. A decisive move outside this macro structure may mark the beginning of a new phase of long-term price expansion.
Share your view with us in the comments, how do you see ETH playing out from here?

Ethereum (ETH): Buyers Showing Dominance | $2800 IncomingBuyers are doing a great job currently, keeping the price above the EMAs (which also have been marked by us as a retest area after we did that break of structure on the 2nd of July).
Now as long as we are above our buy zone, we are bullish on ETH. As many know, we are far away from the potential of ETH and the first target is at $2800-$3000.
Swallow Academy

Ethereum (ETH): Will Say It Again $2800 Is Scripted!Ethereum buyers are dominating currently, with the price climbing closer and closer to our major target of $2800.
What to pay attention to are the 100 and 200 EMAs, where usually once we have shifted apart from them, we have seen some kind of correctional movement if buy-side momentum is lost so that's what we are keeping an eye on.
If we see currently further buy-side pressure, then we might reach our target within this week, but if sellers take even slight control, we most probably will retest the EMAs before another attempt to upper zones.
Swallow Academy

ETHEREUM DAILYETHEREUM DAILY CONFIRMATION FOR LONG IS NOT APPROVED YET.BE PATIENT
Ethereum Approximately $2,930.55 per ETH, watch for 30754 ascending trendline breakout or pull back into 2680 zone ,if we keep buying then 4100 zone will be on the look out as immediate supply roof break and close will expose 4900.my goal in this context is to see ETHUDT buy into my purple supply roof,it will happen .
Market Capitalization: Around $358 billion, making Ethereum the second-largest cryptocurrency by market cap.
Circulating Supply: About 120.7 million ETH.
Recent Performance: Ethereum has gained roughly 17.3% over the past week and about 7% over the last month, though it is down about 4% compared to one year ago.
Market and Technical Overview
Ethereum remains a key player in the blockchain ecosystem, supporting decentralized finance (DeFi), NFTs, and smart contract applications.
The price is consolidating near the $3,000 level, with technical indicators suggesting moderate bullish momentum but some short-term volatility.
Trading volume in the last 24 hours is around $29 billion, indicating strong liquidity and active market participation.
Ethereum continues to be a foundational blockchain platform with strong institutional interest and ongoing development, maintaining its position as a major digital asset in 2025.
#ethusdt #btc #bitcoin

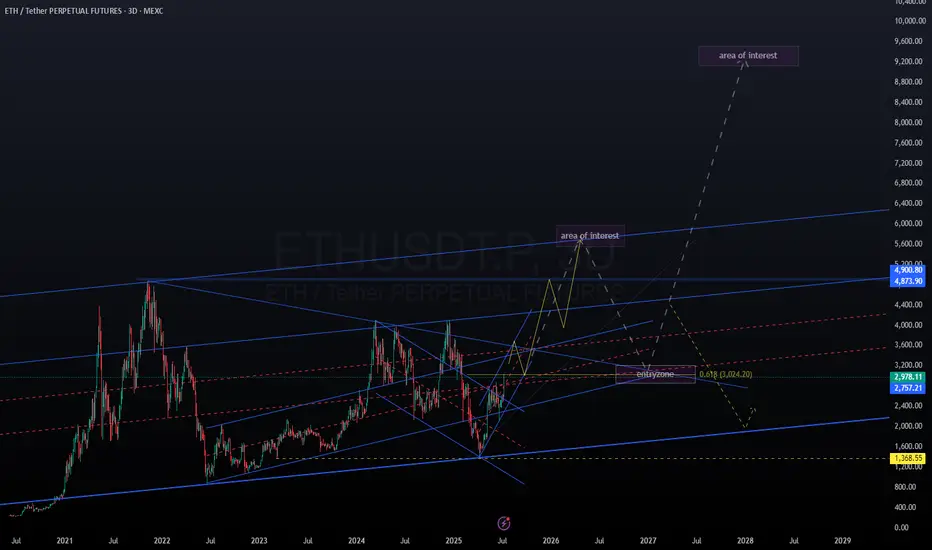
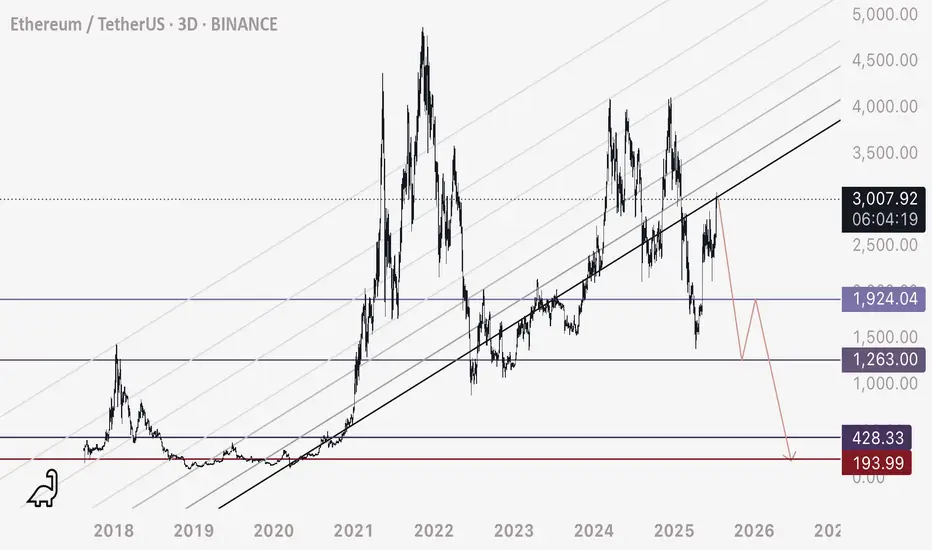
ETH long term outlook 2025-2028 (crystal ball version)Based on time fibs and fib projections.
No financial advice.
If ETH pushes up, looking at a pull back starting early to mid september, then retrace to 0.5 fib and push up into dec. After which possibly come back and test the 4k area where price broke out from. Next push up with a top in Mar/April.
The next is purely speculative (as is this whole post).
Deep retrace after local top in April26, to the 3k level.
If price finds support at 3k, then the next leg up has a chance at 9k end of 2027, Jan 2028.
Otherwise, if support doesn't hold, continuation down into bear market.
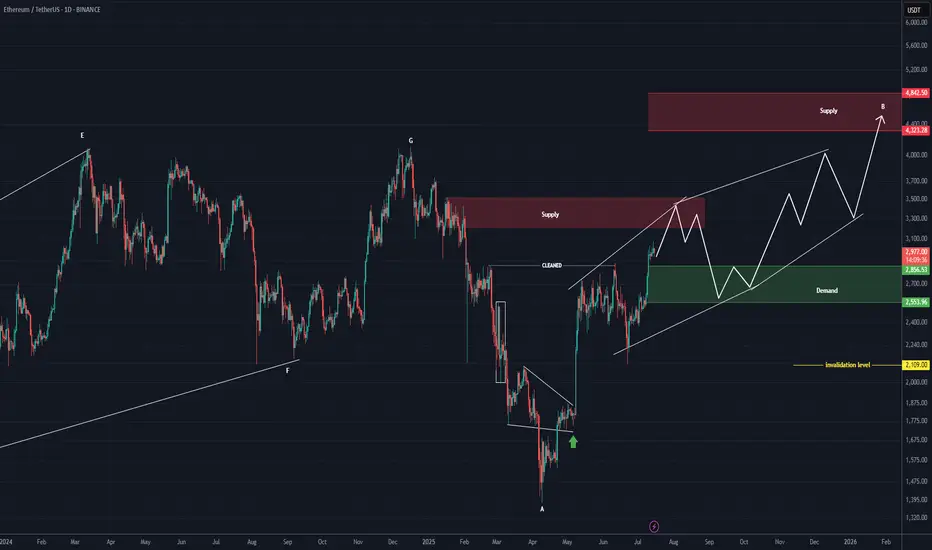
ETHEREUM Roara Map (1D)The previous phase of Ethereum appears to have been a completed diametric, and now it seems we are in a flat pattern.
It can be said that we are currently in wave B of the flat, which itself appears to be a diametric.
This diametric could even extend to the 4300–4800 range.
The green zone is the rebuy area.
A daily candle close below the invalidation level would invalidate this analysis.
For risk management, please don't forget stop loss and capital management
Comment if you have any questions
Thank You
ETHEREUM ETHEREUM DAILY CONFIRMATION FOR LONG IS NOT APPROVED YET.BE PATIENT
Ethereum Approximately $2,930.55-2,925$ per ETH, watch for 30754 ascending trendline breakout or pull back into 2680 zone ,if we keep buying then 4100 zone will be on the look out as immediate supply roof break and close will expose 4900.my goal in this context is to see ETHUDT buy into my purple supply roof,it will happen .
Market Capitalization: Around $358 billion, making Ethereum the second-largest cryptocurrency by market cap.
Circulating Supply: About 120.7 million ETH.
Recent Performance: Ethereum has gained roughly 17.3% over the past week and about 7% over the last month, though it is down about 4% compared to one year ago.
Market and Technical Overview
Ethereum remains a key player in the blockchain ecosystem, supporting decentralized finance (DeFi), NFTs, and smart contract applications.
The price is consolidating near the $3,000 level, with technical indicators suggesting moderate bullish momentum but some short-term volatility.
Trading volume in the last 24 hours is around $29 billion, indicating strong liquidity and active market participation.
Ethereum continues to be a foundational blockchain platform with strong institutional interest and ongoing development, maintaining its position as a major digital asset in 2025.
#ethusdt #btc #bitcoin

ETH - Potential Cycle Top hereETH is showing a potential cycle top per this parallel ascending channel.
Resistance would be around 3020 zone - if the channel breaks down, we may see these ultra low zones get hit if the macro landscape supports such a drastic fall.
Happy trading.
Ethereum (ETH): $2800 Reached | Targeting $3200-$3300 NowEthereum did a really good bounce from the local support area, where buyers still keep the momentum as of now.
As our target got reached, we also noticed that buyers are not reducing the pressure to the resistance zone, which means most probably we are about to break out from that smaller sideways channel.
If we see a break from here, our target is set to $3200-$3300.
Swallow Academy

ETH is testing resistance. False breakout?ETH is gathering liquidity ahead of a possible decline
The gray square is the active buying zone. When the price returned below the 3040 level, a liquidation phase occurred. Against the backdrop of the news, a retest of resistance is forming, but not with the aim of breaking through the level, but with the aim of gathering liquidity for a move to 2960-2913.
A false breakout of resistance could trigger another phase of liquidation (correction) to 2961. A halt should be expected in the 2900 zone.

ETH Building Blocks - Keep it Simple🧱 Building Block - ETH Weekly Analysis 🧱
Ethereum has been trading within a well-defined structure, respecting key horizontal zones — each acting as a crucial building block in ETH’s macro journey.
🔹 Zone 1 ($1,700 - $2,100)
A strong demand and accumulation zone. ETH bounced from here multiple times, proving itself as the foundation of the current bullish attempt.
🔹 Zone 2 ($2,400 - $2,600)
We're currently hovering around this key mid-range resistance. A successful break above it would pave the way for the next major leg up.
🔹 Zone 3 ($2,900 - $3,400)
A major historical resistance turned supply area. ETH needs strong momentum and volume to break through this ceiling.
🔹 Zone 4 ($3,800 - $4,200)
The final building block before retesting ATH territory. A retest here could signal full bullish control in the coming months.
📍 As long as Zone 1 holds, ETH remains structurally bullish. Watch for breaks and rejections at each building block to gauge the next move.
Which block will ETH break next? 🔮
📚 Always follow your trading plan regarding entry, risk management, and trade management.
Good luck!
All Strategies Are Good; If Managed Properly!
~Rich

ETHEREUMEthereum Approximately $2,967.55 per ETH, watch for 30754 ascending trendline breakout or pull back into 2680 zone ,if we keep buying then 4100 zone will be on the look out as immediate supply roof break and close will expose 4900.my goal in this context is to see ETHUDT buy into my purple supply roof,it will happen .
Market Capitalization: Around $358 billion, making Ethereum the second-largest cryptocurrency by market cap.
Circulating Supply: About 120.7 million ETH.
Recent Performance: Ethereum has gained roughly 17.3% over the past week and about 7% over the last month, though it is down about 4% compared to one year ago.
Market and Technical Overview
Ethereum remains a key player in the blockchain ecosystem, supporting decentralized finance (DeFi), NFTs, and smart contract applications.
The price is consolidating near the $3,000 level, with technical indicators suggesting moderate bullish momentum but some short-term volatility.
Trading volume in the last 24 hours is around $29 billion, indicating strong liquidity and active market participation.
Ethereum continues to be a foundational blockchain platform with strong institutional interest and ongoing development, maintaining its position as a major digital asset in 2025.
#ethusdt #btc #bitcoin

HolderStat┆ETHUSD retest of the resistance lineBINANCE:ETHUSDT has exited a falling wedge and is forming a bullish continuation pattern. With price action building above $2,500, a breakout toward $2,800 is in play, targeting the supply zone around $3,000. Structure favors bulls.

Ethereum Wave Analysis – 9 July 2025- Ethereum broke the resistance area
- Likely to rise to resistance level 2885.00
Ethereum cryptocurrency recently broke the resistance area located between the resistance level 2645.00 (which stopped wave 1 at the start of July) and the resistance trendline of the weekly Triangle from January.
The breakout of this resistance area accelerated the active short-term impulse wave 3 of the intermediate impulse wave (3) from June.
Given the strongly bullish sentiment seen across the crypto markets today, Ethereum cryptocurrency can be expected to rise to the next resistance level 2885.00 (top of wave (1) from June).

ETH/USDT 1W Chart📊 Trend structure (Price Action)
Downtrend (historical):
A series of Lower Highs (LH) and Lower Lows (LL) — a classic downtrend.
Confirmed by the orange downtrend line.
A change in structure — a possible beginning of an uptrend:
A Higher Low (HL) has recently been formed after a Lower Low (LL).
Suggests a possible end to the downtrend and an attempt to break out upwards.
Currently:
The price is testing the upper downtrend line.
A breakout above the orange line may confirm a trend change.
🟢 Key Resistance Levels (Green Lines):
Level Meaning
3.058 USDT Potential target after a breakout from consolidation
2.767 USDT Nearest strong resistance - currently being tested
3.427 USDT Deep resistance level from the previous high (HH)
🔴 Key Support Levels (Red Lines):
Level Meaning
2.234 USDT Nearest support - previous breakout
1.883 USDT Early 2023 support
1.507 USDT Local bottom
1.204 USDT Historical support - LL extreme
📉 Stochastic RSI (Momentum Indicator):
Currently in the overbought zone.
This may suggest a short-term correction before an actual breakout.
However, in a strong uptrend, the indicator may "hang out" in the overbought zone for a long time.
📈 Potential scenario:
If the breakout above 2.767 and the orange trendline holds:
A possible move to 3.058 USDT as the first target.
Extended target: 3.427 USDT (HH).
If the breakout fails:
Correction to 2.234 USDT or lower.
There is a risk of returning to a downtrend.
✅ Bullish signals:
Higher Low (HL) formation after Lower Low (LL).
Testing the upper downtrend line with an attempt to breakout.
Volume is increasing (based on candles).
⚠️ Bearish threats:
Stochastic RSI in the overbought zone.
Breakout not confirmed by 100% (needs a weekly closing candle above 2.767).
Resistance at 3,058 could halt the move.
📌 Conclusion:
Ethereum (ETH) could be on the cusp of a new uptrend, but a breakout above 2,767 USDT is needed for confirmation. If it does, a move to 3,058 and then 3,427 is possible. However, the current overbought level on the Stochastic RSI could signal a short-term correction before the trend gains strength.

Ethereum (ETH): Time For Ethereum To Shine | $3300-$3400The daily timeframe is showing no remorse to sellers, with buyers strongly dominating the zones after a local resistance area near $2800 was broken.
After that breakout we had a smaller sideways consolidation movement, here we formed a proper BOS and now price is heading towarsd the upper zones. we are tergeting the $3300 to $3400 are as of now, where we might see another sideways movement before a breakout.
Swallow Academy
