HolderStat┆ETHUSD reboundedCRYPTOCAP:ETH exploded out of its multi-month falling wedge, racing from 1.8 k to 2.7 k. It now straddles the broken wedge roof plus a fresh rising guide at 2.45-2.50 k. Hold that shelf and the chart still projects into the 2.9-3.0 k sell zone; slip beneath 2.35 k and bulls will likely regroup at deeper support near 2.2 k. 🎯
ETHUSDT.P trade ideas
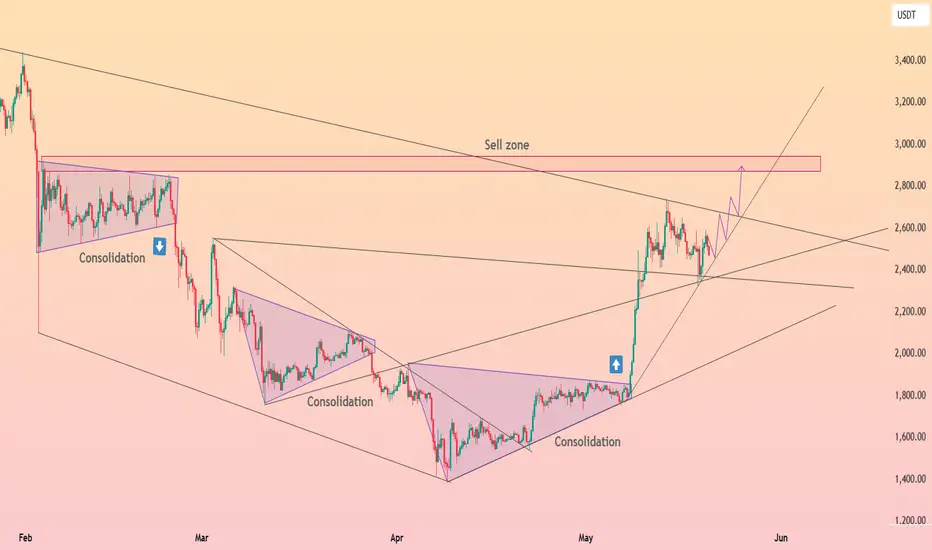
ETHUSDT is Breaking Out!! Is the Bull Run Finally Here?After a long period of consolidation within a descending channel, BINANCE:ETHUSDT is showing signs of life as it finally breaks out with bullish intent. This technical breakout could mark the beginning of a fresh bull run, reminiscent of past explosive moves we’ve seen from MARKETSCOM:ETHEREUM following major corrections. Historically, CRYPTOCAP:ETH has experienced drawdowns of over 90%, only to bounce back stronger and reach new all-time highs.
Currently, BITSTAMP:ETHUSD remains deep in the oversold zone, suggesting it’s still undervalued relative to its potential. As momentum begins to pick up, we could see targets being hit one by one, driven by renewed investor interest and favorable market conditions.
Moreover, the recent surge in COINBASE:ETHUSD ETF inflows adds fundamental weight to the technical setup. This institutional participation could act as a catalyst for a sustained rally, reinforcing the bullish bias.
That said, risk management is key. Always trade with a clear stop loss and position sizing to protect capital. The opportunity is brewing – the question is, are you ready to ride the wave?
BYBIT:ETHUSDT Currently trading at $1790
Buy level : Above $1750
Stop loss : Below $1490
Target : $4000
Max leverage 3x
Always keep stop loss
Follow Our Tradingview Account for More Technical Analysis Updates, | Like, Share and Comment Your thoughts

Ethereum (ETH): Looking For Re-Test Before Next Major MoveSeeing the slight overweight by buyers, we are still looking for our local resistance zone to be retested, considering the current demand for upward movement on the socials. We are waiting for that resistance to be touched, after which we will be monitoring the price development and seeing if we get any proper breakouts with retests from there (PLAN A), or we see a good rejection and MSB to form (PLAN B).
Swallow Academy

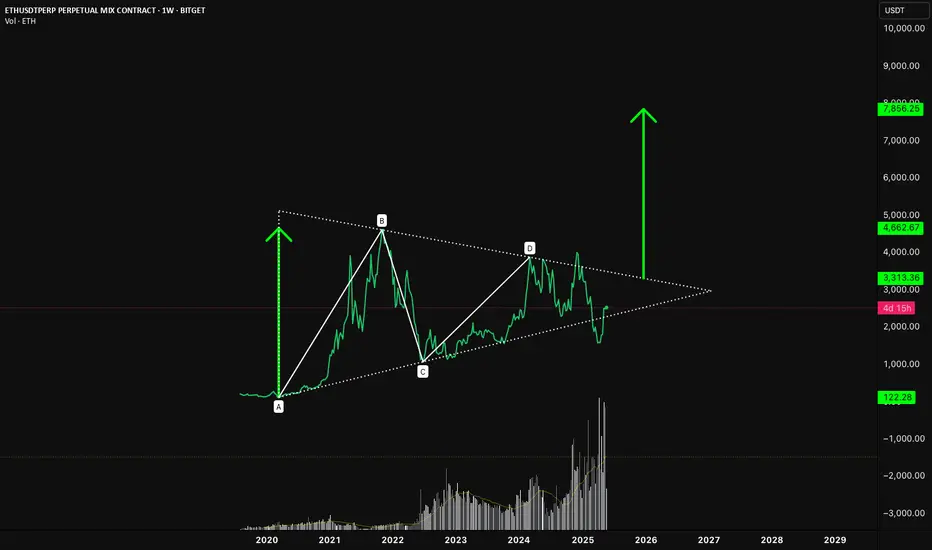
ETH/USDT – The Ethmuda TriangleZoom out.
Since the 2021 highs, Ethereum has spent years grinding sideways, printing what now looks like a textbook symmetrical triangle. Labeled here as an ABCD compression pattern, this structure has been tightening since the macro top (B), slowly building energy within narrowing volatility.
🔺 Structure Breakdown:
• A to B: The explosive bull run from the March 2020 low to the all-time high.
• B to C: A deep correction that shook out weak hands and set the bottom.
• C to D: A multi-year coil of consolidation, forming higher lows and lower highs.
• D to ?: We’re now nearing the apex, where compression typically leads to expansion.
📍 The Trigger Zone
The key level to watch is $4,000–$4,200. A clean breakout above this zone would invalidate the downtrend line and break the triangle to the upside. From a pattern-measured move perspective, the height of the triangle (A to B) projected from the breakout point suggests potential upside into the $7,800–$8,000 region.
🧠 Why This Matters
• Volume has been tapering throughout the structure — classic behaviour in large triangles.
• Market sentiment remains uncertain, making a breakout all the more impactful.
• Ethereum fundamentals are arguably stronger than they were in 2021 — Layer 2s, institutional use cases, and new ETH ETF speculation all add fuel.
📊 Potential Target:
• Immediate resistance: $3,300
• Breakout trigger: $4,000–$4,200
• Projected move: ~$8,000
🕰️ When? Well.. who knows but it does sort of line-up with my previous idea using a SOL/USDT chart that says early next year.. and not this year.
This is the type of setup plays out pretty well on lower timeframes, why not a massive one? The real question is: Are we on the verge of expansion after compression?
Let the chart do the talking.
⚡️ Not Financial Advice

Decoding Momentum with Precision: Absolute Strength HistogramMomentum is more than just a buzzword—it’s the pulse of price action. The Absolute Strength Histogram v2 is a powerful open-source indicator that brings that pulse to life, helping traders visualize the ongoing tug-of-war between bulls and bears with clarity and precision.
In this post, we’ll explore how this tool works, how we use it at Xuantify, and how you can integrate it into your own trading strategy to sharpen your edge.
🔍 What Is the Absolute Strength Histogram ?
Originally developed by jiehonglim , this indicator is a refined version of the classic Absolute Strength Histogram. It measures the relative strength of buyers and sellers and plots it as a color-coded histogram.
Key Features:
Color-coded bars to reflect bullish or bearish dominance
Clear visual cues for trend strength and exhaustion
Helps identify trending vs. ranging market conditions
Open-source and customizable
Unlike traditional oscillators, this histogram doesn’t just show overbought or oversold—it shows who’s in control , and how strongly.
🧠 How We Use It at Xuantify
At Xuantify, we use the Absolute Strength Histogram as a momentum confirmation tool within our multi-layered trading models. Here’s how:
1. Trend Confirmation
We look for alignment between price structure and histogram color. For example, if price breaks structure to the upside and the histogram turns green and rising, that’s a strong confirmation of bullish momentum.
2. Divergence Detection
When price makes a new high but the histogram prints a lower high, it signals momentum divergence —a potential early warning of reversal.
3. Range Filtering
Flat or alternating histogram bars often indicate a ranging market . We avoid trend trades during these periods and instead look for mean-reversion setups.
🧩 New: Pivot High/Low Overlay for Reversal Clarity
To make the Absolute Strength Histogram even more actionable, we’ve added a custom Pivot High/Low indicator that visually marks key swing points on the chart. This addition helps traders clearly see how the histogram behaves before, during, and after reversals .
Below an example of HTF 4H used as stronger trade confirmation:
Why this matters:
It highlights where momentum shifts align with structural turning points
It helps validate divergence signals from the histogram
It makes backtesting and visual analysis much easier
How to use it:
Watch for histogram color or slope changes near pivot highs/lows
Look for divergence between price and histogram at these pivots
Use the pivot zones as potential entry or exit points when confirmed by momentum
🔄 Does It Repaint?
One of the most common concerns with momentum indicators is whether they repaint —meaning they change past values based on future price action. The Absolute Strength Histogram is designed to be non-repainting .
Once a histogram bar is printed, it remains fixed, making it suitable for real-time decision-making and reliable backtesting . This gives traders confidence that what they see on the chart is what actually happened in the moment—not a hindsight illusion.
⚙️ Settings That Matter
The indicator comes with several adjustable parameters, but one of the most impactful is the “Indicator Method” setting.
Our recommendation:
Set Indicator Method = STOCHASTIC for smoother, more responsive signals
This setting tends to reduce noise and better capture momentum shifts
It works especially well in combination with structure-based entries
Other useful settings include:
Length – Controls the sensitivity of the histogram
Smoothing – Helps reduce choppiness in volatile markets
Color thresholds – Customize visual cues for easier interpretation
⚙️ Best Combinations with This Indicator
To maximize its effectiveness, we combine the Absolute Strength Histogram v2 with:
Market Structure Tools – Like BOS/CHOCH from LuxAlgo Smart Money Concepts
Volume Profile – To confirm strength around key volume nodes
Fair Value Gaps (FVGs) – For precision entries when histogram confirms direction
RSI or Stochastic – For additional momentum or exhaustion confirmation
This layered approach helps us filter out noise and focus only on high-conviction trades .
⚠️ What to Watch Out For
No indicator is perfect. The Absolute Strength Histogram can sometimes lag slightly in fast-moving markets. It’s best used as a confirmation tool , not a standalone signal generator.
Also, in low-volume or choppy conditions, the histogram may give mixed signals. Always combine it with structure and context.
🚀 Final Thoughts
The Absolute Strength Histogram is a clean, intuitive, and powerful tool for traders who want to see momentum clearly . Whether you’re a trend trader, scalper, or swing strategist, this indicator can help you stay on the right side of the market.
At Xuantify, we’re all about combining simplicity with precision. This tool fits that philosophy perfectly.
Add it to your chart, test it, and see how it sharpens your edge.

ETHEREUM Long Outlook – Grand Supercycle Perspective(2025.05.21)Hello everyone,
This is SeoVereign, operator of the SeoVereign Team.
Today, I would like to share an Ethereum analysis based on the daily (1D) chart for the first time in a while.
Before reading this post, please refer to the idea I uploaded on April 18, 2025, through the link below. It will help you better understand the context:
🔗
(Clicking the image will take you to the corresponding link.)
If you look at the April 18 idea, you’ll see that I presented a bullish outlook based on the Deep Crab pattern.
This analysis is a continuation of that idea.
Through years of research, I’ve observed that when a Deep Crab pattern sees a rebound from the PRZ (Potential Reversal Zone), the trend that begins from that point tends to extend for a long time.
If you look closely at the chart, you’ll also see the 2.24 Fibonacci extension level.
Some people messaged me saying, “Since it went above 1.902 and even exceeded the 2.0 Fibonacci line, isn’t this Deep Crab invalid?”
However, I’ve studied harmonic patterns in depth for a long time and have set my own Fibonacci criteria based on that research.
In this particular Deep Crab case, I define the invalidation level as 2.24.
Therefore, I judged that the pattern is still valid, and this allowed me to forecast a long-term bullish trend.
Back to the main point,
Based on this Deep Crab pattern, I’ve consistently maintained a bullish outlook on the daily chart,
and so far, there have been no clear signals indicating a reversal into a bearish trend.
Thus, I would like to post a continuation of the bullish outlook on the daily chart.
On May 19, 2025, there was a sharp drop around the 2,587 USDT level.
At that time, our team expected the bullish trend that started from around 2,447 USDT to hold its low and continue.
However, the price broke below 2,447 USDT and made a new low.
We then closely monitored Bitcoin’s movement in response.
Typically, strong volatility occurs before a major trend begins.
Bitcoin was also showing significant volatility at the time.
So we concluded: “Let’s maintain a bullish stance, but do not be fully convinced until the previous high of 2,587 USDT is clearly broken upward.”
And by the time this post is published, we’ve confirmed that the price has indeed broken above 2,587 USDT.
Therefore, I have come to the conclusion that the bullish trend is still valid.
Based on this, I present the following three target levels.
🎯 SeoVereign’s Ethereum Bullish Targets
1st Target: 3,000 USDT
2nd Target: 3,400 USDT
3rd Target: 3,700 USDT
The market still shows strong volatility.
I sincerely hope you all trade wisely and calmly, achieving great returns,
and may great fortune be with you both in trading and in life.
I’ll see you again in the next daily analysis.
Thank you.
- SeoVereign

ETH 4H LONG SETUPCRYPTOCAP:ETH has bounced off 4H trend support and is coiling into a falling wedge—volatility is low, so a sharp move is likely.
1. Context & Structure
• Rejection off trendline at ~$2,516.50 (diagonal resistance)
• Price contained in a tightening wedge after correction
• Holding above wedge support since the last low
2. Key Levels
• Resistance break: $2,520
• Lower wedge base/buy zone: $2,289.27–$2,270
• Stop-loss: Weekly/4H close below $2,270
• Primary take-profit: $3,050.50
3. Trading Plan
– Primary: Go long on a 4H close > $2,520; target $3,050.50; SL < $2,270
– Alternate: If rejected at resistance, wait for a pullback into $2,289–$2,270; look for a bullish MSB or reversal candle to enter the long with the same TP/SL
Trade confirmed breakouts or clean reversal signals—avoid FOMO and overleveraging. 🚀

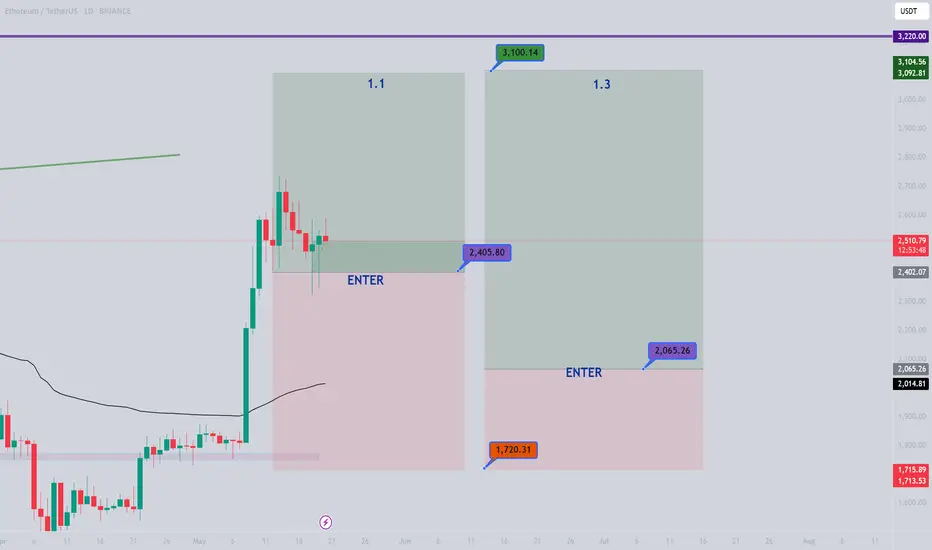
ETH 12H LONGCRYPTOCAP:ETH is trapped in a 12H “pain corridor” after false breakouts above $2,608.13 and below $2,406.63 wiped out late buyers & shorts. Here’s the refined playbook:
Context & Observations
• 12H range: $2,406.63–$2,608.13
• Liquidity grabs above & below, now coiling mid-range
• Volume cluster around $2,506 hints at pent-up energy
• Market structure leans bullish for a breakout
Plan & Levels
• Primary: Hold longs through the range, target $3,164.51 (0.618 Fibo) on a clean 12H close > $2,608.13
• Alternative: On a retest of $2,406.63–$2,500, add or reinforce longs if support holds
• Stop-loss: 12H close < $2,406.63
Triggers
– 12H close > $2,608.13 → priority long entry
– Fake downside breakout & swift reclaim of $2,406.63 → buy signal
– Volume surge on breakout for confirmation
Conclusion
Both longs & shorts have been flushed. Now wait for a decisive exit above $2,608.13 before chasing the move up to $3,164.51. Patience is your edge. 🚀

Short-term next target for ETH - 2808$; 80% for ETHFinally main goal for correction since december has been reached!
ETH hit 1550$.
For more detailed idea check this one
On 3D timeframe you can see that StochRSI is trending UP, means momentum is building for next move UP.
RSI may finish to form a bullish divergence in coming days.
Also price hit liquidity zone since oct. 2023. This level has to show us some buy pressure.
Next short term target could be 2808$ which is 80% above from current level.
2 reasons for this price:
200MA
Liquidity and resistance zone since february

Check if the price can hold above 2627.18
Hello, traders.
If you "Follow", you can always get the latest information quickly.
Have a nice day today.
-------------------------------------
(ETHUSDT 1D chart)
The M-Signal indicator on the 1M chart has risen above.
Accordingly, the key is whether it can find support near 2677.18 and rise.
If OBV rises above the A line, the price is expected to rise significantly once more.
Then, it is expected to rise to around 3265.0-3321.30.
-
If it falls without being supported near 2627.18, it is necessary to check whether it is supported near the right Fibonacci ratio 0.5 (2295.84).
Since the M-Signal indicator on the 1W and 1D charts is passing near that point, it is expected to play an important role.
-
Since the StochRSI indicator is in the overbought zone, it will eventually show a downward trend.
It is not known how much this decline will occur, but since the StochRSI 50 indicator is currently formed near 2359.35, it is important to check whether there is support near that area.
Therefore, in order to proceed with a new transaction, I think it is better to check the support point when the StochRSI indicator shows a downward and then upward trend in the overbought zone.
-
Thank you for reading to the end.
I hope you have a successful transaction.
--------------------------------------------------
- Here is an explanation of the big picture.
I used TradingView's INDEX chart to check the entire range of BTC.
I rewrote the previous chart to update it while touching the Fibonacci ratio range of 1.902 (101875.70) ~ 2 (106275.10).
(Previous BTCUSD 12M chart)
Looking at the big picture, it seems to have been maintaining an upward trend following a pattern since 2015.
In other words, it is a pattern that maintains a 3-year bull market and faces a 1-year bear market.
Accordingly, the upward trend is expected to continue until 2025.
-
(Current BTCUSD 12M chart)
Based on the currently written Fibonacci ratio, it is displayed up to 3.618 (178910.15).
It is expected that it will not fall again below the Fibonacci ratio of 0.618 (44234.54).
(BTCUSDT 12M chart)
Based on the BTCUSDT chart, I think it is around 42283.58.
-
I will explain it again with the BTCUSD chart.
The Fibonacci ratio ranges marked in the green boxes, 1.902 (101875.70) ~ 2 (106275.10) and 3 (151166.97) ~ 3.14 (157451.83), are expected to be important support and resistance ranges.
In other words, it seems likely that they will act as volume profile ranges.
Therefore, in order to break through these ranges upward, I think the point to watch is whether they can receive support and rise near the Fibonacci ratios of 1.618 (89126.41) and 2.618 (134018.28).
Therefore, the maximum rising range in 2025 is expected to be the 3 (151166.97) ~ 3.14 (157451.83) range.
In order to do that, we need to see if it is supported and rises near 2.618 (134018.28).
If it falls after the bull market in 2025, we don't know how far it will fall, but based on the previous decline, we expect it to fall by about -60% to -70%.
Therefore, if it starts to fall near the Fibonacci ratio 3.14 (157451.83), it seems likely that it will fall to around Fibonacci 0.618 (44234.54).
I will explain more details when the bear market starts.
------------------------------------------------------

$Eth Direction I think Eth will be waving some sort of correction t0 2240 - 2180 area then we should run while btc in this time is doing very good and expecting 125 k soon


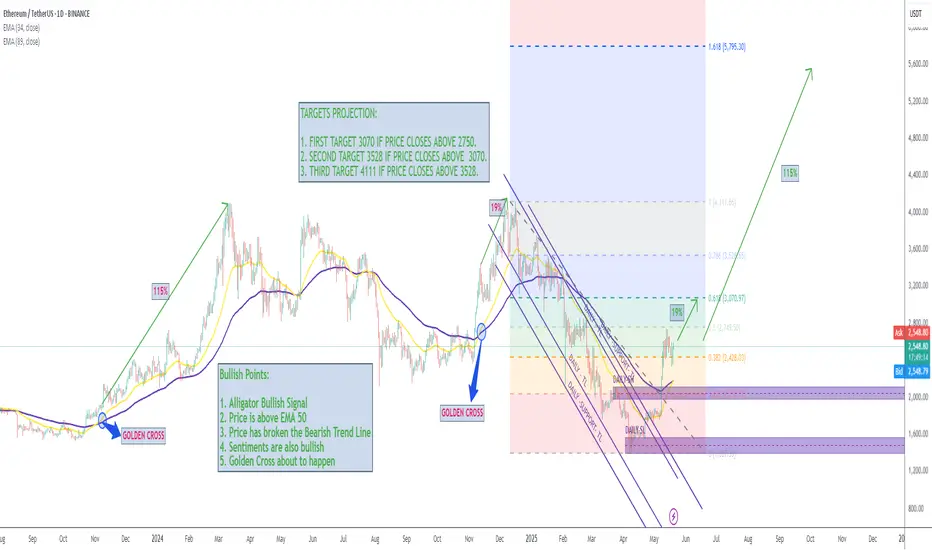
Golden Cross Brewing on Ethereum — Eyes on $4,000 BreakoutEthereum (ETH) is on the verge of printing a golden cross on the daily chart — a bullish signal where the 21-day moving average crosses above the 200-day moving average. Historically, this formation has triggered strong upward moves, and current price structure supports the possibility of a similar rally if key resistance is broken.
ETH has already bounced from the Point of Control (POC) and is currently consolidating just under $2,800, a major resistance level that also aligns with the Value Area High (VAH). This confluence makes it a critical breakout zone.
Key Highlights:
Golden Cross Setup: 21MA approaching a bullish crossover of 200MA
Major Resistance: $2,800 (confluence with VAH)
Support Structure: 21MA and 200MA providing bullish structure
Next Target: $4,000 if breakout is confirmed with volume
Volume remains the key missing piece — a breakout above $2,800 without volume may lead to a fakeout, but strong participation could validate the breakout and accelerate a rally toward $4,000.
Watch for price to either consolidate under $2,800 (bullish compression) or break with a volume spike. A confirmed golden cross and breakout could be the trigger for a multi-week bullish expansion, similar to previous patterns in ETH’s history.

Ethereum (ETH): Filled Bearish CME, Buyers Dominating For Now...Ethereum started with decent upward movement after we recently filled the bearish CME gap near $2346, which also marked the successful retest of the broken area (on bigger timeframes).
We are monitoring that area still but seeing the dominance from buyers, we might be seeing a good upwards movement and breakout happening very soon so eyes on resistance!!
Swallow Academy

ETH going up... 🚀 ETH/USDT Current Analysis 🚀
Ethereum (ETH) is currently trading around $2535. The ongoing bullish trend suggests potential target levels at $2780 and $2900.
🔄 However, a corrective phase is anticipated, which could pull the price back towards $2290 and $2120.
📈 In the long term, our price targets are set at $3200, $3800, and $4500.
Always exercise caution in the cryptocurrency market and stay informed about the latest developments! 💹
#Ethereum #ETH #Crypto #Investment

ETHUSDT pair has formed a set of Equal Highs!Currently, the ETHUSDT pair has formed a set of Equal Highs (EQ Highs) on the chart, indicating the presence of potential liquidity resting above that level. At the same time, there’s some price structure visible on the lower side, suggesting that the market may have created liquidity pools both above and below the current price range. This kind of setup often precedes a significant move.
Recently, the market executed what appears to be a 'Turtle Soup' pattern — a common liquidity grab strategy in which price breaks below a key support or above resistance to trap breakout traders, only to quickly reverse and pump in the opposite direction. Following this pattern, ETHUSDT saw a sharp upward movement, indicating that smart money may have manipulated liquidity to fuel this breakout.
Now , patience is essential. The market has created a visible trendline, and typically, such trendlines attract retail traders who treat them as dynamic support or resistance. However, what often happens is that liquidity builds up around these trendlines, and institutional players later push the price through them to trigger stop-losses or induce panic. It’s likely the market will take out (or 'kill') the liquidity lying along that trendline.
After that liquidity sweep, we’re watching for price to move into a marked Fair Value Gap (FVG) — an imbalance left by a strong move where price didn’t fully fill in. Once the price taps into that FVG, we need to wait for additional confirmation. Ideally, we’d like to see a Market Structure Shift (MSS) or a Change of Character (CHoCH), both of which are strong indicators that the trend may be reversing or forming.
Only after those confirmations should we start considering entering a long position. We can further validate the setup using refined models such as the Unicorn Model, or other entry confirmations like a refined FVG entry, a bullish order block (OB), or breaker block. The goal is to enter the trade when there is a high-probability confluence of signals, not just based on a single indicator.
Once a solid entry setup is confirmed, our targets can be the Equal Highs formed earlier, as they represent resting liquidity which price often seeks. However, it’s crucial not to blindly follow the setup. Observe how the market reacts at each critical level, manage risk properly, and most importantly DYOR (Do Your Own Research) before making any trading decision.

ETHEREUM ON VERGE OF SKY ROCKET FLIGHTThe Ethereum looks attractive at the current price and many aspects are showing a positive addition to the Ethereum .... its a good time to board the flight as ETHEREUM seems to be take the flight to the moon soon
The Invisible Hand in Crypto: Are We Just Puppets?You think you’re trading based on your analysis?
Maybe you’re just thinking that.
The crypto market might be far more controlled than you realize — here’s how, when, and why .
Hello✌
Spend 3 minutes ⏰ reading this educational material.
🎯 Analytical Insight on Ethereum:
Following its impressive recent rally, ETH continues to show strength, supported by high volume and a clear bullish market structure. A key daily support—confluent with the Fibonacci zone and an ascending trendline—remains intact. My main target stands at the psychological $3,000 level, implying ~16% upside potential if momentum sustains. 🔍
Now , let's dive into the educational section,
📊 TradingView Tools: Decoding the Minds of the Whales
In a market where price moves often feel pre-scripted, precision tools aren’t a luxury — they’re survival gear. TradingView offers indicators like Accumulation/Distribution, On-Balance Volume, Smart Money Concepts, and Liquidity Heatmaps that help you spot where big money is entering or exiting . These tools, especially on higher timeframes, can reveal underlying accumulation or distribution before major moves happen. For instance, if OBV rises while price remains flat, whales might be silently building positions. Also, indicators like Whale Alerts, based on on-chain analysis, can show large transactions often tied to upcoming volatility. Combine this with tools like Volume Profile or classic trendlines, and you’re no longer chasing price — you’re anticipating it.
🎯 Collective Behavior or Whale-Orchestrated Moves?
Markets — especially crypto — haven’t moved on simple supply and demand for a long time. Many of the price spikes or dumps you see aren’t organic; they’re orchestrated. Big players with massive volumes steer liquidity to where they want it.
🧠 Retail Psychology: A Weapon in Bigger Hands
Why do you always enter after a pump? Why does the market bounce right after you panic sell? These are not coincidences. Fear and greed are weapons. Smart money knows exactly how to trigger emotional trades from retailers, turning those reactions into their profits.
🔄 The Recycled Trap Scenarios
Here’s a classic: sudden green candle to trigger FOMO, followed by a slight dip, more retail buys in, then a sharp dump — liquidity collected. If this sounds familiar, it’s because it keeps happening. Those who spot it early survive.
📉 It’s About Liquidity, Not Your Support Line
Whales don’t care about your trendlines. They care about liquidity. If you know where most long or short positions are placed, you can often predict the next market move. TradingView indicators help identify liquidation zones — follow them.
🕹 You’re Just a Pawn — Unless You Learn the Map
If you’re just reacting candle by candle, you’re losing. But when you start thinking like whales, understanding their setups, you flip from pawn to player. Sentiment tools, volume flow, and behavioral indicators are your way out of the trap.
📌 Final Words
If you thought your analysis was behind your trades — think again. Smart money plays by a plan, and TradingView’s tools help you see the blueprint. Don’t be manipulated — learn to move like the movers.
always conduct your own research before making investment decisions. That being said, please take note of the disclaimer section at the bottom of each post for further details 📜✅.
Give me some energy !!
✨We invest countless hours researching opportunities and crafting valuable ideas. Your support means the world to us! If you have any questions, feel free to drop them in the comment box.
Cheers, Mad Whale. 🐋

Ether towards 3kPotential breakout from the wedge for ether and then straight to 3k level.
This is the scenario i am thinking for now.

1D ETH/USDT Range Chart ProjectionWhile the SQZ indicator develops its negative slope, the price, with high probability, will be encapsulated within a side with purchases (accumulation) or bullish entries at prices of $2,323 dollars and taking profits at prices of $2,738, as in the larger chart, 1S, we have the development of a bullish movement, purchases or bullish entries are prioritized, in favor of the developing trend.

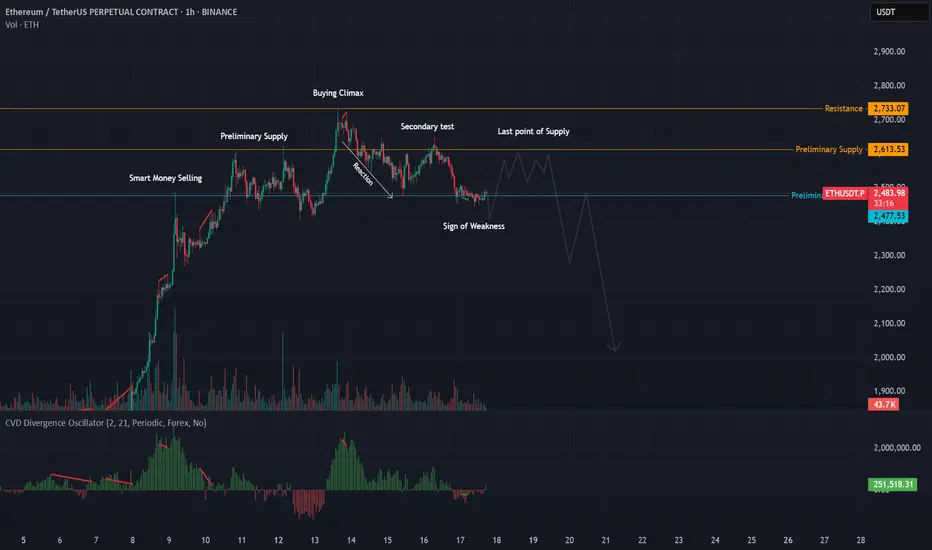
ETH Distribution Playing Out After Clean Accumulation Target HitThis is a follow-up to my last ETH idea, where I called for accumulation and a breakout from the falling wedge — price hit the exact target I mapped out, and since then, the behavior has shifted.
We are now seeing the classic signs of distribution forming. It began with smart money stepping in selling into strength, which led into preliminary supply . That was followed by a strong climatic volume push into a buying climax , the heavy volume came in right at the top, and since then, we’ve seen a reaction down, a weak bounce ( secondary test ), and now a potential sign of weakness.
The delta has been confirming the distribution as well. It showed bearish divergence at the buying climax , showing aggressive selling happening even as price pushed up. Now with this move down, we’re seeing increasing negative delta confirming supply is in control. Volume is also heavier on the drops, confirming distribution rather than re-accumulation.
After a sign of weakness like this, we usually get one more push up into a last point of supply — a weaker rally that gets sold into before the real markdown begins. Be aware of a possible trap move above the secondary test or buying climax , but the structure suggests the highs are likely in for now.
Whether this plays out clean or gets messy with one more fakeout, the context has seemd to shift. Smart money appears to be offloading, and delta continues to confirm it. Bias flips bearish until proven otherwise.
Overall, I believe the recent up move was a stop hunt and ETH has much more downside ahead.