Ethereum Leveling Map — ETH/USDT 1DNo directional bias for Ethereum, but will use levels to spot entries for intraday.
Right now located at POC and seems balanced for both sides.
Potential Adam&Eve setup in development.
Quality levels for support $2150, 2000, 1800, 1500.
Resistances $2700, 3000, 3500, 4000
Keep in mind it will follow BTC price action by most of time.
Happy trading
ETHUSDT.P trade ideas

Ethereum has been in bear market since 2021When the matter is in charts, I tend to speak less
I am not the best speaker, so the chart says it for me!
Ethereum is and has been in bear market since 2021
I think entry between 700/600 is a good point
I want to buy BTC, ETH, XMR

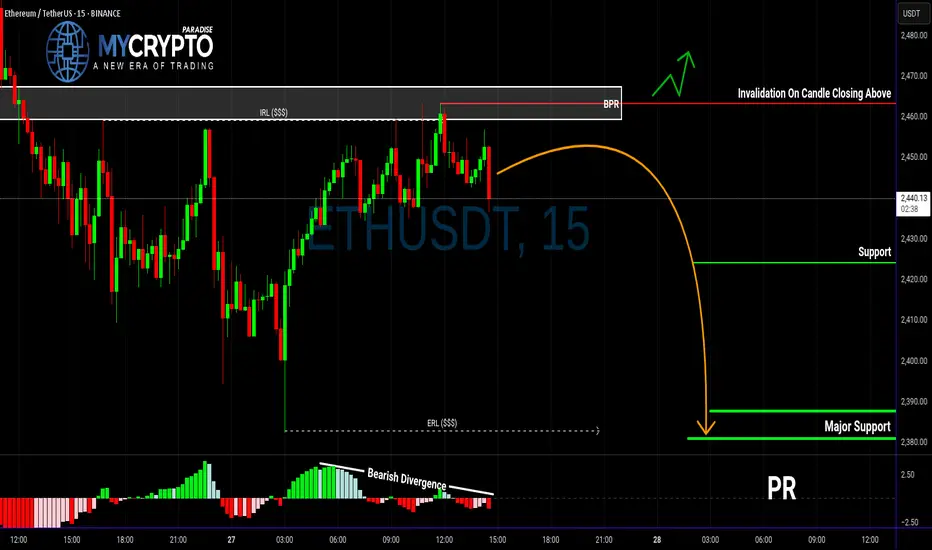
ETH in Trouble? This Breakdown Could Be Just the BeginningYello, Paradisers — are you spotting the same warning signs we did before the last major ETH correction? If not, now’s the time to pay close attention.
💎ETHUSDT is currently showing multiple bearish signals across both higher and lower timeframes. On the higher timeframe, we’ve confirmed a bearish Change of Character (CHoCH), which is often the first major clue that momentum is shifting from bullish to bearish. This shift suggests that ETH could be preparing for a deeper move down.
💎On the 15-minute timeframe, price has reacted directly from the BPR zone. What adds even more weight to this reaction is the clear bearish divergence we’re seeing on the MACD indicator. Together, these signs point to increased bearish pressure in the short term.
💎More importantly, ETH has already taken out Internal Range Liquidity (IRL), which often sets the stage for a move toward the External Range Liquidity (ERL). When IRL gets swept and momentum remains bearish, it’s typically a sign that the market is hunting for liquidity on the other side of the range—and that’s exactly where we believe ETH is headed next.
💎That said, to take this setup with high confidence, we’re waiting for a clean bearish candlestick pattern to form. Confirmation is key. A solid entry backed by strong price action improves the probability of success and allows for tighter, more efficient risk management.
💎However, if ETH breaks out and closes decisively above our invalidation zone, the entire bearish idea is off the table. In that scenario, patience will be our best tool—we’ll wait for price action to realign and only re-enter the market once a new high-probability setup presents itself.
🎖Strive for consistency, not quick profits. Treat the market as a businessman, not as a gambler. Patience and discipline are what separate the professionals from the herd. Stick to the process, trust the strategy, and you’ll stay ahead of 90% of the market.
MyCryptoParadise
iFeel the success🌴
Ethereum (ETH): Attentions at 200EMA | Targeting Local HighEthereum is back near EMAs after a nasty drop we had recently due to news we had. Now it is basically the waiting game, where we just wait for confirmations of either a breakout from here or a rejection and movement back to lower zones.
We are looking more for the breakout scenario just based on the buyside volume we had recently, which showed the dominance of buyers!
Swallow Academy

ETH - SHORT SET-UPBINANCE:ETHUSDT
Short Setup Summary (ETH/USDT Weekly):
Resistance Zone: $2,590–$2,720
View: Expect rejection from this zone
Target: $2,150
Stop-loss: Above $2,914
Setup Type: Supply zone rejection (bearish setup)
Confirmation: Watch for reversal candles in the zone

ETHEREUM is having a bearish retest?#ethereum price has been moving in a distribution zone and needs to breakout at least 3000$ to be optimistic and 3300$ to be bullish. #eth price is now having a bearish retest where broke the former support zone and now testing the current resistance zone. 4H ichimoku cloud must be broken out. A heavy declination from this zone may cause heavier dumps.

Ethereum:Daily signalhello guys👋
According to the drop we had, you can see that buyers came in and the price had a good growth, and after that a trading range was made in which the price got stuck.
Now, considering that the price is in the trading range and it seems that the buyers have shown their support, it is possible to step into the specified support areas with risk and capital management and move up to the set goals.
🔥Follow us for more signals🔥
*Trade safely with us*

Long trade
🟢 Trade Journal Entry – Buyside Trade
📍 Pair: ETHUSDT
📅 Date: Monday, June 23, 2025
🕒 Time: 8:00 AM (NY Session AM)
⏱ Time Frame: (Assumed 4Hr TF)
📈 Direction: Buyside
📊 Trade Breakdown:
Metric Value
Entry Price 2422.81
Profit Level 2474.60 (+2.14%)
Stop Loss 2415.04 (−4.08%)
Risk-Reward
Ratio 2.91 : 1
🧠 Context / Trade Notes:
NY Session AM Execution:
Trade entered at the start of the New York session, aiming to capture directional momentum amid strong ETH volatility.
Liquidity Sweep Confirmation:
Clear stop-hunt below prior swing low sets up the reversal conditions

Weekly trading plan for Ethereum BINANCE:ETHUSDT After the weekend, the price showed a solid recovery and is now attempting to break above the recent low at $2,436. If the breakout succeeds, we could see a move toward the marked resistance levels. Alternatively, we might get a local pullback before further upside. However, if the Pivot Point is broken to the downside, there’s a chance we’ll see a continuation of the bearish move
Write a comment with your coins & hit the like button and I will make an analysis for you
The author's opinion may differ from yours,
Consider your risks.
Wish you successful trades ! mura

ETH IN NO-MAN'S LANDEthereum is caught in no-man’s land. After a sharp rally in May that pushed price cleanly above the 200-week moving average, ETH has now slipped back between the 200 MA (around $2,400) and the 50-week MA (just under $2,600). It’s a classic case of being stuck in the middle – too weak to break higher, too strong to roll over completely. This is where momentum goes to die.
Until one of those moving averages gives way, expect more chop and indecision. A breakout above the 50-week could reignite bullish momentum, but a drop below the 200-week would bring $2,141 support back into play. For now, Ethereum’s just dancing between the lines.

ETHUSDTThis movement downtrend. If breake 2.790 movr to 3.500$ but breke 2.200 move trend to 1.500$.

HolderStat┆ETHUSD trying to break through the resistanceBINANCE:ETHUSDT has confirmed a triangle breakout above the 2,312.67 level and is forming a bullish staircase structure. The chart shows a history of breakout rallies from similar formations, and this current setup targets 2,700+. Maintaining higher lows is essential for follow-through.

ETHEREUM accumulated and ready to goOn a very negative news price is drop to POI of the dealer and well accumulated. We believe that next bullish move about to happen

MACD Divergence Flashing Red, Could This Trigger a -30% Crash?Hey Realistic Traders!
Bearish Reversal Signal Flashing on BINANCE:ETHUSDT , Is the Bull Run Over?
Let’s Break It Down..
On the daily timeframe, Solana (SOL) has formed an ascending broadening wedge, which has now broken to the downside through both the lower trendline and a major support zone, indicating a shift in market structure.
Price action has also remained consistently below the 200-day EMA, signaling a potential transition from a bullish to a bearish trend.
A bearish divergence has appeared on the MACD indicator, where price makes higher highs while the MACD forms lower highs. This divergence indicates that buying momentum is weakening, even as the price pushes higher. Such a pattern often precedes a trend reversal and supports the expectation that the price may continue to move lower.
Given these technical signals, the price is likely to continue moving lower toward the first target at 1849.07, with a possible extension to the second target at 1534.44.
This bearish outlook remains valid as long as the price stays below the stop-loss level, currently marked at 2734.40. A move above this level would invalidate the bearish setup.
Support the channel by engaging with the content, using the rocket button, and sharing your opinions in the comments below.
Disclaimer: "Please note that this analysis is solely for educational purposes and should not be considered a recommendation to take a long or short position on ETHUSDT.

#Ethereum Update!!CRYPTOCAP:ETH has broken below the $2,308 resistance zone and is now trading lower.
Price is approaching a key demand area around $2,132–$2,000, where we’ve seen strong buyer reactions in the past.
IMO, if bulls step up and defend this zone, we could see a recovery bounce aiming for $2,526, the next major resistance ahead.
I’ll keep you updated as things develop.
If you find my updates helpful, don’t forget to like and follow for more! DYOR, NFA

ETH Eyes FVG Fill — Buy Dips Toward Confluence Support✅ Multiple confluences: 1h MSS, range lows, FVG, and OB cluster at $2,273–$2,319
✅ High probability of FVG ($2,529) being filled before new lows
⚠️ Downside sweeps are buys, not sells — use zone for bids
Active Setup:
Long Entry: Bids in $2,273–$2,319 zone (on confirmation: SFP/reclaim or strong bounce)
Targets: First TP at FVG ($2,529), next at range high ($2,787)
Stop: Below $2,185 (invalidate on close below sweep low)
🔔 Triggers & Confirmations:
Only enter on strong reversal/bounce in blue box
No FOMO above FVG, wait for clean setup
🚨 Risk Warning:
Avoid chasing into resistance (FVG), wait for dip entries with confirmation

HolderStat┆ETHUSD formed the rising bottomBINANCE:ETHUSDT on the 16h chart is pressing upward inside a steep channel after reclaiming $2,300. Momentum is driving the price toward $2,800 and possibly $3,400. Previous breakouts from consolidation zones support the bullish bias.

ETHEREUM PRICEACTION TRADINGETHUSET have tested the broken demand floor and it looks like buyers are going for another .
if that level is broken ,it will be a wave of long which will hope to take profit on the supply zone .


[SeoVereign] ETHEREUM Bearish Outlook – June 27, 2025We are the SeoVereign Trading Team.
With sharp insight and precise analysis, we regularly share trading ideas on Bitcoin and other major assets—always guided by structure, sentiment, and momentum.
🔔 Follow us to never miss a market update.
🚀 Boosts provide strong motivation and drive to the SeoVereign team.
--------------------------------------------------------------------------------------------------------
Hello,
I would like to present a bearish outlook on Ethereum as of June 27, 2025.
In the most recent Bitcoin idea I shared on the 22nd, I explained the reason for setting the take-profit zone at 98,875 and mentioned the possibility of a short-term rebound. Amidst the ongoing war risks in the Middle East that are shaking the overall crypto market, the market has shown a successful rebound, with Bitcoin at the center of this movement.
However, this upward movement has been limited to Bitcoin alone, while other major altcoins have shown weak and sluggish rebounds. In such a situation, when predicting a future decline and considering short positions, I believe it is strategically more advantageous to target altcoins rather than Bitcoin. The inability to properly rebound suggests a momentum issue, which is likely to lead to relative weakness in the market.
Many investors tend to short Bitcoin simply because it has risen significantly in price, but this is a beginner-level mistake. Taking a short position solely based on a large price increase carries high risk, and it is more rational to base strategies on altcoins that are failing to gain upward momentum.
From this perspective, I was preparing the basis for a short position in this idea, and as a technical confirmation signal has appeared, I now present a short strategy for Ethereum. The first target is set around the 2,357 level.
If the movement unfolds, I will further explain the analytical thinking that made it possible to anticipate this decline, along with additional key points to monitor in the market.
Thank you.

ETHUSDTThis is very easy...
best support level 2300 to 2500 for jump price. but was needed for jump price for get enrgy for movement to high levels by fake breakout.
First level of resistance 2800 to 3000.
⚠️Control Money Management in your capital.

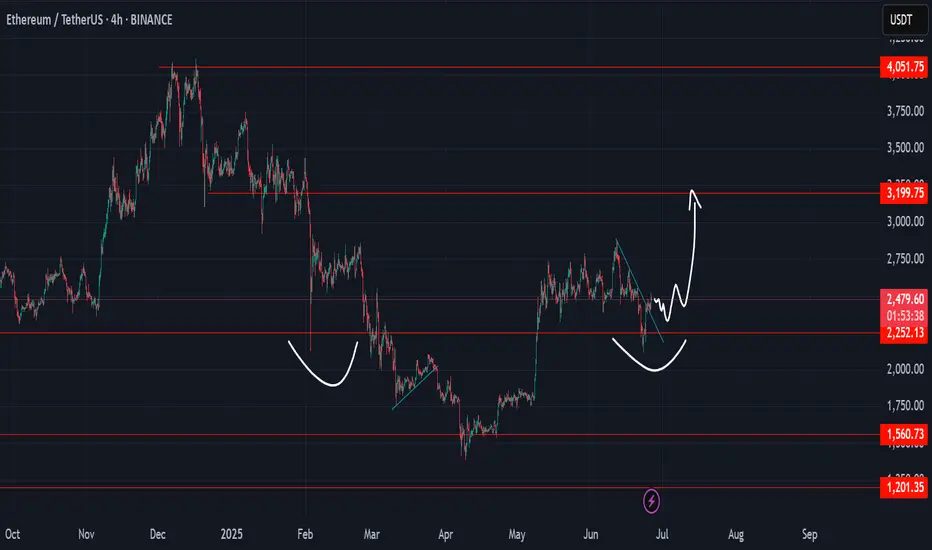
ETH and iHnS SpeculationETH in candle stick mode create iHnS pattern
if we can hold above 2k its still positive if we can retest to 3.2k
ETH/USDTI think it's time for Ethereum to grow and we should wait for higher targets from Ethereum. Tell me what you think.
