ETHUSDT.P trade ideas

Ethereum – 1D timeframe overview with Initiative AnalysisHey traders and investors!
The price has reached the lower boundary of the range. There is no volume spike.
I expect a further decline toward 2184 and 2100. The 2100 level is a contextual area to look for buying patterns.
As part of a correction, the price could potentially drop to 1800. Monitoring.
This analysis is based on the Initiative Analysis concept (IA).
Wishing you profitable trades!

"ETH Bullish Heist: MA Breakout Confirmed! Next Stop 3600?"🔷🔹 "THE ETH HEIST: MASTERPLAN TO LOOT 3600!" 🚨💰 (Breakout + Pullback Strategy)
🌟 Yo, Fellow Market Robbers! 🌟 (Hola! Bonjour! Salaam!)
Listen up, Money Makers & Thieves! 🏴☠️💸
Based on the 🔥Thief Trading Style🔥, we’re about to pull off the ultimate ETH/USDT heist—Ethereum vs Tether is our target!
🔪 THE TRADE SETUP (LONG HEIST)
🎯 Entry Signal:
"The heist begins at MA Breakout (2900)! Wait for confirmation, then strike like a pro thief!"
Option 1: Buy Stop above MA (2900) for breakout momentum.
Option 2: Buy Limit on pullbacks (15-30min TF) for sneaky low-risk entries.
📌 ALERT! Set a breakout alarm—don’t miss the robbery!
🛑 Stop Loss (Thief’s Escape Route):
"Yo! If you’re entering on breakout, DO NOT set SL before it triggers! Place it at the nearest swing low (12H TF)—or risk getting caught by the bears! 🐻🔪"
🎯 Profit Target: 3600 (OR Escape Early!)
Scalpers: Only long scalps allowed! Use trailing SL to lock profits.
Swing Thieves: Ride the wave but exit before the cops (bears) arrive!
⚡ WHY THIS HEIST WILL WORK:
Bullish momentum + MA Breakout = Easy Loot!
Overbought? Trap? Reversal? Nah—we escape before the danger zone! (Yellow ATR = High Risk)
📢 THIEF’S WARNING:
🚨 News Alerts = Market Chaos!
Avoid new trades during high-impact news.
Trailing SL = Your Best Friend.
💥 BOOST THIS HEIST!
👉 Hit 👍 LIKE & 🔔 FOLLOW to strengthen our robbery squad! More heists = More profits! 🚀💰
Stay tuned, thieves… Next heist coming soon! 🏴☠️🔥

Ethereum Holds the Line – Is $2,300 the Key to the Next Rally?By examining the #Ethereum chart on the weekly (logarithmic) timeframe, we can see that after rising to $2,880, the price faced selling pressure and corrected down to $2,500. This upward move created a large Fair Value Gap (FVG) between $1,870 and $2,300, which is likely to be filled in the medium term if the price drops further.
However, as long as Ethereum continues trading above the $2,300 level and does not close below it, we can still expect further bullish movement.

Short idea on $ETHJudging by the structure, if the vector is correctly identified, then on the ETH instrument, a rise to 3400–3600 remains relevant until the first serious correction (this idea would be invalidated in that case).
As for the potential trade — a breakout of the local highs amid global chaos and during the formation of wave 4 of a 5-wave structure. Typically, during the formation of wave 4, there is more media involvement, more noise, and panic.
I’m observing and planning to enter this trade.
Do not follow my vision blindly, as it could be detrimental to you.
ETHUSDT UPDATE 1DETH slipped below channel support (~ 2.45k). Weekend volume is thin—need 2 daily closes (Mon/Tue) to confirm. Hold-below sets sights on 2.2–2.0k (Fib 61-78 %). Reclaim 2.5-2.6k invalidates.

Still in the range(box of triangle)Keep an eye on candle pattern.
Especially, week candle.
( Hint🤫, No lower shadow(wick) usually makes price action. But there is high probability to make one more dip )

Ethereum at a Critical Support Zone Ethereum Weekly Analysis – Long-Term Perspective
Ethereum is currently experiencing significant bearish pressure and has dropped into a major support zone on the weekly chart. If this critical support breaks, the next key target would be around $2,055, where the price aligns with a long-term ascending trendline, acting as a possible reversal zone.
However, if ETH manages to defend this area and confirms bullish weekly candle closures, we may see a potential recovery toward:
$2,278 as the first resistance
Followed by $2,435 as the next upside target
📌 All support and resistance levels shown in the chart are key decision zones that traders can use for entries, exits, or managing positions.
🧠 Don’t forget to follow for consistent long-term insights and clean technical setups like this.

Should i start panicking ?
Man, I really wish I didn’t look at this chart right before bed—this thing looks like it’s straight out of a horror movie.
From what I can tell, we’ve got a monthly bearish inverted FVG lining up perfectly with daily resistance. There’s also a broken trendline on the daily, and right after it snapped, we got that sharp V-shape move, which looks like a classic retest—either of the broken support or the trendline that flipped to resistance.
To add to the bearish vibes, there’s a pretty obvious divergence on the daily chart. That’s not exactly comforting.
Honestly, I’m struggling to find anything bullish here. The only tiny hope is that the price doesn’t break below that daily trendline (the one marked in blue). If it holds, maybe—just maybe—we can reclaim the broken main trendline and turn that resistance back into support.
If anyone out there is deep into crypto and has thoughts on how to approach this kind of setup, I’d really appreciate your take. Could use another perspective right about now.

Ethereum Price Reversal ? $2100 Support & Altcoin Season OutlookAfter an extended period of consolidation, Ethereum (ETH) has finally retested the critical support level of $2,100, which aligns closely with the 0.5 Fibonacci retracement level of the bullish trend that began in April. This confluence of technical factors strengthens the validity of this level as a strong demand zone.
The price action suggests that ETH may be gearing up for a bullish reversal, as it respects both horizontal support and key Fibonacci structure. Historically, the 0.5–0.618 retracement zone acts as a high-probability reversal area in trending markets, particularly when accompanied by volume stabilization and long-tailed candles on the daily chart.
Trade Plan: Spot and Futures Positions
Given the current structure, this presents a favorable opportunity to accumulate ETH on spot for the anticipated altcoin season. In addition, leveraged long positions in futures can be considered with clearly defined risk parameters.
Entry Zone: Around \$2,100
Stop Loss: \$2,000 (below key support)
Target Levels:
Primary Target: $2,500 (previous resistance / psychological level)
Secondary Target: $2,600 (major structure high)
The risk-to-reward ratio remains attractive, particularly if the broader crypto market continues its uptrend and Bitcoin maintains stability.
Market Context
Broader macro sentiment and the dominance cycle suggest capital rotation into altcoins could be near. With Ethereum leading major Layer 1s, a recovery from this level could catalyze a wider altcoin rally**, making this an important zone to watch for both intraday traders and swing investors.
⚠️ Note: Due to ongoing geopolitical tensions between Israel, Iran, and the United States, global financial markets—including crypto—may experience heightened volatility. Traders are advised to manage risk carefully and avoid overleveraging during uncertain macro conditions.

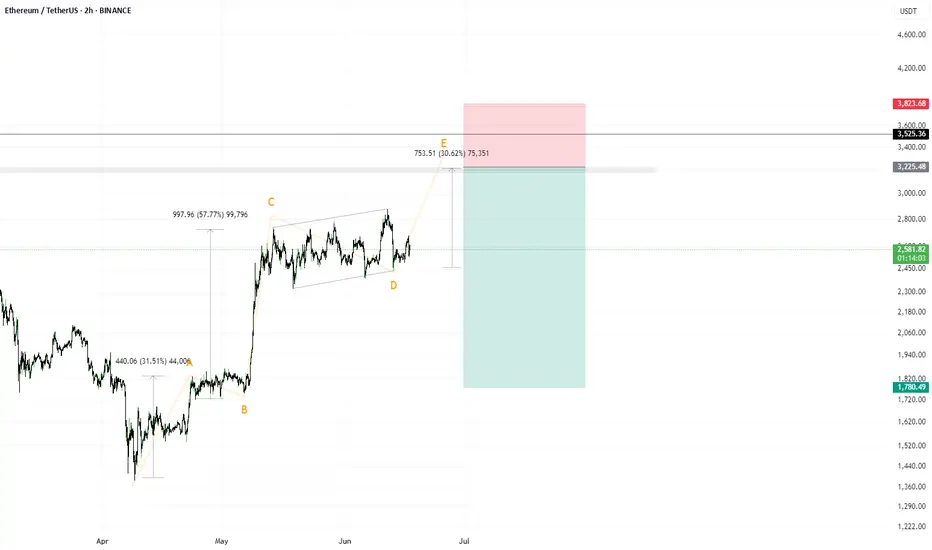
Pullback and DownHi there!
We have a nice pattern and very clear also. We should take care about BTC movement if we trade ETH or any other ALT coin!
Our main target is very clear ABC Fibonacci extension 161,8 and Fibonacci retracement 61,8 and HH of previous cycle! Sure, under this cluster level is a liquidity zone where you can make new cheap buys :-).
Good luck traders!

ETH Bearish Retest – Heading to $900?Description:
On the weekly chart, ETH has once again failed to break back above the long-term ascending trendline that started in 2020. After losing this trendline support earlier, price is now treating it as resistance — a textbook bearish retest.
The market reaction suggests weakness, and the lack of strong volume on the upside raises concerns about buying momentum. If this structure holds, we might be looking at a broader correction in play.
📉 Key Observations:
• Bearish rejection from the multi-year trendline.
• Structure resembles a lower high formation.
• Weak volume on bounces, showing hesitation from bulls.
🔍 I’m personally watching the $1,000 zone as a potential magnet if downside pressure builds. Some may even expect a retest of the $900 range — not a prediction, just a scenario.
💬 What do you think? Are we headed for a deeper flush or is this just a trap before a breakout? Drop your thoughts ⬇️
#Ethereum #ETH #CryptoWeekly #TechnicalAnalysis #Trendline #BearishSetup

Wait for ETHETH faced rejection at the weekly resistance near $2,700.
Price is likely to retest the current weekly support around the $2,100 zone.
Patience is key—wait for ETH to reach this support area before considering entry.
Disclaimer:
This analysis is based on my personnal views and is not a financial advice. Risk is under your control.

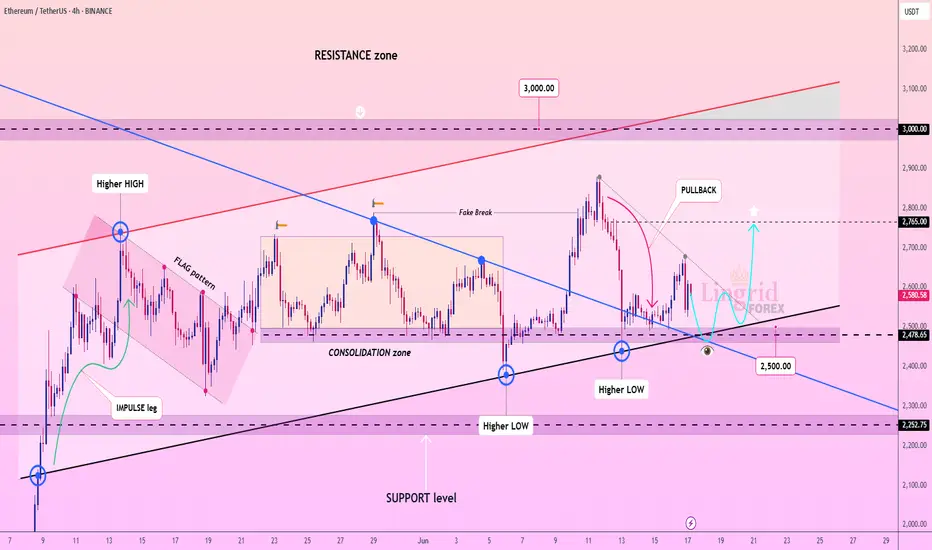
Lingrid | ETHUSDT potential Bullish Trade from the ConfluenceBINANCE:ETHUSDT is retesting a key support area near 2500 following a deep pullback from the 2765 rejection zone, while holding above a multi-week ascending trendline. The recent bounce has not yet invalidated the bullish structure, and the confluence with the downward breakout level adds significance to this zone. A higher low above 2480 could trigger a sharp reversal back toward the 2765 resistance.
📈 Key Levels
Buy zone: 2475–2520
Sell trigger: breakdown below 2450
Target: 2765
Buy trigger: breakout above 2620
💡 Risks
A breakdown below 2475 would cancel the bullish setup
Lack of volume on bounce attempts may signal weakness
Macro events or BTC drop could drag ETH lower regardless of setup
Traders, if you liked this idea or if you have your own opinion about it, write in the comments. I will be glad 👩💻
Ethereum (ETH): Seeing Bounce From 200EMA | Buyers AccumilateEthereum is showing some signs of recovery, where buyers might be into something here. If we keep same volume momentum until the end of the day, we might see another attempt to go for the $3000, which is our major target as of now.
Swallow Academy

ETH/USDT 4H Technical Analysis UpdateChart Insights:
ETH is holding the lower trendline support (~$2,430), which indicates a potential reversal zone.
The RSI is hovering around 39, which indicates oversold territory, suggesting that buyers may step in soon.
Expected Move:
The chart predicts a strong move upwards towards the $2,800–2,900 zone (blue arrow), which aligns with the top range boundary.
Trade Plan:
Buy Zone: Near the lower trendline ($2,430–2,450)
Stop Loss: Just below the trendline ($2,400)
Target: Near the upper range boundary (~$2,800–2,900)
Stay alert!

ETH READY TO GO 3000$ ???🔍 ETH/USDT Analysis – Daily Timeframe
ETH is currently trading at $2,427, holding above the key support zone around $2,370 - $2,390, which is aligned with the 100 EMA. This zone has acted as a strong accumulation area.
📈 Market Structure:
Price is consolidating inside a horizontal range. A confirmed breakout above the resistance zone ($2,650 - $2,700) could lead to a bullish continuation towards the major resistance at $2,861.
📊 Technical Outlook:
Trend: Sideways range (accumulation phase)
100 EMA: Acting as dynamic support
Breakout Potential: Bullish continuation expected on breakout and retest
📌 Trade Plan (Not Financial Advice):
Entry Idea: Break and close above $2,700 zone
Target: $2,861 and higher
Invalidation: Daily candle close below $2,370
ETH is building strength above its 100 EMA. A breakout from this range can trigger a fresh bullish leg.
🔁 Like & share your opinion! Always DYOR before trading.

Breakout point: 2706.15
Hello, traders.
If you "follow", you can always get the latest information quickly.
Have a nice day today.
-------------------------------------
(ETHUSDT 1D chart)
The key is whether the price can rise above the important support and resistance area of 2419.83-2706.15 and maintain it.
Therefore, when the 2706.15 point is broken upward, it can be said that a breakout trade is possible.
The conditions for a breakout trade are:
- OBV must rise above the High Line and be maintained,
- OBV oscillator must show an upward trend,
- StochRSI indicator must show an upward trend.
However, it is better if StochRSI indicator has not entered the overbought zone.
When the rise begins, the resistance zone is expected to be around 3265.0-3321.30.
-
Although funds are continuously flowing into the coin market, it may feel like the trading volume has decreased.
The reason for this is thought to be that BTC dominance is generally showing an upward trend.
The meaning of BTC dominance rising means that funds in the coin market are concentrated toward BTC.
Therefore, I think that the overall trading volume has decreased because more funds are needed for the price to rise.
When the altcoin bull market begins, more transactions will occur, which will make you think that liquidity has increased in the coin market.
Therefore, for the altcoin bull market to begin, the BTC dominance must fall below 55.01 and remain there or continue to fall.
If the USDT dominance remains below 4.97 or continues to fall, the coin market is likely to rise.
At this time, depending on the BTC dominance mentioned earlier, you can distinguish whether the rise is focused on BTC or whether the altcoin is also rising.
If the BTC dominance continues to rise, most altcoins are likely to gradually move sideways or fall.
Therefore, if you are trading altcoins in this situation, I think it would be useful to increase the number of coins (tokens) corresponding to profit while responding quickly and briefly.
In other words, it means selling the purchase amount (+including transaction fees) when the price rises by purchase price, leaving the number of coins (tokens) corresponding to profit.
The coins (tokens) increased in this way are coins (tokens) with an average purchase price of 0, which will reduce the psychological burden when the altcoin bull market begins, allowing you to obtain a good average purchase price.
-
Thank you for reading to the end.
I hope you have a successful transaction.
--------------------------------------------------
- This is an explanation of the big picture.
(3-year bull market, 1-year bear market pattern)
I will explain more details when the bear market starts.
------------------------------------------------------

ETHAs seen on the ETH chart, after breaking the upward trend, it performs a retest on the downward trend and creates the second peak of the downtrend by taking liquidity. All the moving averages (7, 25, 50, 100, 200) have converged, reinforcing and supporting the trend.
We have 3 scenarios here:
Wait for a break of the downtrend and enter a trade with a reversal candle.
Wait for the moving averages to act as support.
Wait for support from the block order zone around the 500 level — this is the worst-case scenario.
If the first two scenarios happen together, it could push us significantly higher.
At this point, only short positions are advisable — but they must be adjusted according to risk.
Everything written here is based on the weekly chart. It is possible to trade on lower timeframes, but don’t forget — the overall trend is still down.

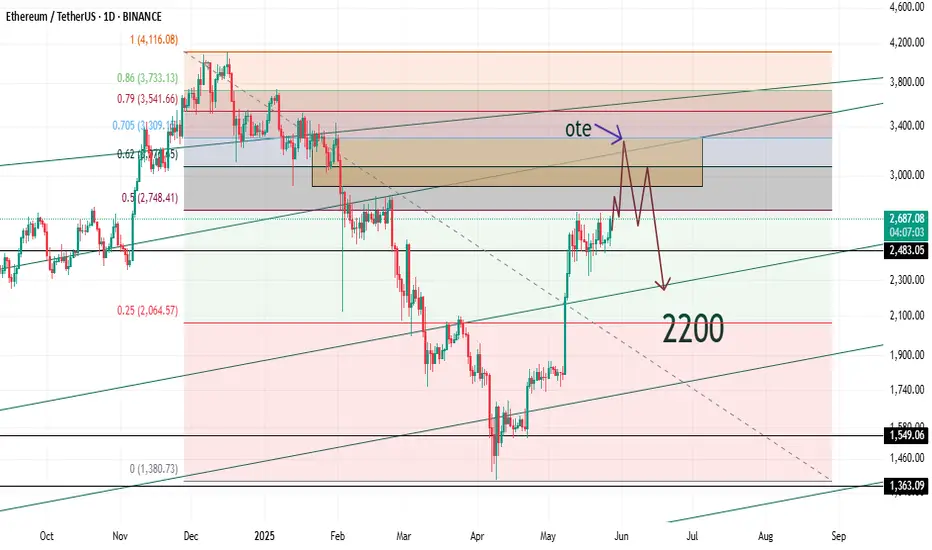
"Trap Ahead : Liquidity has a Price"Everyone’s screaming “bull market!” again…
Yeah, until the market humbles them—like always.
Let me walk you through what’s actually happening:
ETH is headed for a flashy detour to $3,300
—everyone’s gonna feel rich for a second.
Then?
Down she goes. Straight below $2,300.
Trust me, euphoria has a price.
Meanwhile, BTC is dressing up for above $113,500.
But don’t fall in love with the pump—it’s not here to stay.
That move? Just enough to get everyone trapped.
Next stop: sub-$93K.
Yup, the wolf said it.
This market doesn’t care about your hopes.
It rewards the patient, and devours the emotional.
Liquidity is the meal. You’re either the hunter… or the feast.
Follow Alpha Sigma Wolf
If you’re tired of hopium and want clarity instead.
Because I don’t do “maybe.”
I do moves.
Let the sheep cheer. We’ll be waiting.
#SMC #SmartMoney #CryptoAnalysis #ETH #BTC #AlphaSigmaWolf
Using PAR indicator to find divergence gaps to find clues of PA Using PAR indicator to find divergence gaps to find clues of PA

ETh more dump to $2100-$2030Just recently hopped into ETH short. Aiming for $2100 to $2030
Market is correcting on the weekly tf and this is a probably area that it might use to create the new HL for continuation back up.
Time sensitive.
Stop: $2235-$2245 area. $2245 is safer a bit lower RR though.

ETHUSDT LONG POSITION ENTRY: 2582.66
TAKE PROFİT : 2770.95
STOP LOSS : 1/3
Do not use high leverage!
Remember cash management (planning)!
Please follow the stop-loss rule!
