ETH/USDT Bullish Reversal from Support Zone Chart Analysis:
The chart illustrates a range-bound consolidation with clear support around $2,381.45 and resistance near $2,556.54.
🔍 Key Observations:
✅ Multiple Support Tests: Price has tested the support zone several times (highlighted by orange circles) and respected it, indicating strong buying interest at the lower boundary.
📉 Fakeout and Recovery: A false breakout below support occurred, but the candle quickly reversed, signaling a bear trap and potential for bullish momentum.
🔼 Rejection Wick & Consolidation: A strong rejection wick on the most recent candlestick shows buyers defending the zone aggressively. The current price action shows consolidation — a bullish accumulation pattern.
🎯 Upside Target: Based on the range breakout projection, the price could potentially revisit the resistance zone at $2,556.54, marked as the TARGET on the chart.
📌 Technical Outlook:
🟢 Bias: Bullish as long as the price holds above $2,381.45.
💹 Entry Idea: Aggressive buyers may enter near current levels with a stop below the wick low.
🛑 Risk Level: Tight stop-loss needed as the structure relies heavily on support holding.
📈 Conclusion:
A classic range rebound setup is forming with potential for upside movement back toward resistance. A breakout above $2,556.54 could initiate a trend continuation rally
ETHUSDT.P trade ideas

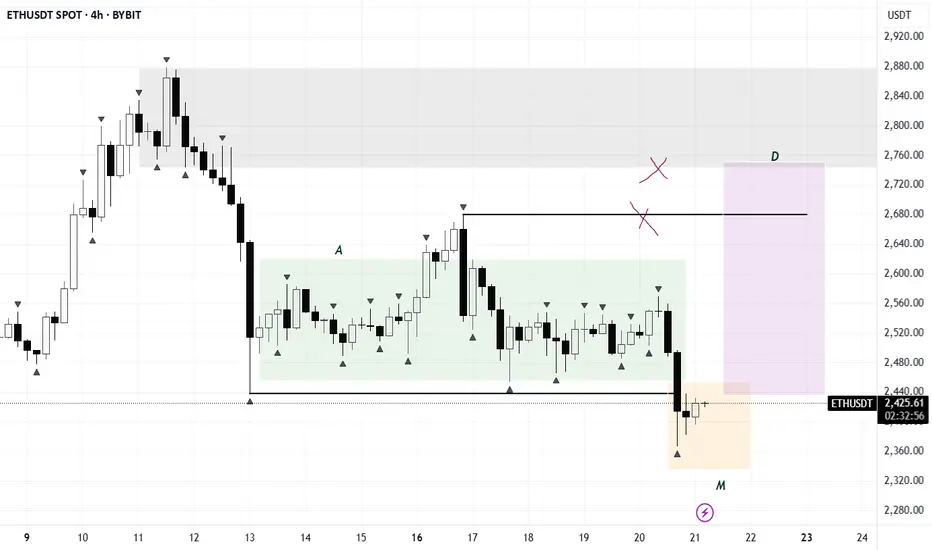
ETH/USDTFollowing the consolidation phase, we’ve seen a clear manipulation move — the structure closely resembles an AMD setup. As long as the pattern holds, upside targets are in the $2700–$3000 range.
ETH: Short 20/06/25Re-Upload as first was accidental Private
Private:
Trade Direction:
ETH Short
Risk Management:
- 0.5% account risk
Reason for Entry:
- H4 Bear FVG BTC
- H4 Bear FVG Total
- Failure to displace above weekly open on TOTAL
- 0.5 Fib retrace
- Bearish divergence on BTC
- Sentiment remains poor across majors
Additional Notes:
- High Timeframe point of interest respected
- No reclaim of critical resistance zones across majors
- Risk is half because I can see a scenario where it moves one leg higher

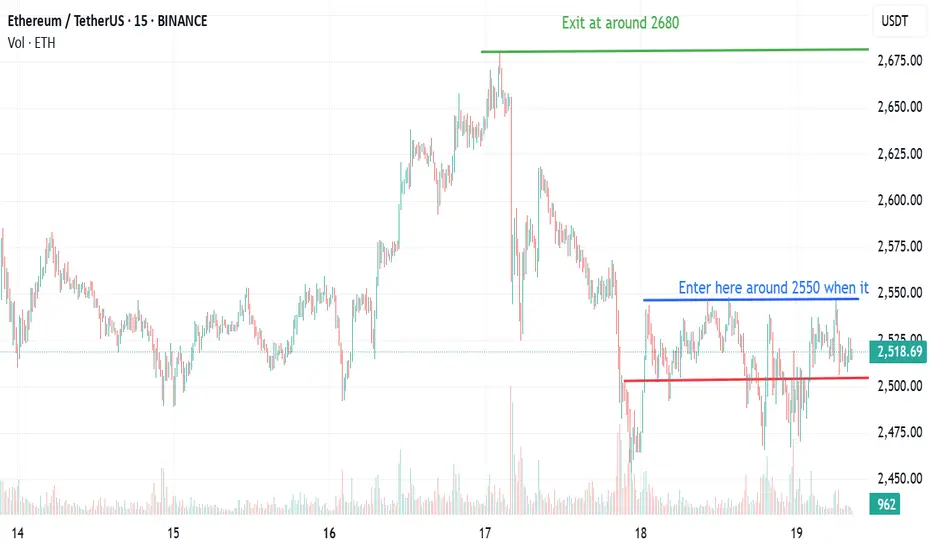
Ethereum Long Setup- BlackRock added ~$500M of ETH, while whales accumulated $221M post-dip
- On close analysis we can see that ETH chart is mimicking 2017 pattern
- The 2440 support has been tested multiple times now so we wait for the upper boundary of 2550 to be breached with volume spike and then we can enter for Long.
ETH ~Expansion done.Based on 3marketphase.
(contraction-expansion-trend, I learned this concept from dayya trading post)
ETH is at the box range.
(triangle-2024 August to October)
Plus, there is throwing-over with double-top (1week candle scale).
This means ethereum is at the end of contraction phase and it has high potential to trend phase. But I bet there is one more break-out from low before trend phase.
Keep an eye on all of break-out movements.

Update on ETHTP hit quicker than expected.
LTF intraday is currently short. Targetting the area where the HTF is more likely than not kicking in for the next leg towards the upside!
Not financial advice.
Onwards!
CRYPTO:ETHUSD
CRYPTO:BTCUSD


ETH Short – Smart Money Setup | 17.06 🔍 Context:
After a strong dump on ETH, clearly visible on the 1H chart (left side of image), I waited for a retrace into the Fair Value Gap (FVG) zone — typical Smart Money behavior. That’s where I started looking for a short setup.
🎯 Entry Logic:
Now here's the part I’d love to discuss with you.
The classic and maybe "cleanest" approach would be to wait for a market structure break on a lower timeframe and then enter on the continuation, targeting rejection zones visible again on the 1H.
But…
Lately, I’ve been taking entries directly from FVG, even before the break, if another FVG forms on the lower timeframe inside the higher timeframe zone. That’s what happened here — I saw a second FVG form in the key area, and took the short from that.
Sometimes I even treat two FVGs in the same direction (on the same or different timeframes) as a valid entry point on their own.
🤔 Question to the community:
How do you usually approach this?
Do you wait for confirmation/structure break on the lower TF before entering, or do you also go straight from the FVG if the zone is respected well enough?
Would love to hear how others manage similar setups.

Potential Long Setup for EthereumEther stabilized in a slightly positive trend after breaking the previous uptrend. Since mid-May, this flattish trend channel has continued, offering some trading opportunities within it.
When Ethereum approaches the lower line and the 50 EMA crosses above the 50 SMA, an ETHUSDT surge has followed each time since the channel formed. Traders could expect a similar move again. However, the key risk is potential negative pressure on stock markets due to geopolitical concerns and the correlation effect on the crypto market and a break of the channel.

Coinbase #COIN gives a hint for crypto Coinbase #COIN gives a hint of what path awaits #ETH in the coming days

ETH(20250618) market analysis and operationTechnical analysis of ETH contract on June 18:
Today, the large-cycle daily level closed with a small negative line yesterday, and the K-line pattern continued to fall. The price was at a high level but had no strength and continued trend. Instead, it was easy to fall under normal pressure. The attached indicator was dead cross, and the big trend was still very obvious. In this way, we are more optimistic about the price continuing to fall and breaking the low point in the future; the short-cycle hourly chart fell continuously yesterday, and the European session continued to break the previous day's low point in the US session. It is still in a corrective trend, but according to the current trend, it is highly likely to continue today. Whether it can break down the low point of last week needs to be paid attention to. There is no room for operation during the day, so wait and see today, focusing on the strength and weakness of the European session and the unemployment data in the evening.

Ethereum (ETH/USDT) – Breakdown From Ascending TriangleEthereum failed to hold above the crucial resistance of $2,849 and has broken down from the ascending triangle on the 4H timeframe — invalidating the bullish breakout structure.
It seems to be consolidating and moving sideways in the range. The move is possible only if we break the channel either upside or downside.
Key Observations:
Ascending triangle fakeout followed by sharp rejection
RSI dropped from overbought (~70) to neutral zone (~46), showing weakening momentum
Current price: $2,537, testing local support at $2,384.90
Next major support zones: $2,242.98 and $1,852.48
Watch for further weakness below $2,384 — could accelerate downside toward $2,242 or lower.
Caution advised: Wait for the structure to rebuild before positioning it long.
This is not financial advice, please do your research before investing, as we are not responsible for any of your losses or profits.
Please like, share, and comment on this idea if you liked it.
#ETH #Ethereum #ETHUSDT

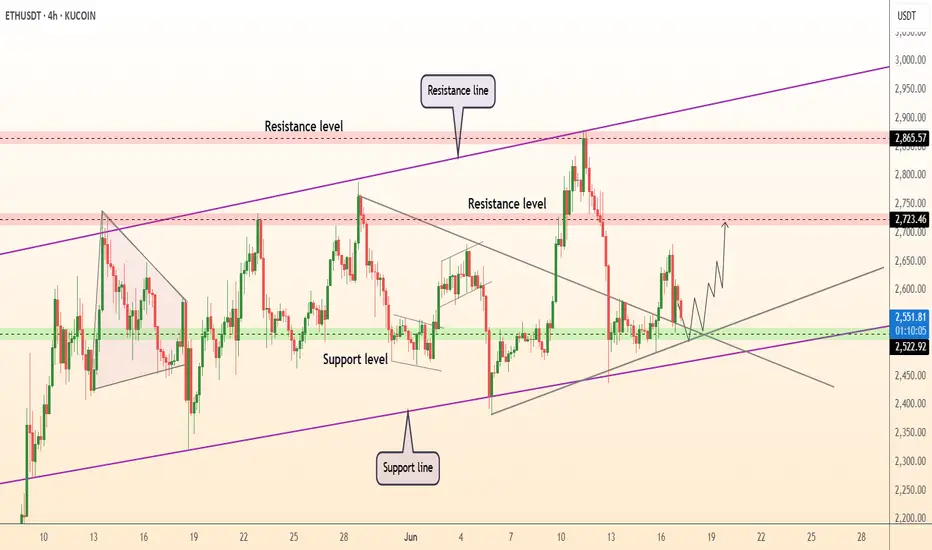
DeGRAM | ETHUSD held the trend line📊 Technical Analysis
● Price just printed a long-tailed rebound on the 4-month purple up-trend and the 2 520-2 560 demand strip, also reclaiming a broken pennant base—confirming a fake breakdown and locking the zone as fresh support.
● A higher-low sequence is compressing against the descending 2 650 trend cap; a 4 h close above it activates the 2 723 horizontal target and projects the channel-median swing toward 2 865.
💡 Fundamental Analysis
● Net staking deposits keep outpacing withdrawals while CME ether futures open-interest hit a six-week high, signalling renewed institutional hedging ahead of the spot-ETF ruling and supporting upside bias.
✨ Summary
Buy 2 540-2 580; clearance of 2 650 aims 2 723, stretch 2 865. Invalidate below 2 450.
-------------------
Share your opinion in the comments and support the idea with like. Thanks for your support!
ETH LONG✅ Trading Setup Summary
1. Setup Type:
🔹 SFP (Swing Failure Pattern) or Trap at Key Level
🔹 Possibly forming a double bottom or liquidity grab at a known support zone.
2. Market Context:
🔸 Price returns to a previous key level with a volume spike
🔸 Likely in a bullish market structure (MS) or forming a reversal after a down move
🔸 Entry based on trap logic and session volume confirmation
3. Entry Logic:
✔ Wait for a stop hunt/SFP at liquidity zone
✔ Confirm with volume spike
✔ Enter after the rejection/confirmation candle
4. Stop Loss:
📍 Set just beyond the trap wick (below for long, above for short)
🎯 SL is defined and logic-based, not random
5. Target (TP):
🎯 Use 3–4R reward for intraday/session-based trades
🎯 Consider holding for more if Daily timeframe supports a longer move
6. Timeframe:
🕐 Entry on M15/M5, context from H1/D1
📌 Key Strategy Concepts Used
Trap (SFP)
Volume confirmation
Market Structure (MS)
Key Level (Support/Resistance)
Defined SL with good RR
Session-based entry (likely Asian session scalp)

ETH | Long | 3Hrs | Target: 2,710This technical analysis is for informational and educational purposes only. It does not constitute financial advice. Remember to always research and consult with a professional before making investment decisions. Good luck! 📈💼🚀

Ethereum Futures Update (Trade Idea)After identifying clear supply and demand zones for ethereum, you can look at the chart and now identify where and when to place trades. Based on my analysis, it is best if we cross map this to the coinglass liquidation heat map to have a more clear idea on the direction that the price action moves.
Furthermore, I think we see maybe a jump back up to 2540s and the make the next move down.

ETh pump today back to $2680Opened a long position on ETH. Anticipating a pump back up to the highs of $2680, $2815 if breaks out impulsively.
Stop: $2549.08 or lower

ETH READY TO 3000$ ??? YES eth just about his support level eth can test from here 2450 than possible we can go 3k if iran or isreal war stop and at 18 june also here fomc meating where news about rate cut if not rate cut than possible market dump from here and btc or eth badly if rate cut done than also possible dump to liqudite longer for more deatile check bio
thanks for watching


When does Bolran start?Read carefullyhello friends👋
💰Many of you are asking when Bolran will start or if it will start at all, we decided to explain it to you in a full post.
Well, you can see the Ethereum chart moving in a channel, and with a drop, it created a big fear that a fall is coming, and meanwhile, the buyers returned the price to above 2000 dollars with a strong and unexpected return.
✅️Now the price is stuck in the specified box between 2200 and 2500, and if this range is maintained, the price will easily move up to the range of 3200 in the first wave, and if it fails to maintain this range, the price will fall below 1500 dollars.
🧐Now, in our opinion, due to the rapid return of the price from the channel, this failure is a fake channel and the range will be maintained, and we are likely to see Ethereum rise in the coming weeks.
🤔You know that Ethereum is the leader of altcoins, and if it grows, important altcoins will grow, which is the beginning of Bolran, and there are important altcoins that can be used for good profit.
🌟You can join us if you like.🌟
🔥Follow us for more signals🔥
*Trade safely with us*


FRD/FGDFRD happen when there is a red day after 2 or more breaks of daily high to the up side. after the trigger to the downside, it will be highly likely to continue to breakdown

false break set upafter 2 higher highs or more has been made then a day trades above the previous day's high but close back inside the range, it is D1. after the break of previous day low, it is high probable that it will continue the reversal
