ETHUSDT.P trade ideas

ETH -bullish indicationsbearish indications:
LLLH in daily
MA 21 being respected in daily time frame.
Bullish indications:
Trend line resistance is broken and acting as a support now.
Inverted hammer candle from trend line support in 1 hr
formed Inverted head and shoulder formed in 15 min .
Bullish divergence in 15 min.
Trade plan bias long @ 1579
SL:1570
TP1:1589
TP2:1597

Waiting for a buy move in the btc Seeing all the acceleration move that is happening in the market
I believe is a buy
What do you think is the market movement......

SHORT ETH🔷 Setup Summary: SFP + Key Volume Combo
1. Context:
Pattern: Double Top + SFP (Swing Failure Pattern)
Timeframe: Likely M15–H1 (possibly during Asian/European session)
Background: Price breaks previous high slightly (liquidity grab), then sharply reverses — a clear trap.
2. Confirmation:
A clear Key Volume candle appears at the top — signaling market maker action.
A strong rejection candle (pinbar or engulfing) confirms the SFP.
Price fails to hold above the new high — trap confirmed.
3. Entry Strategy:
Entry: After the SFP confirmation candle closes.
Stop Loss: Above the SFP high or Key Volume wick (a “valid” SL, not necessarily tight).
Take Profit:
Short-term: 3R (if trading intra-session).
Long-term: Target demand zone or Daily support if trend supports it.
4. Risk Management (per system guidelines):
Max risk per trade: 1–2% of account.
If setup invalidates: cut the loss immediately, don’t widen SL or overtrade.

ETH-----Buy around 2530, target 2580 areaTechnical analysis of ETH contract on June 19:
Today, the large-cycle daily level closed with a small positive line yesterday, the K-line pattern was a single positive line with continuous negatives, the price was below the moving average, and the attached indicator was dead cross. The big trend of decline is still very obvious, but for now, the continuation and strength are relatively poor, which is also the reason why the price is simple and easy to wash; the short-cycle hourly chart yesterday's European market price fell and did not break down, the US market price supported the rebound, the current K-line pattern is continuous positive, and the attached indicator is golden cross, so there is a high probability that it will rise and break the high during the day.
Today's ETH short-term contract trading strategy:
Buy at the current price of 2530 area, stop loss at 2495 area, and target 2580 area;

Ethereum Daily Chart = Coiled SpringSitting on the 200 EMA.
3x liquidity sweeps below — no breakdown.
Red dots stacking above = pressure cooker.
📉 Break $2.45K → dump
🚀 Break $2.7K → $3K squeeze
Big move coming. Don’t blink.

HolderStat┆ETHUSD accumulationBYBIT:ETHUSDT is compressing in an ascending triangle, pivoting around 2 500. A decisive break above 2 520 tees up 2 800–2 900 continuation, while closing back under 2 430 would negate the immediate setup but leave macro structure bullish.

Ethereum (ETH): Golden Buy Zone | Buyers Taking ControlBuyers are taking control near the 200EMA, which could give us a really good bounce to upper zones from here on.
We see whales accumulating the ETH, which confirms our saying that Ethereum has not yet reached its potential.
The key zone is the 200EMA as of now.
Swallow Academy
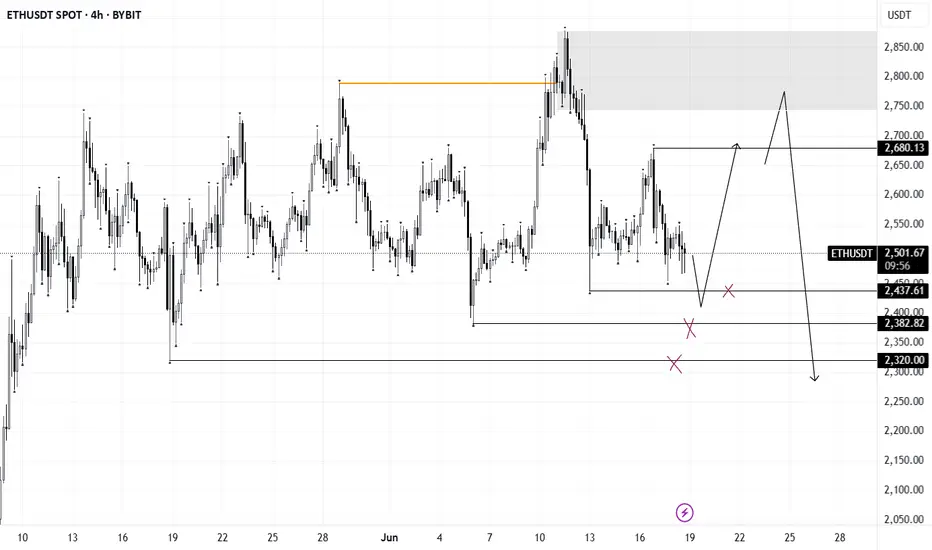
ETH - BOOM or Toink?Okay Mostly boom down, but a toink to get over most peoples liquidity and get sorted up, the probable move is this as per me

Crypto at a Crossroads: BTC, ETH & SOL – 3 Charts, 3 Messages📊 Market Overview:
The crypto market often moves together — but BTC, ETH, and SOL are telling 3 very different stories right now. From Bitcoin’s coiled spring to Ethereum’s indecision and Solana’s struggle — this divergence could define the next major trend.
1️⃣ Bitcoin (BTC): The Market’s Trigger
BTC is tightening in a Symmetrical Triangle after a powerful uptrend — a textbook Bull Pennant.
🔼 Lower highs + higher lows = pressure build-up
🔇 Volume drying up → classic pre-breakout setup
⚡ A decisive move (esp. above $ 108K) will likely lead the entire market
Bias: Bullish continuation likely, but prepare for either direction.
2️⃣ Ethereum (ETH): The Waiting Game
ETH is stuck in a rectangle range between $ 2,450–$ 2,800.
😐 Flat MAs = no short-term trend
📉 ETH is neutral → waiting for BTC to move first
Strategy: React to breakout or breakdown from range boundaries.
3️⃣ Solana (SOL): The Weakest Link
SOL shows clear signs of reversal and relative weakness.
⚠️ Double Top near $185 in May
🔻 Lost multi-month trendline
🛡️ Testing critical support at $ 140–145
🌀 Attempting a Rounding Bottom (accumulation?) but still below key MAs
Watch: Support must hold. Break below = major downside risk.
🎯 Trade Strategy:
If BTC Breaks Up (above $ 108K):
🚀 Long BTC → Targets: $ 118K–$ 120K
✅ Long ETH above $ 2,800
🧨 Aggressive Long SOL above $ 160 (trendline reclaim)
If BTC Breaks Down (below $ 104K):
⚠️ Short BTC → Targets: $ 100K, $ 98K
⚠️ Short ETH below $ 2,450
🚨 High-conviction Short SOL below $ 140 → Potential drop to $ 100 zone
❌ Invalidation:
📉 Bullish thesis invalid if BTC breaks below triangle
📈 Bearish invalidated if BTC breaks up (Stop loss above $112K)
🔚 Final Word:
BTC is the market’s steering wheel — ETH is parked, SOL is stalling.
⏳ The triangle is near apex. A breakout will ripple across all coins.
Which direction are YOU betting on? Bullish or Bearish? Drop your view below!

ETH/USDTETH remains in a consolidation phase. Attention is on the nearest liquidity zone — a sweep or reaction here could signal the next move. Failure to reclaim and hold above the $2600 level on the weekly close opens the door for a potential drop into the $2000–$2300 range, aligning with a possible manipulation phase before reversal.
Longs or shorts only considered upon clear confirmation and valid setup. No rush — let the market come to you.
ETH – Rounded Distribution Before the Punch Higher?What we’re seeing here is a potential fakeout setup within a value zone.
Notice the rounded top formation — looks bearish — but price refuses to break the low. This often sets the stage for a sharp reversal.
Structure Breakdown:
Volume profile shows acceptance in current range
Rounded top shape implies weakness — but no breakdown = trap potential
Price holds a higher low inside the range = absorption
Green box marks ideal long entry area — well-defined invalidation below
Bullish case:
We’re watching for that reclaim of the mid-level → quick push into the upper range
Target zone = 2,618 (clean inefficiency fill + local top)
Bearish trap scenario invalidated if price closes below red box (stop hunt level)
Strategy bias:
This is a compression-reversal trap — fake weakness to trap shorts, then launch.
Patience pays here — if it reclaims and consolidates at the mid, it’s time to ride.
📊 More setups like this, early in structure, are shared inside the account description. Tap in for the breakdowns.

ETH at critical levelsCRYPTOCAP:ETH is at the bottom of the structure, great risk-to-reward ratio. However, the bearish thesis needs to consider a dip to 2kish level. To make the DCA strategy work best, buying on dips is vital.
Full TA: Link in the bio

Ethereum (ETH): Are We Doomed or Will We See $3000?Struggle is huge on Ethereum, where we are at a major support area (or let's call it a neckline, as it suits it more here), which is also close to the 200EMA.
So strong a base has formed there that each time we reach that point, we see a strong bounce and dominance from buyers, and yet we always go back to that area.
So, same as Bitcoin, we wait for any more confirmations near the current zone. If we see a breakdown from the neckline area, the drop will be nasty; if we see proper buyside dominance, we will be heading for $3000. So let's wait...
Swallow Academy

HolderStat┆ETHUSD continues to accumulateOKX:ETHUSDT is catching bids at the 2.50 k rail after triangle retest, converting shakeout into upside continuation. Staying above 2.40 k keeps bias north; clearing 2.75 k releases the 3 k target rocket 🚀

ETH/USDT – 6 Weeks of Doji: The Calm Before the Storm?⏳ Summary:
Ethereum has been moving sideways for 6 straight weeks, printing back-to-back doji candles — a rare phenomenon in any market. Price is trapped, pressure is building, and volatility is near its breaking point. History shows: after this much indecision, a violent breakout is almost inevitable.
🚨 What’s Happening?
6 consecutive weekly dojis — this kind of tight-range compression hasn’t been seen on ETH in years.
Price is squeezed between $ 2,500 support and $ 2,620 resistance.
Volume has dried up, and momentum is fading (RSI flat, wedge breakdowns on 4H/1D).
Bulls and bears are in a deadlock… and that never lasts long.
The longer the coil, the harder the snap.
🎯 Trading Roadmap (No Fluff):
📈 Bullish Breakout Trigger: Weekly candle close above $ 2,620 → Potential rally to $ 2,745 and $ 2,880 (Fib zones).
📉 Bearish Breakdown Trigger: Daily or weekly close below $ 2,500 → Expect a flush to $ 2,300 and $ 2,120 support levels.
🎯 Manage risk tight. This setup offers clean invalidation and powerful upside/downside potential.
📊 Why This Matters:
Markets don’t go silent for 6 weeks without a reason. ETH is gathering energy like a coiled spring — and once direction is decided, it can move fast and far. This is the kind of setup traders wait weeks to catch.
🤔 What Do You Think?
Is ETH quiet before the pump, or are bears waiting to break it down hard?
🗨️ Drop your thoughts, charts, or counter-setups below!

My ETH Game plan of this week.Eth is being supported multiple times from a support area. It is, in fact, in a rising channel; despite being rejected multiple times, it is still making higher highs.
I am still bullish as long as it is above the support area.

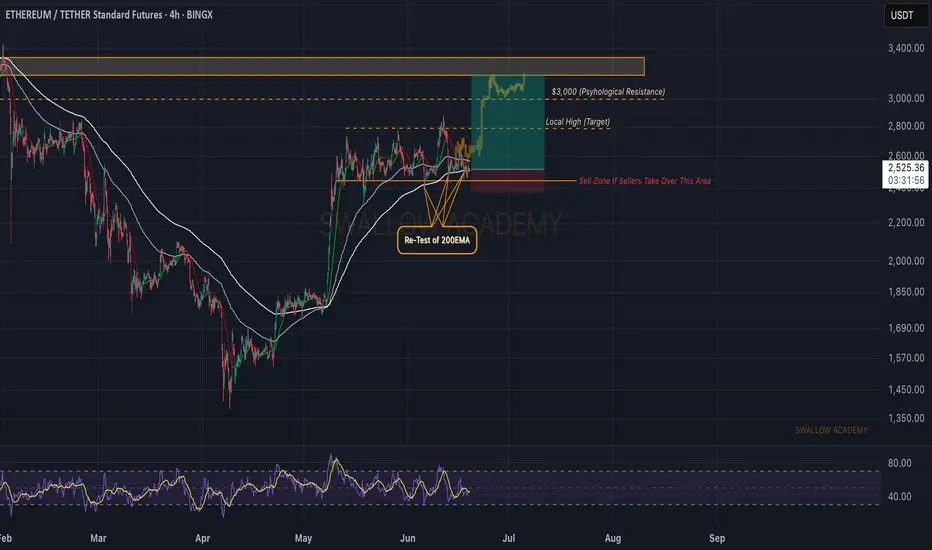
Ethereum (ETH): Stonger Than Bitcoin For SureEthereum is doing much better compared to Bitcoin, that's for sure, but it does not mean that ETH is not struggling.
We see the pressure that sellers are putting on, trying to regain the control over the 200EMA, which is a crucial area for us right now.
So while we keep our target at $3000 (first target), we also keep close attention to that moving average, where if we lose dominance, we might be heading to lows here...
Swallow Academy

ETH: The Structure Remains BearishAs of now, the overall market structure for Ethereum still appears bearish.
Here's what I'm watching:
From the NY Open, I think there's a high possibility of a quick liquidity grab to the upside followed by a correction downward.
However, this sweep may not even happen. It will largely depend on geopolitical developments, particularly the Iran-Israel conflict, which remains a major market-moving factor.
I don’t know what kind of news could trigger this, but judging by the chart, there’s absolutely nothing bullish for now and honestly, it might even get uglier than it already was between Iran-Israel.
What’s below? A lot of liquidity.
On the chart, I’ve highlighted key downside targets:
Previous Day Low (PDL)
Previous Week Low (PWL)
One Day Fair Value Gap (1D FVG)
My personal expectation: a delivery of price into the 0.705 Fibonacci zone of the recent impulse.
This area also includes the Point of Control (POC) and completes the 1D FVG fill.
That’s where I’ll be looking for a potential bullish reversal.
Outlook for July
I'm still hopeful that the market tone shifts bullish in July.
Why? I expect a wave of positive narratives:
Trump’s proposed tariff adjustments
Multiple ETF approvals (especially altcoin-related)
Retail attention coming back
The setup is forming but for now, ETH remains under bearish pressure.
Stay tuned. Take care. More to come.

Bitcoin Or Gold? Real Safe Haven In Middle East tension When the world shakes, where does money go— Bitcoin or gold ?
You may think crypto is the ultimate safe haven… but data tells a different story.
This breakdown compares digital dreams vs. physical trust —with charts, tools, and the psychology behind every move.
Hello✌
Spend 3 minutes ⏰ reading this educational material.
🎯 Analytical Insight on Bitcoin:
Contrary to common expectations, Bitcoin has shown relative resilience amid recent geopolitical tensions, refraining from a sharp sell-off.
This price behavior signals a potential shift in market psychology—something I’ll explore further in an upcoming educational post.
Based on my previous analyses, I continue to anticipate an upward breakout above the $110K resistance zone in the current structure.
Now , let's dive into the educational section,
📌 Gold: The Legacy of Trust
For thousands of years, gold has been the go-to safe asset. In wars, inflation, sanctions, and crashes—it remains the mental anchor of value. Tangible, historic, and out of government control.
🪙 Bitcoin: Revolutionary but Unstable
Bitcoin promises freedom, decentralization, and anti-inflation. But during actual crises, trust wavers. High volatility, regulatory risk, and lack of a long history make investors hesitate when fear hits hard.
🛠️ TradingView Tools That Reveal Where Smart Money Flows
One reason TradingView stands out is its wide set of tools that help you track market psychology—not just price action. When it comes to analyzing the Bitcoin-vs-Gold battle during global crises (like the Iran-Israel war), these tools are essential:
Correlation Coefficient: This shows how closely BTC and gold move together. In panic moments, it helps reveal where the real trust is flowing.
On-Balance Volume (OBV): Key for spotting where big money is headed. If OBV on gold rises while BTC’s falls, smart money isn’t betting on crypto just yet.
Fear & Greed Index Logic (DIY): While not a native TradingView tool, you can mimic it by combining volatility and volume indicators to reflect market emotion.
Overlay XAUUSD and BTCUSD: Place both on a single chart with “percentage scale” enabled. You’ll see exactly which one holds up better during chaos.
Marking Geo-Political Events: Tag key events (like missile strikes or sanctions) on your charts. Track how Bitcoin and gold react immediately after.
📊 How Investors React in Crisis
During events like an Iran-Israel war, data shows money often flows into gold—not BTC. When panic peaks, people run toward the “known,” not the “new.”
🧠 The Illusion of Crypto as Safe Haven
We want to believe BTC is the new gold. But the human mind—under threat—defaults to ancient instincts. Fear doesn’t innovate. It runs to what it knows: shiny, physical, historical gold.
💡 When Will Bitcoin Truly Compete?
When the next generation fully embraces digital assets. When institutions store BTC alongside gold. When BTC no longer crashes on scary headlines—that’s when the shift becomes real.
⚠️ Lessons from War
Wars reveal that markets don’t behave rationally in fear. Even if Bitcoin makes sense on paper, emotion drives flows. Right now, that flow still favors gold.
🔍 What to Watch Next
If, during a future conflict, Bitcoin drops less—or even rises while gold does—you may be witnessing a turning point. Until then, keep tracking both with your TradingView setups.
🧭 Final Takeaway
Gold still owns the trust game in a crisis. Bitcoin is on its way but hasn’t crossed that psychological line. If you’re a smart trader, know how to read both—and move before the herd does.
✨ Need a little love!
We put so much love and time into bringing you useful content & your support truly keeps us going. don’t be shy—drop a comment below. We’d love to hear from you! 💛
Big thanks,
Mad Whale 🐋
📜Please remember to do your own research before making any investment decisions. Also, don’t forget to check the disclaimer at the bottom of each post for more details.

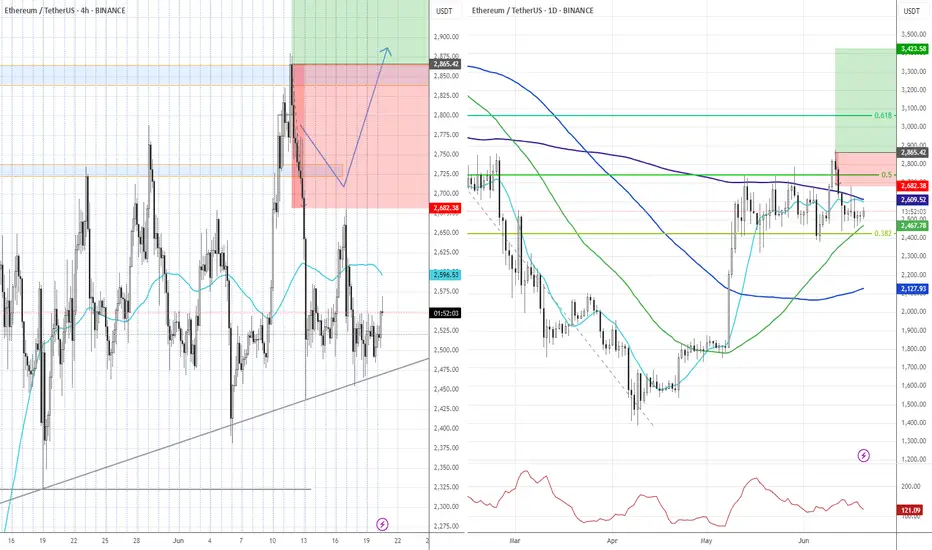
Ethereum Wave Analysis – 16 June 2025
- Ethereum moving inside sideways price range
- Likely to rise to the resistance level 2754.00
Ethereum cryptocurrency recently reversed up from the support zone between the support level 2435,00 (lower border of the active narrow sideways price range from May), lower daily Bollinger Band and the 38.2% Fibonacci correction of the upward impulse from May.
The upward reversal from this support zone continues the active minor impulse wave 3 of the intermediate impulse wave (3) from last month.
Ethereum can be expected to rise to the next resistance level 2754.00 (upper border of the active sideways price range).

ETH TREND LINESIndicated all essential trend lines on ETH chart.
Long idea based on a bullish flag. 60/40%
Target price 3600$. Bullrun scenario.
