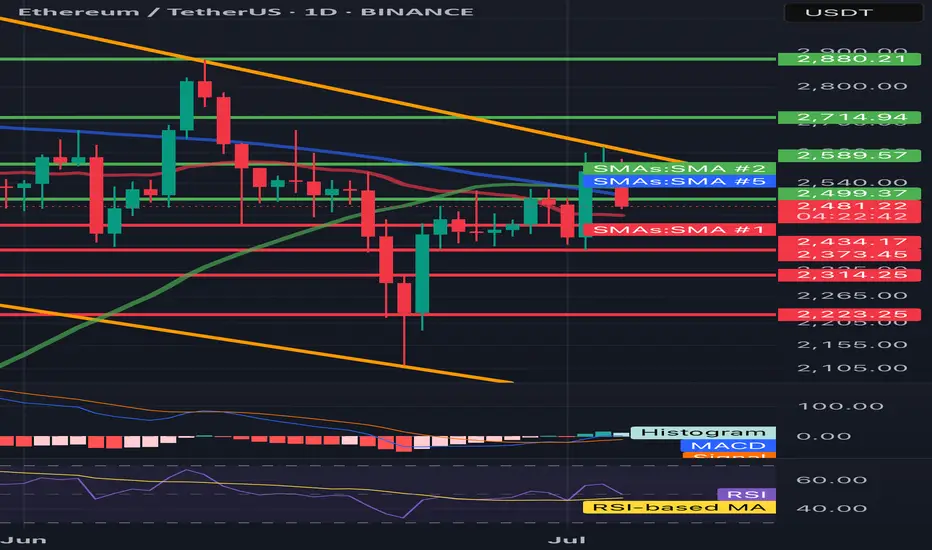
ETH/USDT 1D🔍 ETH/USDT - technical analysis (1D interval):
📉 Price: 2478 USDT (-4.36%)
🔧 Resistance:
• SMA 200 (green): ~ 2589
• Resistance zone: ~ 2715 → 2880 USDT
• SMA 100 (blue): ~ 2500 (just rejected)
🔧 Support:
• SMA 50 (red): ~ 2434 - currently tested
• Strong support: 2373, 2314, 2223 USDT
📊 indicators:
• MacD: freshly intersected, but the momentum is weakening
• RSI: ~ 45 - neutral/weak, under 50 (no bull strength)
• Trend: Still in the downward channel (yellow trend lines)
⸻
⚠️ Conclusions:
• Price rejected from 2500 (SMA 100) and flies down.
• If 2434 falls, a further discount is possible to 2373–2314.
• Lack of bulls with key resistance - the inheritance scenario dominates.
• Watch behavior at 2434 - this is now a key level.
ETHUSDT.P trade ideas
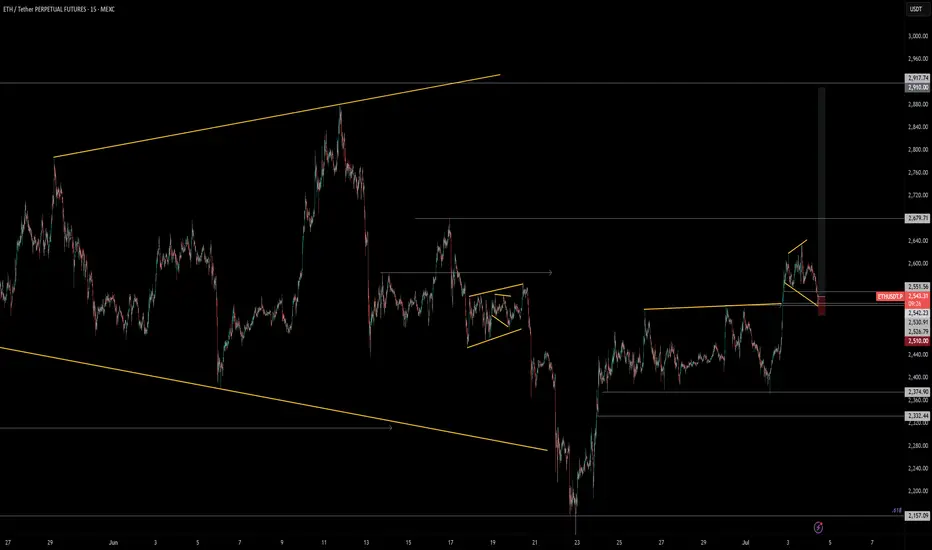
ETH/USDT at Critical Decision Point: Breakout or Rejection AheadETH is pressing into a major confluence zone between two key trendlines. Price is currently testing both diagonal resistance and horizontal support, making this a pivotal area to watch 👀
📍 Scenario 1 – Bullish:
If ETH can break above Resistance Zone #1 and hold, there’s clear upside toward $2,900 (Resistance Zone #2). A confirmed breakout could mark the start of a new short-term uptrend.
📍 Scenario 2 – Bearish:
Failure to hold Support Zone #1 could send price back into the lower range, with $2,300 and $2,100 in play. Watch for rejection from the descending trendline and a break of the rising channel.
This post is for educational purposes only — not financial advice. Use your own judgment and proper risk management when trading.
#ETH #Ethereum #TechnicalAnalysis #TradingView #BreakoutWatch #SupportResistance #CryptoTA #QuantTradingPro

Ethereum Technical Analysis – Key Support Levels to Watch!🚨 Ethereum Technical Analysis – Key Support Levels to Watch!
After a strong rally in recent days, Ethereum (ETHUSDT) is now experiencing a healthy correction. The $2,440 zone is currently acting as a crucial support level that could determine the next move.
📉 If price breaks below this level, the next major support lies around $2,270, which could become a key area for bulls to step in again.
💡 All the important support and resistance levels are clearly highlighted on the chart. This is a must-watch zone for short-term traders!
🔔 Follow for more daily updates on Ethereum, Bitcoin, and altcoin setups!
#ETH #Ethereum #CryptoAnalysis #TradingView #TechnicalAnalysis #ETHUSDT

ETH SWING TRADEETH Showing strong momentum against BTC, July is also good for eth and some alts, maybe we see correction in Aug, September but before expected pullback towards 2.9k-3k. Must use SL as market is very Volatile these days.
HolderStat┆ETHUSD correctedKUCOIN:ETHUSDT is moving inside a rising wedge after reclaiming support near $2,500. Recent breakout from consolidation supports a continuation push toward $2,720–$2,760. The current trendline structure and bullish price action suggest upside potential.

Ethereum (ETH): $2800 Is Next TargetEthereum had a good rally where buyers took control over EMAs, whereafter a successful retest, buyers are back in the game (hopefully).
We are starting to look for another long entry on the COINER at $2,600; once we see a proper BOS in this region, we will be opening a long position.
Swallow Academy
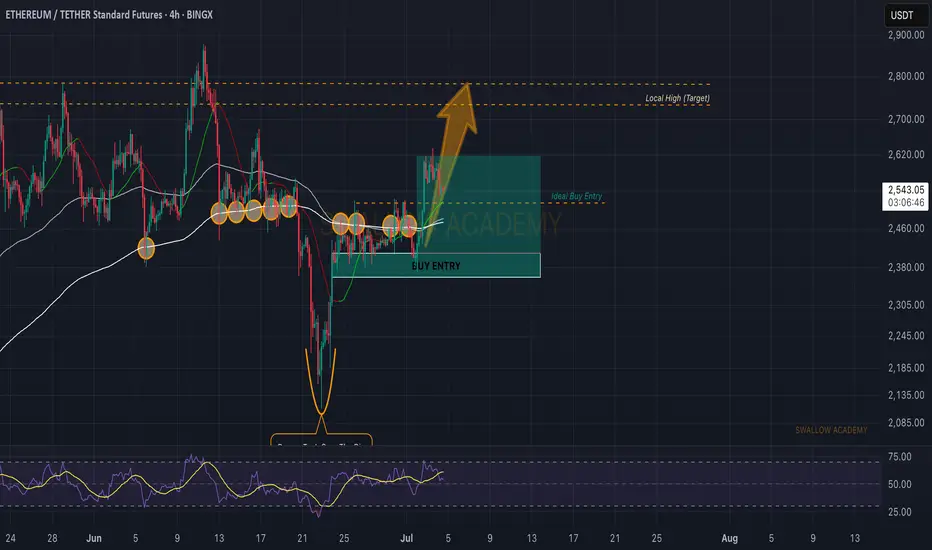
ETH Bullish Update
Ethereum is looking bullish, and is respecting clearly defined support and resistance levels.
In my primary count, we have finished black wave 1. The question is to determine if black 2 is already finished, which could lead to strong upside.
There is no way to know without further price action, and a break of green resistance is a very bullish signal.

ETH SHORT SCALP ! to 2500
Executed an ETH short from the earlier setup — took 75% profit at TP1, then let the rest run.
Price pulled back into the secondary zone, added to the position with structure confirmation.
Let it roll into the next leg — clean execution, solid momentum follow-through.
+113.84% on the full move, managed with scale-out and conviction on the retest.
Patience paid. System did the work.

Momentum Reload: Next Scale-InHello traders,
First position still floating. The scale-in has been executed. The structure is clear, and the positioning, sequence, and entry are all solid. I'm comfortable taking a potential loss on this position. Stops from the previous trade have been moved to the current stop-loss level, making the overall position risk-free.
I'll release a video soon to walk you through the details.
Stay safe chads! Peace
MEXC:ETHUSDT.P
BINANCE:ETHBTC
CRYPTOCAP:TOTAL
Ethereum in JULYEthereum should close above $3000 by the end of July to stay in the bull run, Monthly candle is so important now.

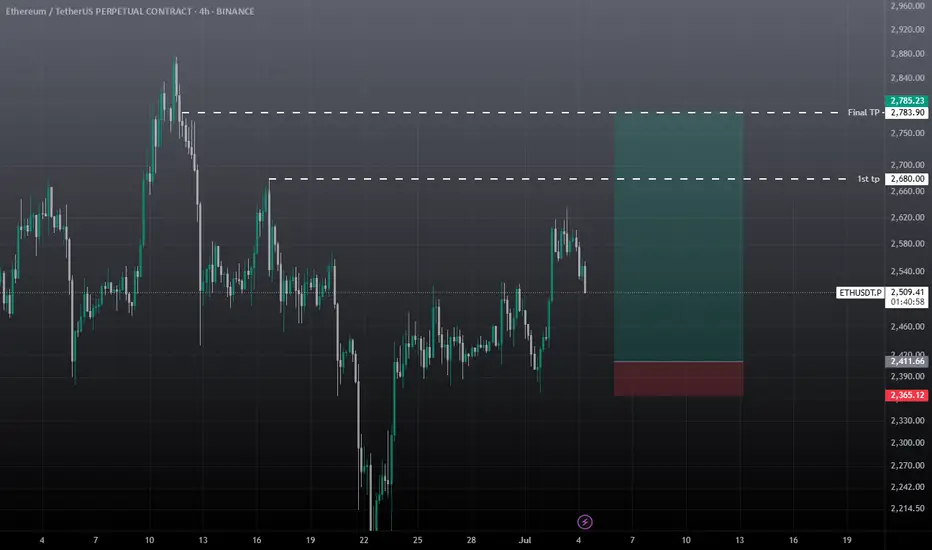
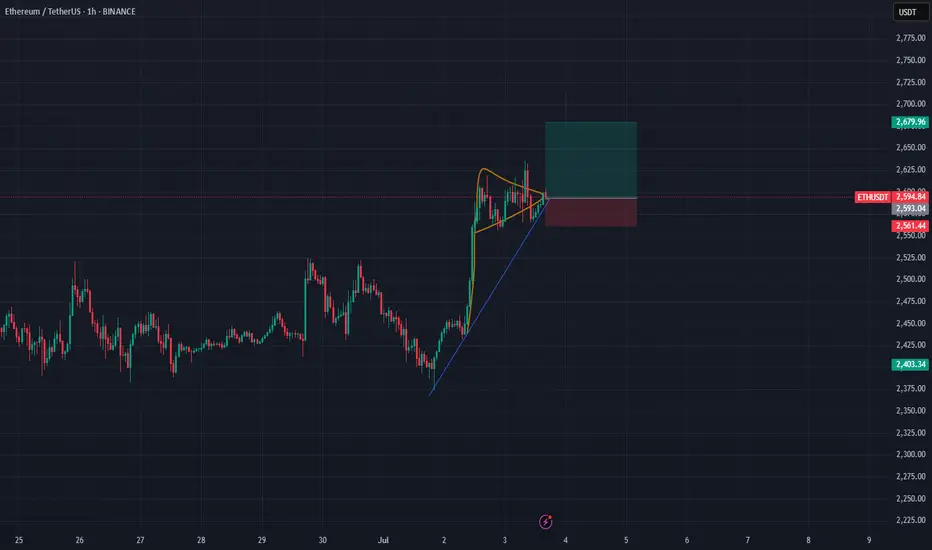
ETH/USDT – Symmetrical Triangle Breakout Setup (1H Chart)After a strong bullish impulse, ETH is consolidating in a symmetrical triangle formation — a classic continuation pattern. Price is coiling up near the apex, with higher lows forming against a horizontal resistance line.
Setup Highlights:
Pattern: Symmetrical Triangle (1H)
Trend: Bullish continuation after breakout
Entry Zone: ~2592 USDT
Target: 2679 USDT (upper green box)
Stop Loss: Below 2561 USDT (lower red box)
Risk-Reward: Favorable R:R structure
Watching closely for a decisive breakout above the triangle resistance to confirm bullish momentum continuation.
Let me know what you think — bullish continuation or fakeout risk?
#Ethereum #ETHUSDT #CryptoTrading #TechnicalAnalysis #BreakoutSetup #TradingView
HolderStat┆ETHUSD seeks to the $2750 levelBINANCE:ETHUSDT is holding above 2,350 and breaking out of consolidation within an expanding wedge. With structure pointing to bullish continuation, a move toward 2,800 is likely if this support level continues to hold.

ETHUSDT Long Term Structure Signals Imminent ExpansionEthereum has been consolidating within a large-scale symmetrical pennant formation following its peak at $4,851. This macro structure, spanning several years, reflects sustained accumulation within a clearly defined corrective range, bounded by well-established trendline support and resistance.
After reaching its all-time high, ETH entered a structured correction that has unfolded into what appears to be an ABCDE wave pattern. Currently, price action is developing near point D, approaching the upper boundary of the pennant a crucial area that could define the next directional move.
In addition, the daily chart presents a developing Inverse Head and Shoulders (IH&S) pattern, with the neckline anchored around $2,855. This level is acting as a key resistance, temporarily halting ETH’s short-term upside. A confirmed breakout above the neckline would likely validate both the IH&S and the breakout from wave D, setting the stage for a potential expansion move toward the $6,000 target and beyond.
However, in the event of a temporary rejection at the neckline or pennant resistance, a retracement toward wave E becomes likely. This would bring price back into the $1,400–$1,800 support region a high-confluence demand zone that aligns with the long-term ascending trendline, previous breakout levels, and multiple historical reaction points. This zone may serve as a base for a strong bullish reversal.
Recent price behavior shows compressed volatility and increased buying interest on dips, reinforcing the possibility of an imminent directional breakout. A decisive move outside this macro structure may mark the beginning of a new phase of long-term price expansion.
Share your view with us in the comments, how do you see ETH playing out from here?

Ethereum (ETH): Good Bounce | $2800 IncomingWe had a rather sharp but clean breakout recently where price has shown us that buyers are dominating currently, pushing the price toward the local high at $2800. This is our current target and so far ETH had been perfoming more than well.
Swallow Academy

ETH Completes a Clear Bullish Flag Pattern! What’s Next?ETH Completes a Clear Bullish Flag Pattern! What’s Next?
Yesterday, Ethereum completed a bullish flag pattern.
This is a clear signal that bulls are already increasing their long positions.
If this is not a false breakout, then ETH could start from a normal bullish move to a larger one.
Today’s NFP data and the US market's preparation for a long weekend before the 4th of July could support this bullish scenario.
Key Target zones: 2680, 2790 ,and 3080
You may find more details in the chart!
Thank you and Good Luck!
PS: Please support with a like or comment if you find this analysis useful for your trading day

80% win rate strategy with TiqGPTul 3, 2025 7:59 AM
1h1h Chart
15m15m Chart
5m5m Chart
1m1m Chart
Buy Opportunity
Bullish Setup
Buy: ** Buy limit order at $109,340.36 following a retest of the consolidation zone confirming continued buying interest.
Entry: $109,340.36
Strategies: Multi-timeframe bullish order flow analysis, liquidity targeting above current levels.
Confidence: Medium
Risk/Reward: Calculated as follows:
Timeframe: The 1-hour chart shows a strong bullish impulse followed by a consolidation phase, indicating a potential accumulation by institutions. The price is currently testing a minor consolidation zone around $109,340, which could act as a temporary resistance.
Disclaimer: The information provided by this app is for educational and informational purposes only and does not constitute financial advice. Always do your own research before making any trading decisions. TiqGPT is not a licensed financial advisor.
Mark as Successful
Mark as Failed
T
Jul 3, 2025 8:00 AM
MARKET NARRATIVE:
1H Timeframe: The 1-hour chart shows a strong bullish impulse followed by a consolidation phase, indicating a potential accumulation by institutions. The price is currently testing a minor consolidation zone around $109,340, which could act as a temporary resistance.
15M Timeframe: The 15-minute chart reveals more granularity within the bullish structure, showing a series of higher lows and higher highs. This is indicative of continued buying interest and a lack of significant selling pressure at these levels.
5M Timeframe: On the 5-minute chart, the bullish momentum is more pronounced with a clear impulsive move upwards. The recent pullbacks are shallow, suggesting that the market is not ready to reverse but rather is gathering strength for further upward movement.
1M Timeframe: The 1-minute chart provides a detailed view of the buying pressure. The price action is making higher highs and higher lows, confirming the bullish sentiment observed in higher timeframes.
INSTITUTIONAL THESIS:
Institutions appear to be in an accumulation phase, likely targeting higher liquidity zones above the current price level. The consistent higher highs and higher lows across timeframes suggest a coordinated effort to push prices upward, possibly aiming for a significant liquidity pool above the $110,000 mark.
LEARNING POINT:
"Multi-timeframe confluence of bullish order flow and shallow pullbacks indicating strong buying interest."
SIGNAL: BUY
SYMBOL: BTC/USDT ENTRY PRICE: $109,340.36 STOP LOSS: $109,000.00 (just below the recent minor consolidation zone on the 1H chart) TARGET PRICE: $110,000.00 (next psychological and liquidity-rich level) CONDITION: Buy limit order at $109,340.36 following a retest of the consolidation zone confirming continued buying interest. RATIONALE: The trade is based on the alignment of bullish signals across multiple timeframes, shallow pullbacks indicating strong buying interest, and the targeting of higher liquidity zones. STRATEGIES USED: Multi-timeframe bullish order flow analysis, liquidity targeting above current levels. URGENCY: MEDIUM TIMEFRAME: Short-term CONFIDENCE SCORE: 85% RISK/REWARD RATIO: Calculated as follows:
Risk: $109,340.36 - $109,000.00 = $340.36
Reward: $110,000.00 - $109,340.36 = $659.64
Ratio: $659.64 / $340.36 ≈ 1.94:1
FINAL RECOMMENDATION:
WAIT - Although the bullish setup is strong, the risk/reward ratio of approximately 1.94:1 does not meet the minimum requirement of 2:1. It is advisable to wait for a better entry point that offers a higher potential reward relative to the risk or for the market to provide a deeper pullback to improve the risk/reward ratio.
Jul 3, 2025 8:01 AM
1h1h Chart
15m15m Chart
5m5m Chart
1m1m Chart
Hold - Waiting for Setup
Wait for Confirmation
Wait: Immediate market order based on current momentum.
Entry: $155.85
Stop Loss: $152.00
Target: $160.00
Strategies: Multi-timeframe BOS confirmation, Institutional Accumulation Phase
Confidence: 90%
Risk/Reward: Risk=$3.85, Reward=$4.15, Ratio=1:1.1 (Below 2:1 minimum)
Timeframe: Short-term
Disclaimer: The information provided by this app is for educational and informational purposes only and does not constitute financial advice. Always do your own research before making any trading decisions. TiqGPT is not a licensed financial advisor.
Mark as Successful
Mark as Failed
T
Jul 3, 2025 8:01 AM
MARKET NARRATIVE: The analysis across the four timeframes (1h, 15m, 5m, 1m) for SOL/USDT shows a consistent upward trend with a series of higher highs and higher lows, indicating a strong bullish momentum. The price action on the 1-hour chart shows a clear break of structure (BOS) above previous highs around $152, suggesting institutional buying pressure. This BOS is confirmed across the 15-minute and 5-minute charts, where we see continued bullish candles without significant retracement, indicating a lack of selling interest and potential accumulation by institutions. The 1-minute chart provides a more granular view of the buying pressure, showing tight consolidations followed by upward thrusts, typical of institutional demand in lower timeframes.
INSTITUTIONAL THESIS: Institutions appear to be in an accumulation phase, targeting higher prices. The consistent demand and absence of deep pullbacks suggest a strategy to absorb sell orders and push prices higher, likely aiming for liquidity above recent highs.
LEARNING POINT: The observed price action across multiple timeframes demonstrates a classic accumulation phase with a strong bullish momentum, indicating that institutions are supporting the upward move.
SIGNAL: WAIT SYMBOL: SOL/USDT ENTRY PRICE: $155.85 STOP LOSS: $152.00 (just below the recent structural break) TARGET PRICE: $160.00 (next psychological round number and potential liquidity area) CONDITION: Immediate market order based on current momentum. RATIONALE: Calculated risk/reward ratio of 1:1.1 (Risk=$3.85, Reward=$4.15) does not meet minimum 2:1 requirement. Waiting for better institutional setup with improved risk parameters. STRATEGIES USED: Multi-timeframe BOS confirmation, Institutional Accumulation Phase URGENCY: HIGH TIMEFRAME: Short-term CONFIDENCE SCORE: 90% (based on strong bullish signals across all observed timeframes) RISK/REWARD RATIO: Risk=$3.85, Reward=$4.15, Ratio=1:1.1 (Below 2:1 minimum)
RISK/REWARD CALCULATION: Risk = Entry Price - Stop Loss = $155.85 - $152.00 = $3.85 Reward = Target Price - Entry Price = $160.00 - $155.85 = $4.15 Ratio = Reward ÷ Risk = $4.15 ÷ $3.85 ≈ 1.08
Given that the calculated risk/reward ratio is less than 2:1, the recommendation is to WAIT for a better entry point or a more favorable risk/reward setup. The current market conditions are bullish, but the trade does not meet the strict institutional criteria for a minimum 2:1 risk/reward ratio.
Jul 3, 2025 8:04 AM
1h1h Chart
15m15m Chart
5m5m Chart
1m1m Chart
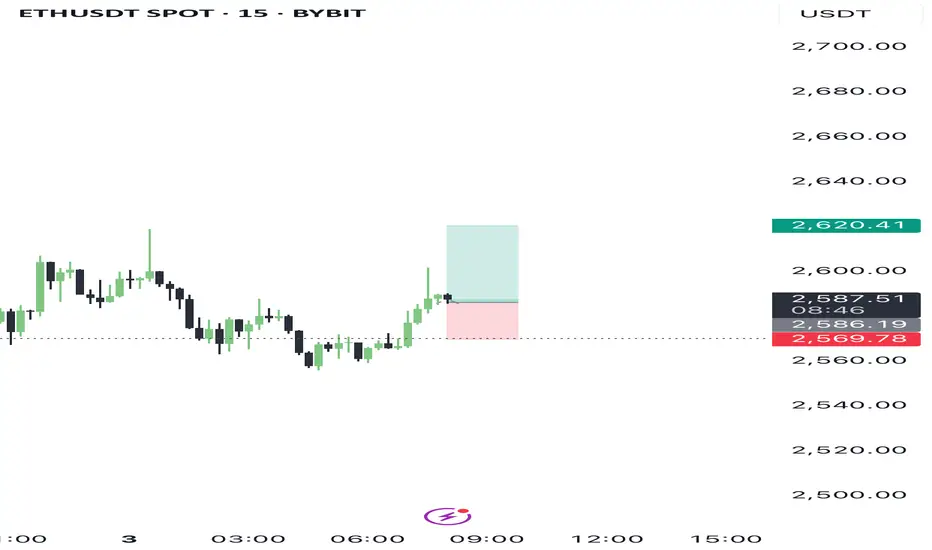
Buy Opportunity
Bullish Setup
Buy: Buy limit order at current market price with confirmation of continued buying pressure and no break of recent higher lows.
Entry: $2586.00
Stop Loss: $2570.00
Target: $2620.00
Confidence: 85%
Risk/Reward: Risk=$16.00, Reward=$34.00, Ratio=1:2.1
Timeframe: Short-term
Disclaimer: The information provided by this app is for educational and informational purposes only and does not constitute financial advice. Always do your own research before making any trading decisions. TiqGPT is not a licensed financial advisor.
Mark as Successful
Mark as Failed
T
Jul 3, 2025 8:04 AM
MARKET NARRATIVE:
Analyzing the ETHUSD pair across multiple timeframes (1H, 15M, 5M, 1M), we observe a consistent pattern of upward momentum followed by consolidation, suggesting a phase of accumulation and potential preparation for a further upward move. The 1H chart shows a strong impulsive move followed by a tight consolidation, indicating strong buying interest and limited selling pressure. The 15M and 5M charts display similar characteristics with price making higher lows, a sign of sustained buying pressure. The 1M chart, while more granular, shows some pullback, which could be interpreted as a liquidity hunt within a bullish structure.
INSTITUTIONAL THESIS:
Institutions appear to be in an accumulation phase, using smaller timeframes to engineer liquidity sweeps (collecting stop losses below minor swing lows) before potentially driving the price higher. The consistent higher lows across timeframes support this thesis, suggesting an underlying strength in buying pressure.
LEARNING POINT:
The current setup exemplifies "Institutional Accumulation with Liquidity Sweeps" where smart money uses minor pullbacks to gather more positions favorably, anticipating a continuation of the trend.
SIGNAL: BUY
SYMBOL: ETHUSD
ENTRY PRICE: $2586.00
STOP LOSS: $2570.00
TARGET PRICE: $2620.00
CONDITION: Buy limit order at current market price with confirmation of continued buying pressure and no break of recent higher lows.
RATIONALE:
Market Structure: Higher lows on 15M and 5M charts indicate sustained buying interest.
Order Flow: Accumulation evident from tight consolidations and quick recoveries from dips.
Liquidity: Recent pullbacks likely served as liquidity hunts, setting the stage for a potential upward continuation.
Strategies Used: Multi-timeframe analysis confirms institutional buying pressure and accumulation phase.
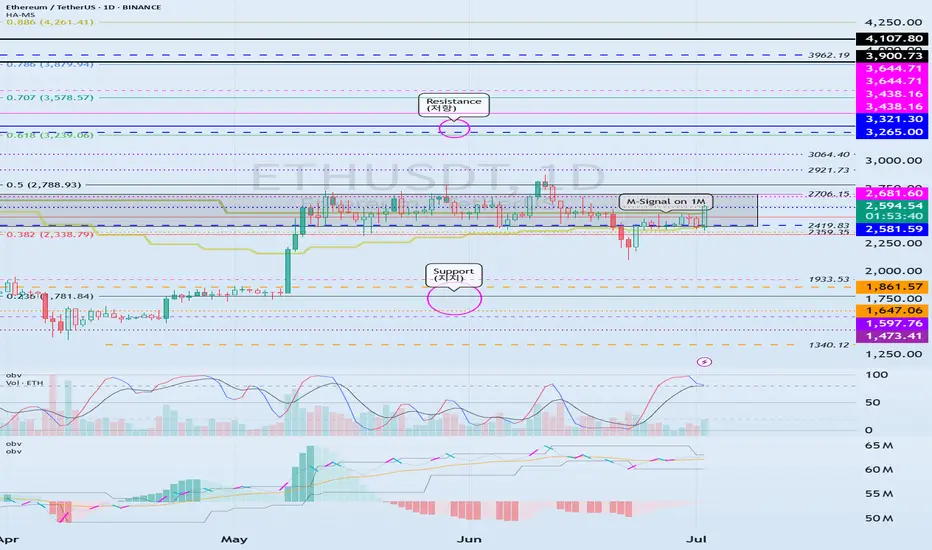
ethusdt.1hETH/USDT analysis on the hourly time frame, based on trend analysis, support and resistance.

Important Support and Resistance Areas: 2419.83-2706.15
Hello, traders.
Please "Follow" to get the latest information quickly.
Have a nice day today.
-------------------------------------
(ETHUSDT 1D chart)
The key is whether ETH can find support in the 2419.83-2706.15 area and rise.
This is because this section is the section that needs to be supported in order for a full-fledged uptrend to begin.
Therefore, if you are trading ETH, you can proceed with a purchase when support is confirmed in the 2419.83-2706.15 section.
-
Thank you for reading to the end.
I hope you have a successful transaction.
--------------------------------------------------
- Here is an explanation of the big picture.
(3-year bull market, 1-year bear market pattern)
I will explain the details again when the bear market starts.
------------------------------------------------------
ETH 50MA Reclaims 0.5 FibInteresting take on ETH daily using just the 50MA and Fib levels.
Notice how the 50MA has interacted with the Fib levels since June 2021.
In May 2025, the 50MA crossed below the 0.618 Fib level, marking the bottom of the December 2024 drop.
The 0.5 Fib acted as support in October 2024 during the double top formation at the 0.236 Fib.
Now, the 50MA has crossed back above the 0.5 Fib.
As long as price holds above this 0.5 Fib level, the odds of further upside remain stronger.
Always take profits and manage risk.
Interaction is welcome.

ETH | Long | 3 Hrs | Target: 2,540This technical analysis is for informational and educational purposes only. It does not constitute financial advice. Remember to always research and consult with a professional before making investment decisions. Good luck! 📈💼🚀

ETH/USDT : Gearing Up for a Major Breakout? (READ)By analyzing the Ethereum chart on the weekly timeframe, we can see that the price has started rising just as expected and is now approaching the first target. For now, ETH faces major resistance in the $2,600–$2,900 zone.
If price breaks above this key area, I expect a strong bullish move from Ethereum!
Based on the main analysis, the short-term targets are $2,700 and $2,890, while the mid-term targets are $3,100 and $4,100.
Please support me with your likes and comments to motivate me to share more analysis with you and share your opinion about the possible trend of this chart with me !
Best Regards , Arman Shaban

Lingrid | ETHUSDT Price Compression and Expansion PhasesBINANCE:ETHUSDT is struggling to hold gains after a rejection from the top of the range, with price retracing back toward the breakout point and key trendline support. The structure remains intact above 2,363, where bulls may attempt another rebound. A sustained move above the blue ascending trendline would open the way toward the 2,650 target, completing the projected rebound path.
📈 Key Levels
Buy zone: 2,363–2,400
Sell trigger: breakdown below 2,363
Target: 2,650
Buy trigger: breakout and retest of 2,475–2,500 with volume
💡 Risks
Failure to hold the trendline could push price toward 2,159
Weak follow-through may stall near 2,550
Bearish engulfing from current range top can trap early buyers
If this idea resonates with you or you have your own opinion, traders, hit the comments. I’m excited to read your thoughts!

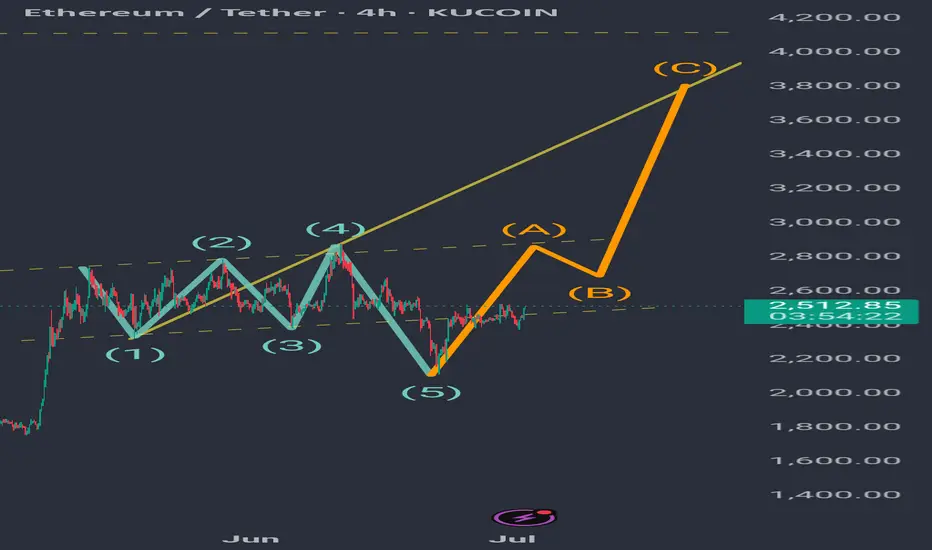
A probability: Bullish Wolve Wave on ethEth hit a low near $1,400 in early April and from there charted a sharp rise, doubling its price. Around $2,800, it clearly encountered resistance corresponding to the 0.5 Fibonacci of the previous downward movement. From that point, it moved sideways in a range whose downward breakout reached the 0.5 Fibonacci of the current upward movement, $2,113, where it found strong support and has returned to the range. So far, this appears to be forming a bullish Wolve wave, whose target would be reached at the yellow line, which is the projection of waves 1 and 4 connecting. If Eth manages to break through the range and consolidate above it, it is very likely to achieve that target.