ETH ETH Chart showing upside momentum. Because Ethereum moving internal structure move. It's indicating the trend reversal. So currently Ethereum moving up side is possible.
Next Ethereum took the inducement (💎3) or mitigate orderblock (1) and move up side.
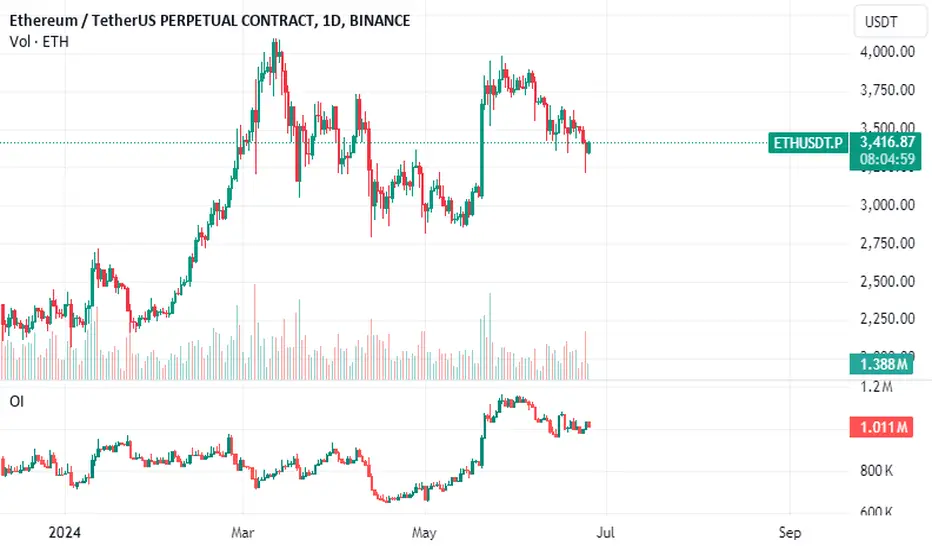
ETHUSDT.PS trade ideas

ETHUSDT 5DETH ~ 5D
#ETH Make purchases gradually on this support block. in anticipation of Fomo on ETH ETF trading early next month. short term target of at least 15%+

Perfect Long Entry on ETHoh that was so perfect entry for long on the ETH using our indicator
AD_Trade Master..
Now you guys can see it gives perfect buy & sell signals...

ETHUSDT: Price is rose from $2800 to $3700, Wait for Correction!ETHUSDT, rose from our first entry at 2800$ to $3700, however, price rose rapidly and left gap. Which is why we think price will make strong correction and fill the area. We can expect the strong rebound from our area towards $4700.
**If you like our ideas then please like, comment and follow for more**
Team SetupsFX_

Is Ethereum trending up?📊According to the buying pressure in the market, if the range of 3500 units is broken and the price stabilizes above it, the price may increase to the range of 3600 units🎯, and if the range of 3750 units🎯🎯 is strong.
📊Otherwise, the price may drop to the range of 3200 units.

ETH PricePer the technical analysis, ETH price cools off around $3400 and is waiting for the upcoming Spot ETF approval, post that a massive pump in the price could be seen ahead.

ETH LongI am bullish on Eth Bcz sweep range low on daily time frame and reclaim it and now doing accomulatiion after that complete order taking then claim the range high simple structure Sl is mentioned now let see I am wrong or right.

Ethereum ETH currently facing this order block (2) and moved up. Yesterday Ethereum showing some sell side move. Currently showing some up side move. But ETH sweep the swing high (💀). So, If this order block (2) was fail, ETH moving downside.

$ETH LONG Market structure is already bullish on leading altcoins like FET , i expect ETH to follow plus bullish news of etf flow as a catalyst , invalidations and targets are clear in chart .

Ethereum (ETH): 100EMA Is Being Tested + Possible Short?Ethereum has a similar pattern to Bitcoin, with 2 fakeout zones formed near the local ATH zone (within our timeframe).
With that being said, Ethereum is also testing the 100EMA and looking to fully secure it before moving back to testing the 200EMA.
We are waiting for a breakdown and a movement to 200 EMA (potentially breaking it as well).
Swallow Team

Opened ETH UP position at 3560 price with 5x leverageHi everyone,
Ethereum price decreased on almost 15% and this provides good opportunity to buy it with a discount.
After falling below 3400 level ETH price started to recover from this dip and currently looks stronger than Bitcoin.
Also, there have been news that ETH ETF trading can start as soon as 2 July.
I opened ETH UP position at 3560 price with 5x leverage on Fybit trading platform.
Target for this trade is 3830, Stop loss at 3350.
Please, do not forget to boost this idea & share it with your friends; thanks.


TECHNICAL ANALYISIS WITH TRADE PLAN ETH /USDT ON 1H TIMEFRAME BIAscending Channel:
The chart shows Ethereum moving within an ascending channel, which generally indicates a bullish trend. The price recently broke below the ascending channel, suggesting a potential correction.
Support and Resistance Levels:
Support levels are identified around 3,300 and 3,200 USDT.
Resistance levels are around 3,400 and 3,600 USDT.
Indicators:
VMC Cipher B Divergences: Mixed signals with some bearish and bullish divergences. The current state suggests a bearish divergence.
RSI (Relative Strength Index): Currently at 49.51, indicating a neutral position. No clear overbought or oversold condition.
Stochastic RSI: Shows an oversold condition with a value of 17.22, which might indicate a potential buying opportunity soon.
Trading Plan:
Intraday Trading:
Entry: Look for long positions if the price shows a strong support bounce around 3,300 USDT.
Exit: Target the first resistance level around 3,400 USDT.
Stop Loss: Place a stop loss slightly below the support level at 3,280 USDT.
Strategy: Monitor shorter time frames (e.g., 15-minute chart) for bullish candlestick patterns or momentum indicators turning positive before entering.
Scalping:
Entry: Enter long positions at support levels identified on the 5-minute chart, especially if there is a double bottom or strong reversal pattern.
Exit: Quick profits at minor resistance levels or key moving averages on the same chart.
Stop Loss: Tight stop loss just below the immediate support levels, such as 3,290 USDT.
Strategy: Use high-frequency trades to capitalize on small price movements, considering both support and resistance levels.
Swing Trading:
Entry: Consider entering long positions if the price bounces from 3,300 USDT support level, confirming a reversal.
Exit: Aim for the resistance level around 3,600 USDT.
Stop Loss: Place a stop loss around 3,200 USDT to protect against deeper corrections.
Strategy: Hold the position for a few days to a week, allowing the trade to develop. Use the daily chart to identify entry and exit points.
My advice:
Long Position: Favor long positions at current levels, given the oversold conditions on the Stochastic RSI and the presence of support around 3,300 USDT. Watch for a confirmed reversal signal before entering.
Short Position: Consider short positions if the price fails to hold the 3,300 USDT level and breaks lower, aiming for the next support at 3,200 USDT.
Risk Management: Always use stop losses to manage risk and protect capital. Adjust stop loss levels according to the volatility and trade timeframe.
Overall, the current technical setup suggests a cautious long bias, waiting for confirmation of support holding and potential reversal signals before entering trades.

ETHUSDT. Trading opportunityDaily Timeframe Analysis:
The price formed a sideways movement on the daily timeframe starting in February 2024. The buyer's vector 8-9 reached its mandatory target, and now the seller's vector 9-10 is relevant with a potential target of 3301.9 (the upper boundary of the buyer's zone, which was formed at the base of vector 8-9, indicated by the blue rectangle on the chart). The seller initiated their vector and formed a seller's zone at the beginning of the vector (red rectangle on the chart, lower boundary at 3624.28).
Sales Strategy:
Sales can be considered as an idea of realizing the seller's vector 9-10 from the seller's defense of the level 3659.01, which is a test of the buyer within the formed seller's zone. The potential target is 3301.9. On the hourly timeframe, the level 3659.01 serves as the seller's defense level for the breakout from the sideways movement. So on this timeframe, you can look for signs of the seller defending the level. If the seller does not defend this level, there is a high probability that the buyer will reach 4000.
Purchases Strategy:
Purchases are advisable to consider after the price interacts with the buyer's zone at the base of vector 8-9 (blue rectangle on the chart, upper boundary at 3301.9).

ETH. Buying opportunitiesHi traders and investors!
The seller's vector 9-10 reached its mandatory target in the sideways range on the daily TF from the previous review. It's time to update the possible scenarios.
Daily Timeframe Analysis
On the daily timeframe, the price has formed a sideways range that began in February 2024. The seller's vector 9-10 reached its mandatory target with a low of 3240, and now the buyer's vector 10-11 is relevant with a potential target of 3977. The first obstacle for the buyer is the high of the last seller's bar at 3435. The price has not yet interacted with this level. Since the price is at the lower boundary of the sideways range on the daily timeframe, it makes sense to start looking for buying opportunities. Let's look at the lower timeframe.
Hourly Timeframe Analysis
On the hourly timeframe, the price has formed a sideways range. The seller's vector 4-5 exited the boundary of the range, and then the buyer absorbed the attacking range boundary candle of the seller, forming a buyer's zone at the end of the seller's vector (blue rectangle on the chart). Currently, the buyer's vector 5-6 is relevant with a potential target of 3653. The price is at the lower boundary of the sideways range on the hourly timeframe, so it makes sense to start looking for buying opportunities.
Buying opportunities
Buying opportunities can be sought from the idea of realizing the buyer's vector 10-11 in the sideways range on the daily timeframe or from the idea of realizing the buyer's vector 5-6 in the sideways range on the hourly timeframe.
From the protection by the buyer of the lower boundary of the sideways range at 3362 on the hourly timeframe.
From the protection by the buyer of the level 3345, which is the test of the seller of the formed buyer's zone at the end of the seller's vector 4-5 on the hourly timeframe.
From the protection by the buyer of the level 3240, which is the test of the seller of the formed buyer's zone at the base of the buyer's vector 8-9 on the daily timeframe.
After the buyer absorbs the daily candle of June 24, 2024 on the daily timeframe (conservative strategy).
Please don't forget to like, comment and follow to support me, I really appreciate it!

Ethereum ETH moved up side. This circle I marked shows a some reversal. So some down side move possible.
Order block (1) was support zone. But it was not a stronger support zone. Because this zone was big bearish candle inside range.

ETH/USDT
Eth has made a low around 3240.
We can look to grab eth in spot around 3300$ to 3250
Soon we will share a good long position in ETH
Keep an eye on it.

#LQR #TOBTC #ETHUSDTin these Road map , it is must most important 3734.13 - 3628.72 Resistance area , which is play as Confirm level
and important support area around 3212.63 - 3072.80 since this level are supporting nothing worries about
next supp levle are painted
allwys DYOR

#ETH is approaching the periodic resistance zone📊#ETH is approaching the periodic resistance zone🔥
🧠We had a good rebound as expected after the price reached the support zone and is currently stopping near the neckline resistance zone. If the breakout is successful, then we have a chance to go to the resistance zone marked on the chart.
➡️From a structural perspective, we have not yet built a long structure above the hourly level, so if there is a good callback, it will be regarded as a good opportunity to participate. 🔥
Let's see 👀
⚠️Don’t forget risk management⚠️
✔️Trade Security✔️
🤜If you like my analysis, please like 💖 and share 💬
💕 Follow me so you don't miss out on any signals and analyze 💯
BINANCE:ETHUSDT.P

ETH Is Getting Ready To Pump!Comparing the BTC and ETH charts after ETF approval:
Following Bitcoin ETF approval, the price initially dropped in a classic "buy the rumor, sell the news" scenario. However, after ETF trading began and inflows increased, the price pumped.
We're seeing a similar pattern with Ethereum. After the recent ETF approval, the price dipped, but a correction might already be underway. With Ethereum ETF trading expected to start on July 2nd, potential inflows could propel the price upwards.
Reagrds
Hexa

Bullish ETHETH had a strong correction down, where prices have almost reached where they were before the ETF announcement.
I believe the risk to reward for an ETH long is favorable.
ETH priceThe Ethereum (ETH) price has done its retracement and retested the 100 day EMA mark and respected the trendline of the falling wedge pattern.

Bear Case...Making this under the assumption that we're in a larger bull trap and the correction is not yet complete - I have marked 2 target areas where I think this may stop.
