$ETH Pressing Resistance – A Break Above Could Fly!CRYPTOCAP:ETH Update
Ethereum is looking strong right now.
The price is pushing against a key resistance zone near $2,725 and forming higher lows showing pressure is building for a breakout.
If it breaks above this zone clearly, ETH could rally toward $4,000 (that’s a 55% upside).
Support to watch on the downside is around $2,465 if price pulls back.
Keep an eye on ETH, this breakout could be big.
DYOR, NFA
#ETH #Ethereum
ETHUSDT trade ideas

ETH: Still optimistic and in transformationETH: Still optimistic and in transformation
Previously, ETH showed a strong bullish trend, but recent economic events have shaken things up.
On Friday, U.S. President Donald Trump announced a 50% tariff on the European Union, set to begin on June 1, 2025. This caused uncertainty in financial markets, triggering selling pressure on ETH, which dropped to $2,463—a key support level.
However, over the weekend, Trump extended the EU negotiations deadline until July 9, for talks between Washington and the 27-nation bloc to produce a deal.
If ETH holds the $2,463 support level, we could see another upward push in price.
You may find more details in the chart!
Thank you and Good Luck!
❤️PS: Please support with a like or comment if you find this analysis useful for your trading day❤️

ETH Staying Bullish – Break Above Could Target $3K+$ETH/USDT Update
ETH is moving strong, forming clear higher highs and higher lows. Right now, it’s ranging in an accumulation zone just below key resistance.
As long as it holds above the 50 EMA and recent low, the trend looks bullish. A breakout here could send it flying toward $3,000+.
Still healthy, still in play.
DYOR, NFA

Quasimodo Pattern + Validator Support = Bullish Signal for ETHToday I want to analyze Ethereum ( BINANCE:ETHUSDT ) for you, many tokens are on the Ethereum network , and the increase or decrease of Ethereum directly affects most tokens.
So please stay with me.
Ethereum is trading in a Heavy Resistance zone($2,929_$2,652) near the Resistance lines and 200_SMA(Daily) . It is worth noting that Ethereum is preparing itself for a third attack on 200_SMA(Daily).
In terms of Price Action Analysis , Ethereum could start to rise with the help of the Bullish Quasimodo Pattern and break out of 200_SMA(Daily) and Resistance lines .
In terms of Elliott Wave theory , Ethereum appears to have completed a main wave 4 near Important Support lines . The structure of the main wave 4 is a Double Three Correction(WXY) . By breaking the 200_SMA(Daily) and Resistance lines , we can confirm the end of the main wave 4 .
The ETHBTC ( BINANCE:ETHBTC ) chart conditions are bullish , so it seems like investing in Ethereum could be better than Bitcoin . At least if the market falls , Ethereum is likely to be less likely to suffer a decline .
Note : Over 150,000 Ethereum validators, representing approximately 15% of the network, signaled support for increasing the gas limit from 36 million to 60 million units. This proposed change aims to enhance network capacity, reduce transaction fees, and improve scalability. While this development could positively impact ETH's price by making the network more efficient, it's essential to monitor potential technical risks and ensure that decentralization is maintained.
Note: If Ethereum touches $2,547 , we can expect further declines.
Please respect each other's ideas and express them politely if you agree or disagree.
Ethereum Analyze (ETHUSDT), 1-hour time frame.
Be sure to follow the updated ideas.
Do not forget to put a Stop loss for your positions (For every position you want to open).
Please follow your strategy and updates; this is just my Idea, and I will gladly see your ideas in this post.
Please do not forget the ✅' like '✅ button 🙏😊 & Share it with your friends; thanks, and Trade safe.

ETH - Long Anyway, Short-term and Long-term!Hello TradingView Family / Fellow Traders. This is Richard, also known as theSignalyst.
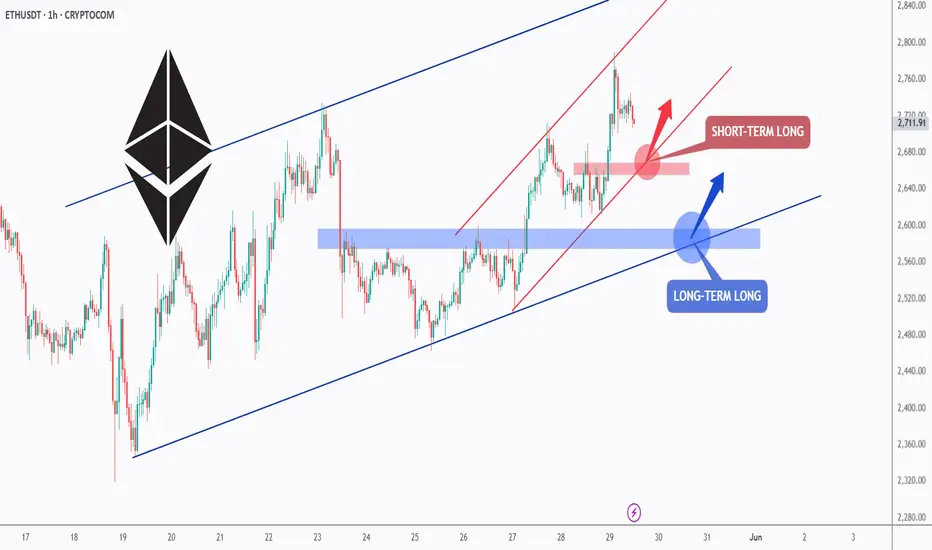
📈ETH has been overall bullish trading within the rising blue channel from a long-term perspective and within the rising red channel from a short-term perspective.
Moreover, the red and blue zones are strong support and structure!
🏹 Thus, the highlighted blue and red circles are strong areas to look for buy setups as it is the intersection of the lower zone(s) and trendline(s).
📚 As per my trading style:
As #ETH approaches one of the circles, I will be looking for bullish reversal setups (like a double bottom pattern, trendline break , and so on...)
📚 Always follow your trading plan regarding entry, risk management, and trade management.
Good luck!
All Strategies Are Good; If Managed Properly!
~Rich
ETH >>> Inverse Head & Shoulders Breakout Sets Stage for RallyHello guys!
Ethereum has formed a textbook inverse head and shoulders pattern on the 15-minute timeframe and just confirmed a breakout above the neckline. This bullish reversal formation comes after a sharp downtrend, signaling a potential shift in short-term momentum.
📌 Breakout Level: ~$2,645
🎯 Potential Target: ~$2,730–$2,750 based on the pattern height
🟦 Retest Zone: ~$2,620–$2,640
We’re currently seeing a healthy breakout followed by a possible retest of the neckline, which could offer a solid entry for continuation toward the upper boundary of the channel.
If bulls hold this structure, ETH could accelerate higher in the coming sessions.

ETH's situation+ Target PredictionCurrently, ETH is forming an ascending triangle and cup and handle, indicating a potential price increase. It is anticipated that the price could rise, aligning with the projected price movement (AB=CD).
Continued strength could lead to upward movement toward targets at $2700, $2900, and $3.100
However, it is crucial to wait for the triangle to break before taking any action.
Give me some energy !!
✨We spend hours finding potential opportunities and writing useful ideas, we would be happy if you support us.
Best regards CobraVanguard.💚
_ _ _ _ __ _ _ _ _ _ _ _ _ _ _ _ _ _ _ _ _ _ _ _ _ _ _ _ _ _ _ _
✅Thank you, and for more ideas, hit ❤️Like❤️ and 🌟Follow🌟!
⚠️Things can change...
The markets are always changing and even with all these signals, the market changes tend to be strong and fast!!

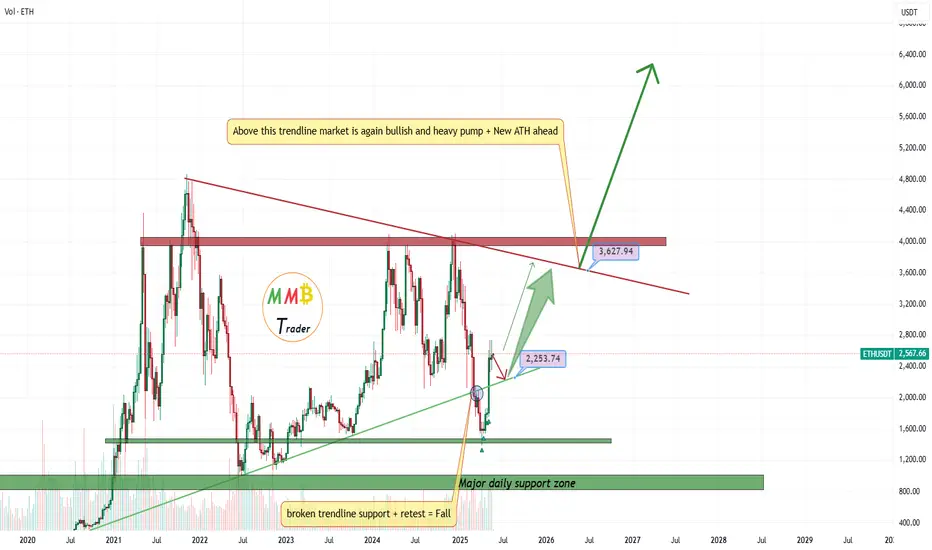
ETH Continues Bullish Momentum Above Broken TrendlineHello guys!
Ethereum has shown a strong bullish rally, breaking through a long-standing descending trendline with significant momentum. Currently, price action is consolidating above the broken trendline, which may now act as a support zone.
🔹 Scenario 1 (Bullish Continuation): If ETH holds above the current range and confirms the broken trendline as support, we could see a continuation toward higher resistance levels around $3,500 and beyond.
🔹 Scenario 2 (Deeper Retest): Alternatively, a pullback toward the $2,200–$2,300 area (highlighted zone) could offer a better accumulation point before the next bullish leg resumes.
This setup suggests that as long as ETH remains above the key support levels, the bullish structure remains intact.

Ethereum Breaks Above MA200, Long-Term Bullish Cycle ConfirmedThe 5-May week marked not only a major advance and recovery above the August/September 2024 low prices, but it also signals a recovery for Ethereum above MA200 long-term, weekly timeframe.
This simple signal confirms that the bulls are in. But there is more.
After breaking above this level, Ethereum closed two additional weeks green above it, both times wicking lower but recovering. So this level has been conquered, retested and continues to hold. This means that we have at least 6 months of bullish action confirmed based on the chart, technical analysis.
There are also some great signals based on the long-term.
» RSI: The weekly RSI has a strong reading (bullish) and produced a major higher low compared to June 2022. This signal matches what happened at the end of the previous bearish cycle.
» MACD: The weekly MACD also produced a long-term higher low compared to July 2022 coupled with a bullish cross. This indicator is trending full-upwards and leaves no room for doubt. Ethereum is set to grow long-term. Let me show you the MACD...
What would you do if you knew, with a high level of certainty, that Ethereum will trade at $7,000 or higher this same year? How would you take action? How best to profit from this knowledge/information?
Namaste.

Ethereum is Approaching a Key Support!Hey Traders, in today's trading session we are monitoring ETH/USDT for a buying opportunity around 2,650 zone, Ethereum is trading in an uptrend and currently is in a correction phase in which it is approaching the trend at 2,650 support and resistance area.
Trade safe, Joe.

Ethereum Is Nearing an Important SupportHey Traders, in today's trading session we are monitoring ETH/USDT for a buying opportunity around 2,435 zone, Ethereum is trading in an uptrend and currently is in a correction phase in which it is approaching the trend at 2,435 support and resistance area.
Trade safe, Joe.

ETH NEW UPDATE (12H)This analysis is an update of the analysis you see in the "Related publications" section
This analysis is still valid.
Ethereum has a liquidity pool above the chart, and just behind that pool, there is a fresh order block.
After sweeping the liquidity pool and hitting this order block, the price is expected to drop toward the flip zone.
For risk management, please don't forget stop loss and capital management
When we reach the first target, save some profit and then change the stop to entry
Comment if you have any questions
Thank You

ETHUSDT still sleep but soon will break the NewsETHUSDT this time will touch new ATH with Bitcoin pump not like previous time sleep price is still weak but first resistance is broken and soon will pump above 3000$ and the journey will start there and huge pump will lead ASAP.
DISCLAIMER: ((trade based on your own decision))
<<press like👍 if you enjoy💚
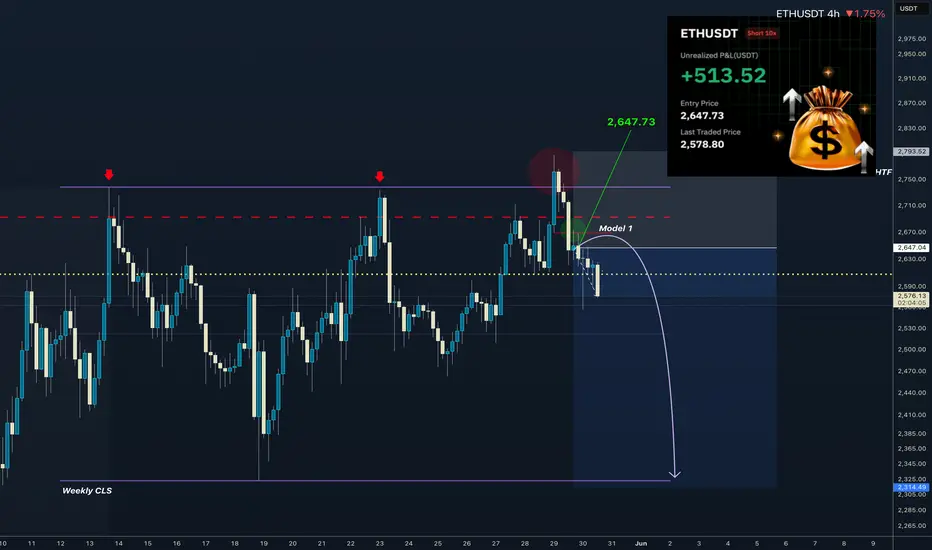
ETHUSD I Weekly CLS I Model 1 I Target CLS LowHey, Market Warriors, here is another outlook on this ETH , Im already in at 2647.73, lets go !!
If you’ve been following me, you already know every setup you see is built around a CLS Footprint, a Key Level, Liquidity and a specific execution model.
If you haven't followed me yet, start now.
My trading system is completely mechanical — designed to remove emotions, opinions, and impulsive decisions. No messy diagonal lines. No random drawings. Just clarity, structure, and execution.
🧩 What is CLS?
CLS is real smart money — the combined power of major investment banks and central banks moving over 6.5 trillion dollars a day. Understanding their operations is key to markets.
✅ Understanding the behavior of CLS allows you to position yourself with the giants during the market manipulations — leading to buying lows and selling highs - cleaner entries, clearer exits, and consistent profits.
📍 Model 1
is right after the manipulation of the CLS candle when CIOD occurs, and we are targeting 50% of the CLS range. H4 CLS ranges supported by HTF go straight to the opposing range.
"Adapt what is useful, reject what is useless, and add what is specifically your own."
— David Perk aka Dave FX Hunter ⚔️
👍 Hit like if you find this analysis helpful, and don't hesitate to comment with your opinions, charts or any questions.
Lingrid | ETHUSDT potential Bullish Breakout ExtensionThe price perfectly fulfilled my last idea . BINANCE:ETHUSDT is pulling back from its recent high after tagging the blue trendline near 2735. Price is now approaching the 2588–2590 support confluence where the range low and the ascending channel intersect. A bounce from this zone would maintain the bullish structure and may trigger a new leg toward 2735 and higher. Trend continuation remains favored above the support trendline.
📈 Key Levels
Buy zone: 2588 – 2590
Buy trigger: bullish bounce with strong volume
Target: 2735
Sell trigger: break and close below 2580
💡 Risks
Break below 2588 could shift bias short
Resistance around 2735 may cause another rejection
Short-term volatility may increase before a clear breakout
Traders, if you liked this idea or if you have your own opinion about it, write in the comments. I will be glad 👩💻

Good moment to try to Sell ETHGood moment to try to Sell ETHUSDT. We are in the flat channel and now around local up level of this channel. I think we should move to down and touch the low level and maybe create a local small down trend channel. Will see...

Ethereum Coiling Beneath Resistance — $4,000 Breakout?Ethereum’s price action is tightening beneath a key resistance level. With higher lows forming and market structure remaining bullish, ETH looks poised for a breakout that could send it toward $4,000.
Ethereum is currently trading in a consolidation phase just under a major resistance level at $2,700. This sideways price action may seem indecisive on the surface, but technically it’s forming a bullish continuation pattern. The structure shows consecutive higher lows compressing into a triangle beneath resistance—commonly seen before explosive moves.
This type of consolidation under resistance is typically interpreted as strength. Rather than breaking down or losing momentum, Ethereum is holding its ground and slowly building pressure. Each dip is being bought up sooner than the last, reflecting growing bullish interest and a reluctance among sellers to push price lower. From a market structure standpoint, ETH is still putting in higher highs and higher lows, indicating that the uptrend remains intact.
Key Technical Points
$2,700 Key Resistance: ETH is coiling just beneath this critical horizontal level, which has acted as a cap in recent weeks.
Ascending Triangle Formation: A bullish pattern marked by higher lows pushing price into overhead resistance, signaling potential breakout momentum.
Strong Market Structure: Higher highs and higher lows remain intact, supporting the current bullish bias.
If Ethereum breaks above $2,700 with a convincing bullish candle and volume influx, it could trigger an aggressive move upward. The next major level to watch is the $4,000 psychological mark, which stands as a natural magnet and round-number resistance. The impulsiveness of the breakout will be key—clean, high-volume price action above $2,700 could accelerate Ethereum into price discovery mode for 2025 highs.
Until that breakout occurs, ETH is still in a holding pattern. However, the bullish consolidation, pattern structure, and absence of lower lows suggest that any downside risk remains limited as long as ETH trades above its short-term trendline.
As long as Ethereum holds above its ascending trendline and continues printing higher lows, the bias remains bullish. A breakout above $2,700 could trigger a fast move toward $4,000. Traders should monitor volume closely and prepare for a possible expansion phase if resistance is breached.

Ethereum Danger Zone —Protection, Correction or Continuation?Ethereum can be seen trading below EMA55 on the 4H timeframe. The biggest volume session happened 9-May and it was red. This tells us that there is correction potential after a very strong 101.1% bullish growth wave.
There are mainly three levels to consider for the correction potential after ~100% growth. 0.382, 0.618 & 0.786 Fib. retracement levels. After the test of these levels, whichever one comes last, we can read the chart again and see if Ethereum will continue lower or produce a bullish wave.
One thing is very certain though, after strong growth, there is always a correction/retrace. This is what you are seeing now in this chart. The start of the drop. Taking action is best.
The market moves in waves and will never stop this pattern, it fluctuates. To trade, one buy lows near support; sells high when resistance hit. 100% growth is very strong for the second biggest Cryptocurrency project, the #1 Altcoin.
After a strong bullish wave there is always a correction. After the correction there can be more correction but at some point the market turns. Each chart/pair needs to be considered individually on multiple timeframes to have a better understanding as to what will happen next.
In a single day, based on the news, market conditions can always change. Stay alert!
Namaste.

ETHUSDTEth on weekly chart.
i saw more selling coming than buying, though we are expecting alt coin to go bulish, but if eth failed to go bulish we shldnt exxpect any other coin to be bulish as well. the altcoin season is likely to happen may coming year

ETH | New ATH on the cards | Fibonacci $7K TARGET Ethereum is gearing up towards the upside and we're seeing another resistance zone being crushed.
While BTC is trading sideways, we can expect ETH to play catch-up:
Don't miss yesterday's update on DOT:
_____________________________

See if it can find support near 2521.05 and go up
Hello, traders.
If you "Follow" me, you can always get the latest information quickly.
Have a nice day today.
-------------------------------------
(ETHUSDT 1D chart)
The two charts above are charts that use the HA-MS indicator to mark support and resistance points on the 1M, 1W, and 1D charts.
The chart below is just a chart with the HA-MS indicator hidden.
If you look closely at the drawn support and resistance points, you can see that the points drawn with the HA-Low and HA-High indicators are important support and resistance points.
The HA-Low indicator is marked in orange (#ff9800), and the HA-High indicator is marked in blue (#0000ff).
It is impossible to explain all the thoughts of a chart analyst in writing.
That is why it is necessary to provide objective information to the readers.
Then, it will be very helpful for you to look at the chart.
If you think that my idea has too many indicators, you can disable the indicators by clicking "Grab this chart" in the idea article.
If you look at the chart with the indicators disabled, you may think that something looks better, but since you don't know why these support and resistance points were drawn, you may not be able to properly utilize the support and resistance points drawn on the chart when actually trading.
Even the support and resistance points you drew yourself often become unreliable due to the movement of the chart over time, and you will be even less reliable when it comes to support and resistance points drawn by others.
In order to reduce this phenomenon, objective information is necessary.
For that objective information, I use the HA-MS indicator.
For the trend perspective, there is the M-Signal indicator, and for the trading perspective, there are the HA-Low and HA-High indicators.
To understand the detailed movement, we use the DOM(60), DOM(-60), StochRSI 50, StochRSI 80, and StochRSI 20 indicators.
Therefore, you can basically interpret the chart by activating only the HA-Low, HA-High, and M-Signal indicators.
-
Therefore, if we interpret the chart, if it rises from the current price position, the resistance zone is around 3265.0-3321.30, and if it falls, the support zone is around 1647.06-1861.57.
You can see that the HA-High indicator is newly created at the current price position, and the M-Signal indicator on the 1M, 1W, and 1D charts is passing, so we can see that it is at an important turning point.
Therefore, the key question is whether the price can be maintained above 2609.74 or whether it will fall below 2359.35.
However, since the HA-High indicator is newly created, it is more likely to fall.
Since the OBV indicator showed that the OBV fell below the High Line, we need to check whether it can touch the OBV EMA again and rise above the High Line.
If the StochRSI indicator falls below 50, we need to focus on finding a time to buy, and if it rises above 50, we need to focus on finding a time to sell.
Since the OBV is currently on an upward trend, if this trend continues, the price is expected to eventually rise.
-
Thank you for reading to the end.
I hope you have a successful transaction.
--------------------------------------------------
- This is an explanation of the big picture.
(3-year bull market, 1-year bear market pattern)
I will explain more details when the bear market starts.
------------------------------------------------------

ETH Holding Long-Term Support – Road to $4K Open?CRYPTOCAP:ETH has successfully bounced from a long-term rising trendline that has acted as strong support since 2020. This trendline has historically triggered major bullish moves, and it’s doing its job once again.
Notably, ETH has also reclaimed the mid support/resistance level, which had previously acted as a key flip zone in past market cycles.
With both the trendline and horizontal support holding, the structure looks bullish. If momentum continues, ETH could head toward the upper resistance line, potentially targeting $4,000+ in the coming months.
The trend remains intact — this bounce could mark the start of a major leg up.

Ethereum (ETH): Gameplan Remains Same | We BullishEthereum is still above the 200EMA line, where we see some decent amount of buyside volume. We are looking for the $3000 area as our target, which we think will be reached within days so currently we keep this game plan as long as we are above the EMAs.
Swallow Academy
