ETH - 5500 USD in the short-term (Banks and states buying!)ETH is pumping, and altcoins with it. That means we are in an alt season, which I predicted in the previous post here on July 9, before the pump:
ETH is part of the USA crypto reserve, and banks also love this altcoin. The ETH ETF was launched, and the big players already count this coin as the future of the crypto industry. So if you are a Bitcoin maximalist, you have to convince the rulers of this world to stop buying ETH.
But we are here to make money; we don't care about the crypto technology, which is too restricting anyways. Worse than paper money or fiat or gold. Let's be honest, if there were no charts and no trading on cryptocurrency, no one would even talk about it, and the government would silently integrate this technology.
So I am very bullish on ETH in the short term, because the price is inside this ascending channel and is breaking out with strong bullish momentum. Of course you don't want to buy the top and sell the low. We are somewhere in the middle, so if you buy now, sell at 5500 USDT. This is where the market will most likely stop for a long time before going higher.
We are in an alt season because BTC.D is going down! That means some altcoins can 10x or 50x in the next weeks. This is very important - Write a comment with your altcoin + hit the like button, and I will make an analysis for you in response. Trading is not hard if you have a good coach! This is not a trade setup, as there is no stop-loss or profit target. I share my trades privately. Thank you, and I wish you successful trades!
ETHUSDT trade ideas

#ETHUSDT: Price is going as expected in previous ideas on eth!!ETHUSDT is performing well as expected in our previous analysis, as the price has reached the $4000 area. There are two potential areas where the price could reverse. The first is a small correction, which could cause a sharp price reversal without a significant price correction. The second area is a void price, which may be filled before any further strong bullish movement.
Please use strict risk management while trading.
Team Setupsfx_
Flat, Quiet… and Full of Clues .Most traders only see the middle.
The acceleration. The “trend”. The movement.
But that’s just one-third of the story.
If you really want to understand the market’s rhythm,
you need to study how moves begin, evolve, and die.
Let’s break down the 3 key phases every market goes through —
again, and again, and again.
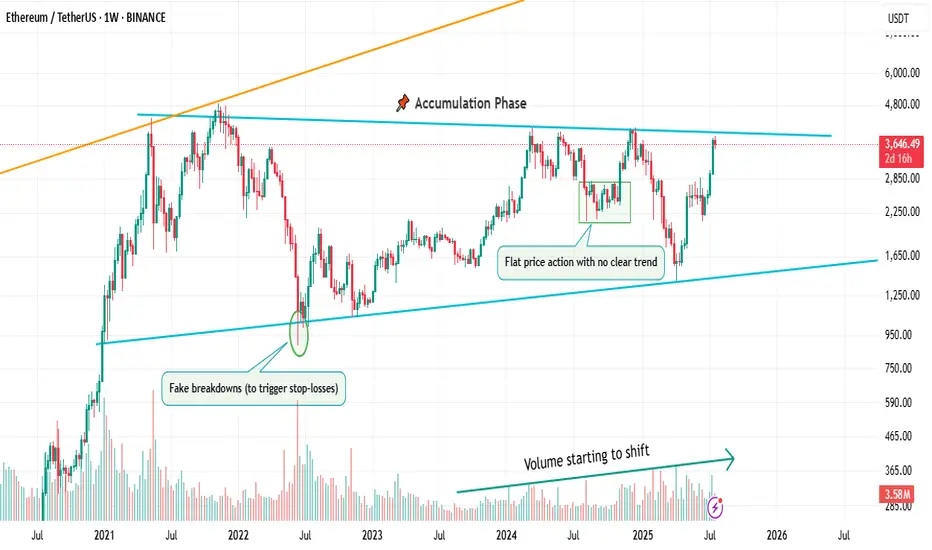
📌 1. Accumulation Phase
This is the part no one talks about.
Why? Because it’s boring. Choppy. Range-bound. Confusing.
Most traders get shaken out here.
But smart money? They’re quietly buying.
You’ll often see:
Flat price action with no clear trend
Fake breakdowns (to trigger stop-losses)
Volume starting to shift
Long wicks — both directions
This phase is a test of patience, not prediction.
And if you learn to read it well, you’ll start catching moves before they go parabolic.
🚀 2. Markup / Acceleration Phase
Here’s where everyone wakes up.
Momentum kicks in.
News gets bullish.
Breakouts start working.
Pullbacks are shallow.
And suddenly, everyone’s calling it a bull market.
But don’t be fooled.
This is not where smart money enters — this is where they ride the wave they already created.
Learn to:
Ride trends, not chase them
Add on pullbacks
Avoid FOMO entries
This is the fastest and most emotional part of the cycle — which means it rewards discipline, not excitement.
🧯 3. Distribution Phase
The party’s still on… but the hosts are quietly leaving.
Price starts to stall.
Breakouts stop working.
Volume gets heavy at the top.
And the same excitement that brought everyone in?
It’s now being used to sell into.
Distribution is sneaky.
It’s not an obvious top.
It’s a process — just like accumulation.
You’ll often see:
Lower highs forming quietly
False breakouts to trap buyers
Increasing volatility
Bullish news… with no follow-through
If you’re not paying attention, you’ll keep buying strength —
right before the rug gets pulled.
So what’s the lesson here?
Markets don’t just “go up or down.”
They prepare, move, then exhaust.
And if you learn to spot these transitions —
you’ll stop reacting late
and start positioning early.
That’s the real edge.
currently we are on the accumulation phase so in this idea I tried to show you the real story behind it and as well talk about the two others to beware of them also in the right moment I will talk about them , but for now let's focous on the current phase because we want to be part of the smart money and enjoy the next phase which is 🚀Markup / Acceleration Phase .
—
🧠 Save this post.
🔁 Revisit it when you’re confused.
📊 Because the chart isn’t random — it’s just cycling
And also remember our golden rule :
🐺 Discipline is rarely enjoyable , but almost always profitable. 🐺
🐺 KIU_COIN 🐺
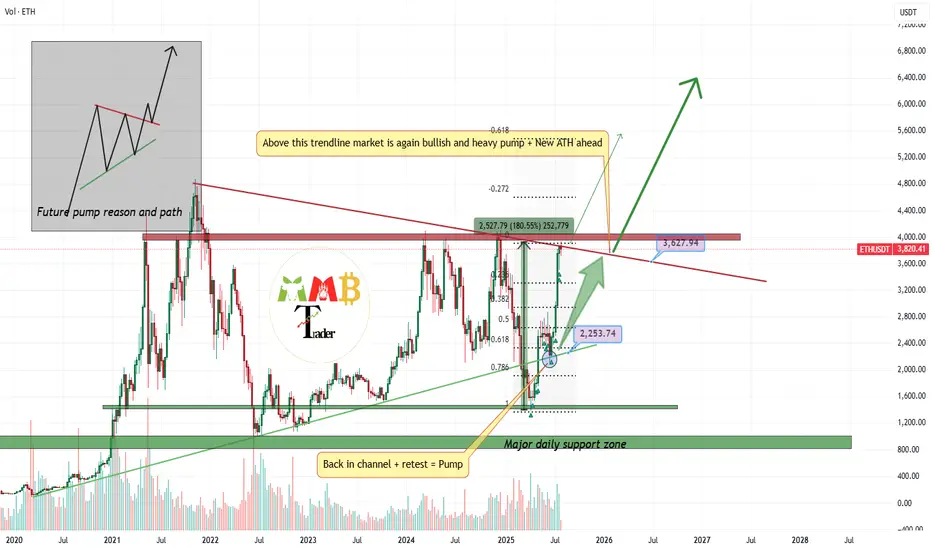
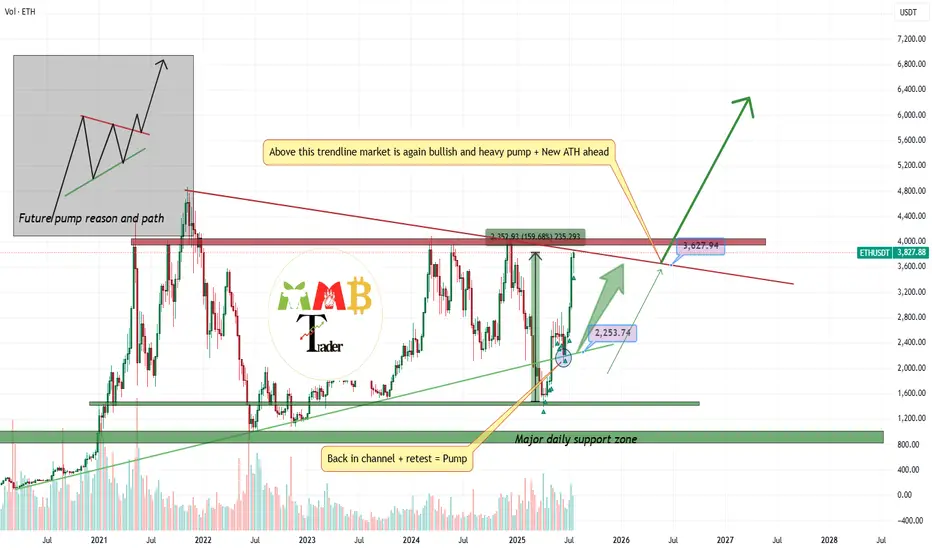
4000$ is last resistance left Ready for breakout and pump?market is still bullish and i am looking for breakout here to the upside for sure But we should consider this factor that major resistance now is touching and we may have first short-term fall.
so for now we may have correction and dump to the targets like 3300$ which is first support of 0.23 Fibonacci level.
and after this healthy correction or without it we can expect more pump and breakout of 4K$ and heavy pump to the targets like 7K$.
DISCLAIMER: ((trade based on your own decision))
<<press like👍 if you enjoy💚
Ethereum at a Critical Crossroad: Will $4,000 Finally Break ?Ethereum is once again approaching the psychologically significant $4,000 resistance level, a high-timeframe barrier that has rejected price on multiple occasions. As the second-largest cryptocurrency by market cap pushes higher, traders are closely watching for signs of a breakout—or another range-bound rejection.
Ethereum has entered a decisive phase, with price action now testing the upper boundary of a long-standing trading range. After multiple failed attempts to breach the $4,000 mark, ETH is consolidating just below this level, creating an environment filled with both opportunity and risk. Whether Ethereum can break through or gets rejected again will shape its mid- to long-term outlook.
Key Technical Points:
- Major Resistance at $4,000: A psychologically important level and long-time price cap on high timeframes
- Defined Trading Range: ETH has remained range-bound between $1,300 and $4,000 for an extended period
- Critical Candle Closes Needed: Breakout requires strong daily or weekly closes above $4,000 to confirm
Ethereum’s price is hovering just under the $4,000 resistance zone, which has acted as a ceiling for price action since early 2022. From a high time frame perspective, ETH has been range-bound, trading between $1,300 as the range low and $4,000 as the range high. Each visit to this upper boundary has led to a rejection and a subsequent rotation back toward mid-range or lower levels.
Now, with momentum building and bullish sentiment returning across the crypto market, Ethereum finds itself at another pivotal moment. The key technical requirement for a confirmed breakout will be a decisive daily or weekly close above the $4,000 level. Without this confirmation, any temporary push above the resistance could result in a fakeout and trap late long entries.
Volume behavior around this zone remains mixed. While there is some bullish buildup in recent sessions, there has not yet been a significant influx in volume to confirm conviction from buyers. This aligns with the historical pattern of Ethereum trading at resistance before eventually pulling back, suggesting caution is still warranted.
However, should ETH close decisively above $4,000 and turn this level into support, it would mark the first major break of this range since its inception. This would likely trigger a wave of bullish momentum, possibly sending Ethereum to new yearly highs, with $4,500–$5,000 being the next logical resistance zones based on historical price pivots and Fibonacci extensions.
What to Expect in the Coming Price Action
Ethereum’s price action is currently neutral-bullish but hinges entirely on its interaction with the $4,000 resistance. A confirmed breakout could usher in a powerful rally toward new highs, while another rejection would likely continue the long-standing range between $1,300 and $4,000. Until a decisive move occurs, traders should remain cautious and reactive rather than overly anticipatory.

Ethereum: Multiple Time Frame AnalysisEthereum: Multiple Time Frame Analysis
From the chart, we can see that Ethereum is in a clear uptrend on all timeframes.
The daily chart is bullish and is not yet showing signs of a reversal on the May timeframe.
Yesterday, ETH also confirmed an ascending triangle pattern on a lower timeframe, indicating potential upside as shown in the chart.
Key target areas: 3960; 4100 and 4250
You may find more details in the chart!
Thank you and Good Luck!
PS: Please support with a like or comment if you find this analysis useful for your trading day

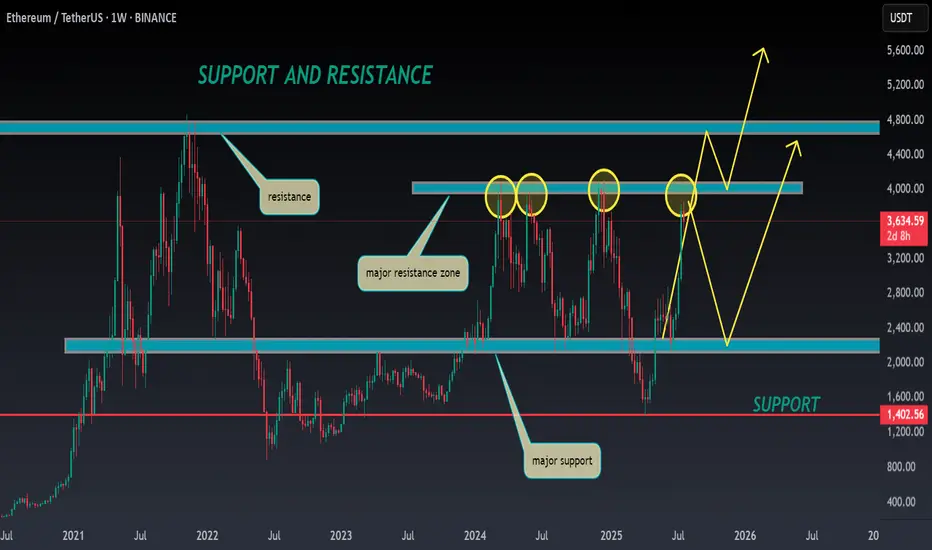
ETH ANALYSIS🔮 #ETH Analysis 🚀🚀
💲💲 #ETH is trading between support and resistance area. There is a potential rejection again from its resistance zone and pullback from support zone. If #ETH breaks the major resistance zone then we would see a bullish move
💸Current Price -- $3634
⁉️ What to do?
- We have marked crucial levels in the chart . We can trade according to the chart and make some profits. 🚀💸
#ETH #Cryptocurrency #DYOR
Ethereum (ETH): $4000 Incoming | Breakout or Rejection?Ethereum is not showing any remorse to sellers of the coin, and we are almost near the major resistance zone of $4000.
What we are looking for or expecting from here is either to get the proper breakout from this region or a rejection. As of now it is hard to say which one we will get so once we reach that resistance, we are going to look at further market structure development for any more signs.
Swallow Academy

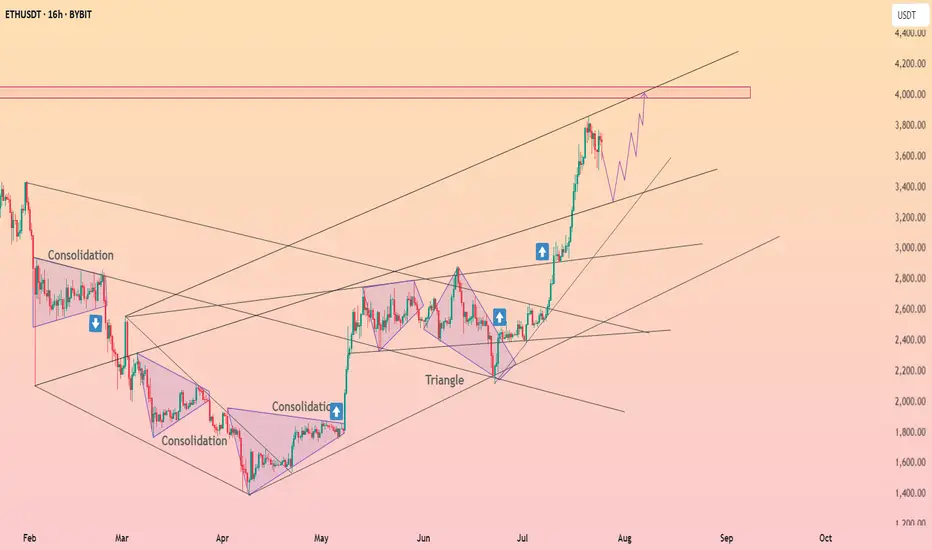
ETHUSDT market is ready to explode and PumpAs we mentioned before Price is now near weekly resistance and range and even short-term fall here is expected but this time i am looking for breakout to the upside and huge pump after that like the green arrows on chart.
So get ready and wait for that breakout and next phase of bull run to start soon.
DISCLAIMER: ((trade based on your own decision))
<<press like👍 if you enjoy💚
Ethereum will retest the $3,500 level ┆ HolderStatOKX:ETHUSDT is trending upward with $3,100 as the next resistance. Breakout aims for $3,250. $2,875 remains critical support. Bullish momentum intact.
Ethereum Charts Aligning for a Major BreakoutI analyzed Ethereum on both the monthly and 2-week timeframes, and the structure looks strong.
On the right side, we have the monthly chart, where ETH has printed a bullish Morning Star pattern right off the key support trendline.
This is a classic reversal signal, and price is now approaching the upper resistance zone. A breakout from here could trigger a major rally, similar to what we saw in 2020.
On the left side, the 2-week chart shows CRYPTOCAP:ETH pressing into a critical resistance zone after a strong bounce. If price breaks and holds above this zone, it could open the doors to $6K–$8K targets in the coming months.
ETH is showing strength, now we wait for confirmation from the breakout.
Thanks for reading!

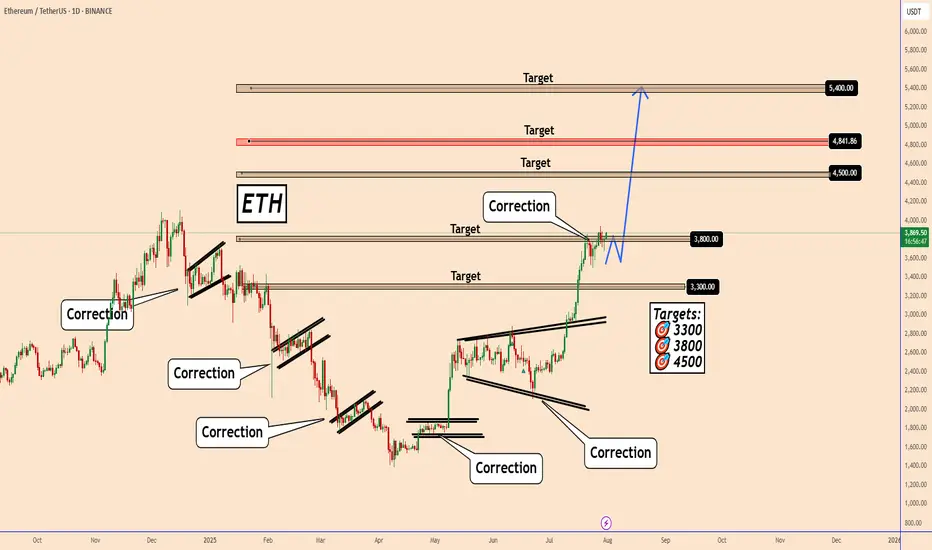
Ethereum: Bullish Momentum Recharging for the Next Leg UpEthereum: Bullish Momentum Recharging for the Next Leg Up
Daily Perspective on ETH Ethereum remains in a clear bullish trend on the daily chart. The long and consistent green waves reflect strong upward momentum over the past several days and weeks.
Looking left on the chart, ETH previously made several corrective moves during bearish phases. The current correction looks similar to those on the left side of the chart, but this time it is taking place within an uptrend.
The price is currently in a consolidation phase, likely preparing for another push higher. I’m watching three key upside targets: 4500, 4840, and 5400.
You may find more details in the chart!
Thank you and Good Luck!
PS: Please support with a like or comment if you find this analysis useful for your trading day
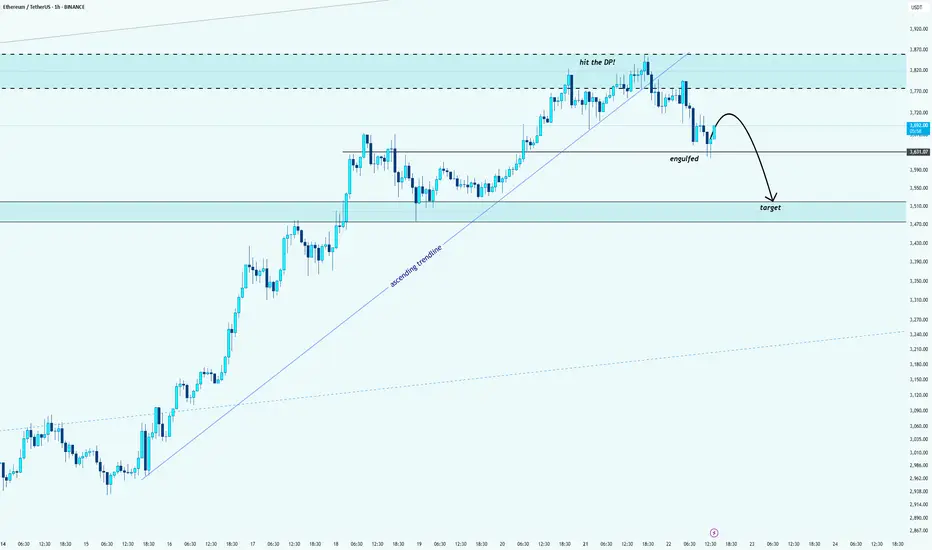
ETH/USDT: Bearish Reversal After Hitting the Decision PointHello guys!
After a strong rally, ETH finally hit the Decision Point (DP) zone marked above. Like what I said:
And we’ve already seen signs of rejection from that level.
🔹 The ascending trendline is broken
🔹 A key support got engulfed
🔹 Price is now forming a bearish structure
The target zone is mapped out around $3,500 – $3,470, where previous demand sits.
We might see a small pullback before continuation, but overall momentum is shifting downward.
Wait for confirmations and protect your capital
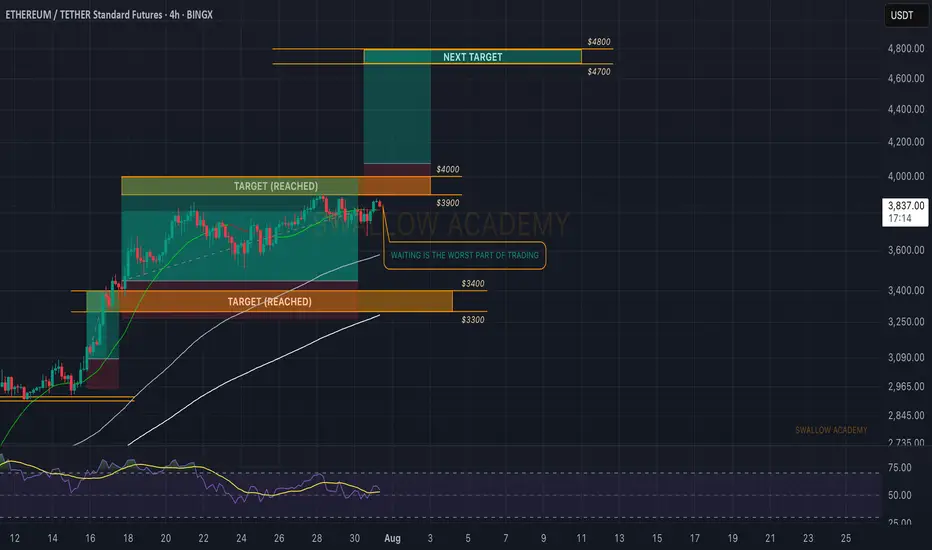
Ethereum (ETH): Waiting Is The Worst Part Of Trading | $4800ETH still looks good; we hit the target lately and now we are looking for the breakout to happen, which will give us another opportunity for a long position towards the $4800 zone.
Swallow Academy
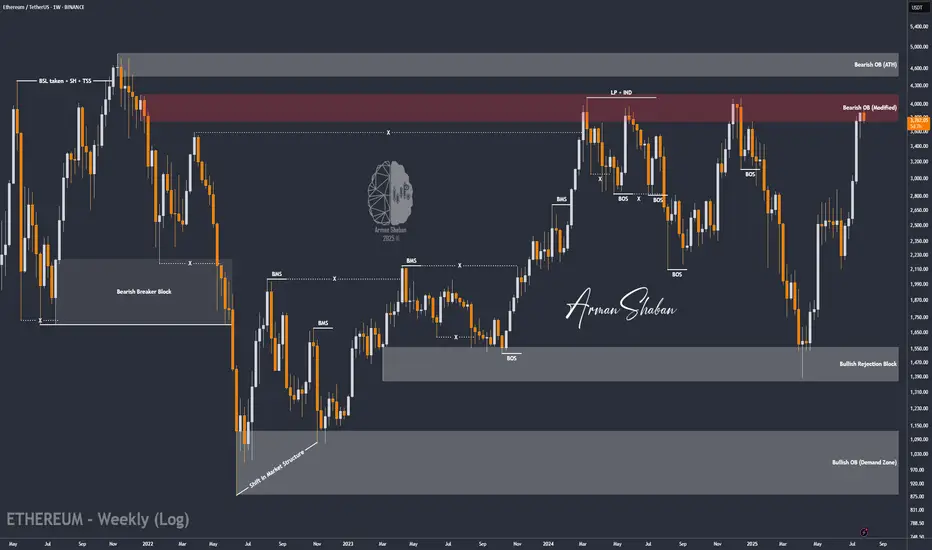
ETH/USDT | at a Crossroads – Hold Above $3440 or Sharp Fall!By analyzing the Ethereum chart on the weekly timeframe, we can see that after reaching $3940 and touching the key supply zone, ETH entered a slight correction and is currently trading around $3756. The key question now is whether it can hold above $3440 by the end of the week and push past $4000. If it does, we can expect another bullish leg toward $4100 and $4470. However, if the $3440 support fails, a sharp decline may follow — so this level is critical.
Please support me with your likes and comments to motivate me to share more analysis with you and share your opinion about the possible trend of this chart with me !
Best Regards , Arman Shaban
Ethereum Above $4,000 Bullish Signal RevealsNo major drops and low volatility is a major bullish signal. Ether is bullish now with all sellers gone. Look at the down wave from December 2024 and see what three days red would do to Ethereum's price. Today we are on the third red day and ETH is hardly a few dollars below the most recent peak. A signal of strength. This strength also means that we are likely to see a continuation of the bullish move soon, Ether will continue growing.
Good morning my fellow Cryptocurrency trader, I hope you are having a wonderful day.
Everything seems calm now, a small pause... Sell at resistance, buy at support; right?
Well, not always. It depends on the context.
Here we have a rising trend and Ethereum has been advancing nicely. Now we reach resistance, is this the time to go SHORT? It is possible to SHORT at resistance and do good but here we have a very clear uptrend. When ETHUSDT peaked 28-July there wasn't much selling. This is telling us that the bullish move is not over, not complete.
Ethereum will produce additional growth. Seeing this, it would be unwise to sell SHORT. If prices drop, it is better to wait for support and go LONG. Trade with the trend, it reduces risk and increases your chances for success.
Namaste.

ETH NEXT MOVE AND BUY ZONE.1. Market Structure:
ETH/USDT broke previous structure highs (marked with X), confirming a bullish trend shift.
Price made a strong impulsive move upward after that break, forming higher highs and higher lows, indicating smart money accumulation.
2. Price Action & Current Retracement:
After forming a recent peak near $3,950, ETH entered into a retracement.
The retracement is currently holding above key liquidity and demand zones, showing signs of healthy correction rather than reversal.
3. Liquidity Grab – Sell-Side Liquidity (SSL):
There is Sell-Side Liquidity (SSL) resting below $3,700, which has not yet been taken out.
Smart money often targets such liquidity before initiating a new leg up — this makes SSL a potential magnet for price.
4. Fair Value Gap (FVG) + Demand Zone (POI):
Just below the SSL lies a confluence zone:
A clear Fair Value Gap (FVG) between approximately $3,680–$3,700, showing inefficiency in price.
A Demand Zone (POI) below that, between $3,640–$3,680, representing the origin of the bullish move that broke structure.
This zone provides high-probability support and a potential area of smart money re-entry.
5. Trade Setup Expectation:
Scenario: Price is likely to:
Sweep SSL below $3,700.
Tap into the FVG + Demand Zone.
Show bullish confirmation (like a bullish engulfing, Choch/BOS on lower timeframe).
Entry: After confirmation inside demand zone.
Stop Loss: Below demand zone (~$3,620).
Take Profit 1: Retest recent high at $3,950.
Take Profit 2: Extension toward $4,050–$4,100 based on higher timeframe targets.
✅
Summary:
ETH/USDT is in a bullish structure but currently pulling back. A sweep of sell-side liquidity (SSL) and a tap into the FVG + Demand Zone around $3,640–$3,700 is expected. After confirmation, it offers a high-probability long setup, aligning with smart money accumulation logic.

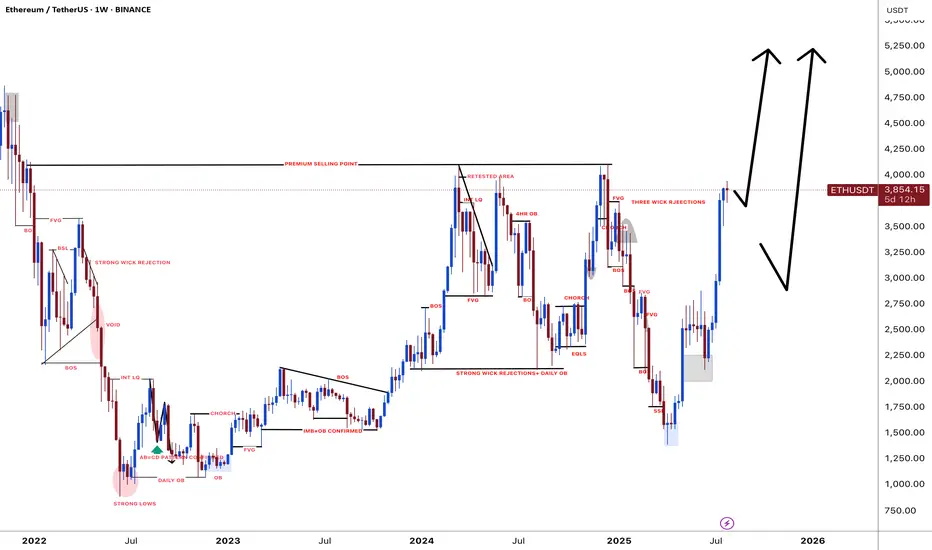
ETH (5 year of accumulation!)ETH / USDT
📌 Background: i shared an analysis about ETH/BTC chart and i predicted the ultimate bottom, from which ETH/BTC pumped 52% and ETH/USDT pumped 97% in few days !
you can check previous analysis: click here
📌 Today we have different chart against stable coin … Ethereum is being accumulated since 5 years in mega accumulation range with 2 major stop-loss hunt (long and short)
📌 What IF ?
What if ETH made a breakout throughout this accumulation ? i think we can see scenario like that in the green candles in my chart
DO YOU AGREE ?

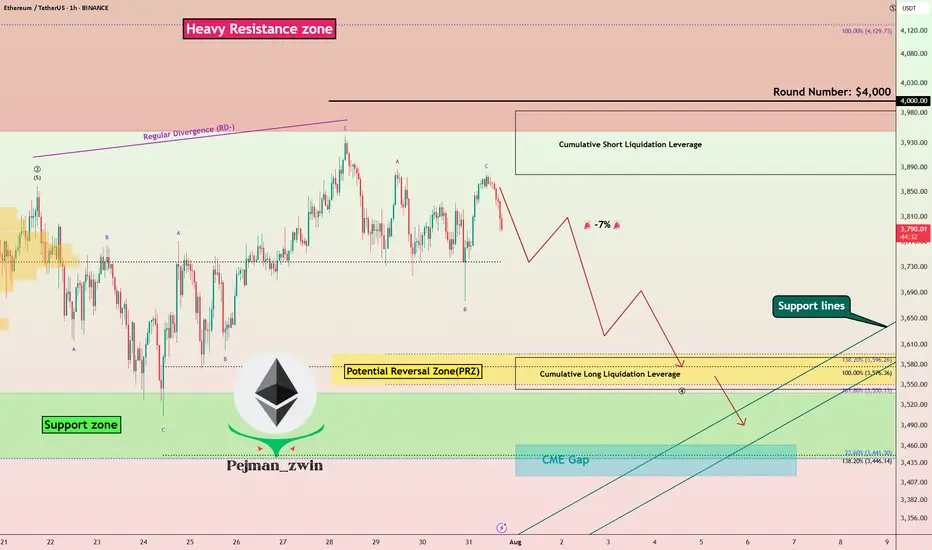
ETH at Critical Resistance + Liquidation Zone | Time to Short?Today I want to analyze Ethereum ( BINANCE:ETHUSDT ) on the 1-hour time frame . Is there a short position opportunity?
Please stay with me.
Ethereum is currently trading near a Heavy Resistance zone($4,390-$3,950) , Cumulative Short Liquidation Leverage($3,983-$3,878) and the $4,000 ( round number ). $4,000 could be a psychological number to sell .
In terms of Elliott Wave theory , Ethereum appears to have completed the main wave 3 at $3,860 and is currently completing the main wave 4 . The main wave 4 could have a Double Three Correction(WXY) or Expanding Flat(ABC/3-3-5) , with the Expanding Flat structure being more likely .
One of the reasons why shorting Ethereum could be better than shorting Bitcoin right now is that ETHBTC ( BINANCE:ETHBTC ) is currently trading above the ascending channel and is likely to correct to Fibonacci levels .
Also, we can see the Regular Divergence(RD-) between Consecutive Peaks.
I expect Ethereum to drop to at least the Potential Reversal Zone(PRZ) and attack the Support lines ( Second target ) .
Cumulative Long Liquidation Leverage: $3,591-$3,543
CME Gap: $3,461-$3,417
Note: Stop Loss: $4,023
Please respect each other's ideas and express them politely if you agree or disagree.
Ethereum Analyze (ETHUSDT), 1-hour time frame.
Be sure to follow the updated ideas.
Do not forget to put a Stop loss for your positions (For every position you want to open).
Please follow your strategy and updates; this is just my Idea, and I will gladly see your ideas in this post.
Please do not forget the ✅' like '✅ button 🙏😊 & Share it with your friends; thanks, and Trade safe.
ETH Analysis (1W)Here I am, presenting the asset I personally dislike the most — ETH.
But the chart doesn’t care about feelings. ETH looks ultra bullish, but only if it breaks above the $4,125 level.
Why this level?
The $3,800–$4,100 range has historically acted as a major distribution zone — a place where market participants have consistently taken profit for years.
If this resistance is finally broken, we could see ETH rally toward $6,900 as a minimum target.
This level is based on the breakout projection of the long-standing macro structure.
Honestly, the target looks even better than the asset itself :)
Good Luck.

$ETH - Taking Lead Over $BTC (again)Ethereum is strong as ever here. Despite Bitcoin dumped due to the FUD of Galaxy Digital selling CRYPTOCAP:BTC worth of $3.5B, Ethereum managed not stay above the support and even umped!
It is currently forming a Descending Channel (bullish pattern) above the $3520 support level. Local setup. Once this channel is broken upwards, we can expect the price to move towards the ascending resistance that was set a week ago, target is $4100 - $4200 .
You can either enter a trade here or wait for the breakout of the descending channel, the second option is safer.

Ethereum 6.5K Realistic taget for this cycle... HoldingFresh Ethereum Target — ETH going to break ATH and it can pump hard. However I dont think we go to 15K. It would be 1.8 Trillion Market cap. I stick to my plan which is 3.5 St. deviations. Measured by manipulaiton
🎯My system is 100% mechanical. No emotions. No trend lines. No subjective guessing. Working all timeframes. Just precision, structure, and sniper entries.
🧠 What’s CLS?
It’s the real smart money. The invisible hand behind $7T/day — banks, algos, central players.
📍Model 1:
HTF bias based on the daily and weekly candles closes,
Wait for CLS candle to be created and manipulated. Switch to correct LTF and spot CIOD. Enter and target 50% of the CLS candle.
For high probability include Dealing Ranges, Weekly Profiles and CLS Timing.
Analysis done on the Tradenation Charts
Disclosure: I am part of Trade Nation's Influencer program and receive a monthly fee for using their TradingView charts in my analysis.
Trading is like a sport. If you consistently practice you can learn it.
“Adapt what is useful. Reject whats useless and add whats is specifically yours.”
David Perk aka Dave FX Hunter
💬 Comment any Coin I ll give you my quick view

Ethereum Analysis – July 30, 2025📊 Ethereum Analysis – July 30, 2025
Ethereum is currently testing a key descending trendline (blue line).
If the price breaks above this resistance and confirms with strong candlestick closures, there's a high probability that ETH will rally toward the ascending red trendline, acting as the next dynamic resistance.
🚀 A confirmed breakout could trigger a bullish continuation, opening the door for higher targets in the short term.
However, failure to hold above this level may result in a pullback or range-bound movement.
📌 Keep both the blue and red trendlines on your chart — they’re currently the most critical zones to watch for potential entries or exits.
