HolderStat┆ETHUSD retest of the resistance lineBINANCE:ETHUSDT has exited a falling wedge and is forming a bullish continuation pattern. With price action building above $2,500, a breakout toward $2,800 is in play, targeting the supply zone around $3,000. Structure favors bulls.
ETHUSDT trade ideas

ETHEREUM BREAKOUT CONFIRMED!Hey Traders!
If you’re finding value in this analysis, smash that 👍 and hit Follow for high-accuracy trade setups that actually deliver!
After months of consolidation inside this massive symmetrical triangle, ETH finally breaks out on the daily chart—and this could be the spark for the next major rally! 🔥
📈 Structure: Symmetrical Triangle
✅ Breakout Confirmed
📍 CMP: ~$2,760
🎯 Next Major Target: $5,000+
This is the breakout bulls have been waiting for! If momentum sustains, ETH could enter price discovery territory soon. Buckle up—the real move might just be beginning. 🚀
Let’s see how far it runs from here!
Drop your targets in the comments 👇

ETH Price Forecast: Keep Bullish Above 2519ETH Price Forecast: Keep Bullish Above 2519
Finally, ETH is holding strong above 2520. Over the previous days, ETH lost momentum and was about to invalidate the pattern, as it reached 2475.
However, the uncertain situation from geopolitical tension and tariffs is still supporting the bulls on the crypto market.
On the other hand, ETH still has room for growth and as long as the price respects this flag pattern, the chances of ETH rising further remain high despite the developments in BTC.
You may find more details in the chart!
Thank you and Good Luck!
PS: Please support with a like or comment if you find this analysis useful for your trading day

ETHUSDTThis is very easy...
best support level 2300 to 2500 for jump price. but was needed for jump price for get enrgy for movement to high levels by fake breakout.
First level of resistance 2800 to 3000.
⚠️Control Money Management in your capital.

Ethereum Analysis – Vitalik’s Gas Cap Proposal Adds PressureToday, I want to show you the possible moves for Ethereum ( BINANCE:ETHUSDT ) this week.
Please stay with me .
Let’s first take a look at the important news that has come for Ethereum in the last 24 hours :
Ethereum’s Gas Cap Proposal Sparks Concerns
Ethereum co-founder Vitalik Buterin recently proposed EIP-7983 , introducing a gas limit cap to prevent potential DoS (Denial of Service) attacks on the network.
Bearish Takeaways:
This proposal reveals a current vulnerability in Ethereum’s infrastructure. If gas limits grow unchecked, nodes may fail to sync, leading to possible network instability.
Imposing a gas cap could temporarily reduce transaction throughput, affecting DeFi protocols and NFT platforms that rely on Ethereum’s scalability.
The market tends to react cautiously to core protocol changes, and this uncertainty could trigger short-term selling pressure.
Bullish Counterpoints:
The cap aims to strengthen the network’s long-term stability against spam and DoS attacks.
It’s still in the proposal stage, with no immediate impact on users or network performance.
Conclusion:
While the long-term impact may be positive, the short-term uncertainty and exposed risks provide a bearish narrative for Ethereum, especially amid growing competition from alternative chains.
--------------------------------------
Now let's take a look at the Ethereum chart on the 4-hour time frame .
Ethereum is currently trading near the Heavy Resistance zone($2,929-$2,652) and Resistance lines , and is also trying to break the Support line .
In terms of the Elliott Wave theory , it seems that Ethereum has completed the Zigzag Correction(ABC/5-3-5) , so we can expect the next bearish wave .
I expect Ethereum to fall to at least $2,433 AFTER breaking the Support line, and if the Support zone($2,491-$2,323) is broken, we should expect further declines.
Second Target: $2,374
Note: Stop Loss (SL) = $2,689= Worst Stop Loss(SL)
Please respect each other's ideas and express them politely if you agree or disagree.
Ethereum Analyze (ETHUSDT), 4-hour time frame.
Be sure to follow the updated ideas.
Do not forget to put a Stop loss for your positions (For every position you want to open).
Please follow your strategy and updates; this is just my Idea, and I will gladly see your ideas in this post.
Please do not forget the ✅' like '✅ button 🙏😊 & Share it with your friends; thanks, and Trade safe.

Ethereum (ETH): $2800 Reached | Targeting $3200-$3300 NowEthereum did a really good bounce from the local support area, where buyers still keep the momentum as of now.
As our target got reached, we also noticed that buyers are not reducing the pressure to the resistance zone, which means most probably we are about to break out from that smaller sideways channel.
If we see a break from here, our target is set to $3200-$3300.
Swallow Academy

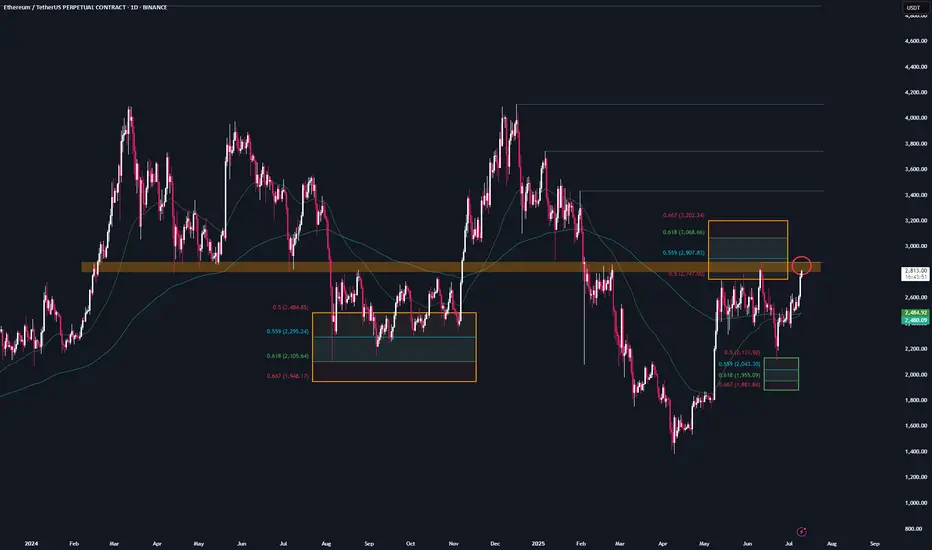
ETH is at a crucial areaETH is currenty retesing its key support & resitasnce area over the last 2 years, every breakthroiugh let to an major rally
Once we can close above it expect bullish moomentum to contiue to new ATH reagions
#ETH Update #2 – July 10, 2025🟢 #ETH Update #2 – July 10, 2025
Ethereum has formed a new high above its previous impulsive leg. Although this peak is lower than the one a month ago, the current structure looks healthy. During this move, ETH left an imbalance around the 2373 level, which aligns closely with a potential retracement zone. Volume appears to be decreasing or reaching exhaustion, suggesting the rally may be losing strength. A correction towards 2685 could be on the table. For now, the setup does not favor either a long or short position.

DeGRAM | ETHUSD rebound from the support line📊 Technical Analysis
● Bounce off the purple up-trend and 2 320 support printed a bullish engulfing, maintaining the sequence of higher-lows that has guided price since April.
● Price is squeezing into an ascending triangle under 2 700-2 730, where the former wedge cap meets horizontal supply; a break projects to the 3 040 macro fib / channel roof.
💡 Fundamental Analysis
● Net-staking deposits keep rising while, per FXStreet (25 Jun), whales add ETH ahead of the SEC’s spot-ETF S-1 verdict, underpinning demand.
✨ Summary
Long >2 320; triangle breakout above 2 730 targets 3 040. Thesis void on a 16 h close below 2 200.
-------------------
Share your opinion in the comments and support the idea with like. Thanks for your support!

Ethereum Wave Analysis – 9 July 2025- Ethereum broke the resistance area
- Likely to rise to resistance level 2885.00
Ethereum cryptocurrency recently broke the resistance area located between the resistance level 2645.00 (which stopped wave 1 at the start of July) and the resistance trendline of the weekly Triangle from January.
The breakout of this resistance area accelerated the active short-term impulse wave 3 of the intermediate impulse wave (3) from June.
Given the strongly bullish sentiment seen across the crypto markets today, Ethereum cryptocurrency can be expected to rise to the next resistance level 2885.00 (top of wave (1) from June).

ETH | Bullish Pattern - Cup and Handle +15%A Bullish pattern is appearing on the Ethereum chart.
From a Cup and Handle pattern, we can easily expect atleast a 15% increase. This is true for the near term. A +15% would put us here:
Just under $3K we may see heavy resistance. This is also the neckline resistance, as it was the previous support for the breakout that ultimately led to a new ETH ATH.
_______________________________
BYBIT:ETHUSDT

Short oppurtunity for ETHShort Opportunity on Ethereum (ETH)
Ethereum has recently failed to reclaim key resistance near \$2,800 and is showing signs of renewed bearish momentum. A brief pullback toward \$2,705 is likely before any meaningful bounce back to retest \$2,800. This setup offers a shorting opportunity with defined risk and reward.
Technical Rationale
Resistance at \$2,800 : Price has been unable to close convincingly above this level on multiple attempts, indicating strong overhead supply.
Bearish Momentum : Recent lower highs on the 4-hour chart and a break of the short-term uptrend line suggest sellers are in control.
Support Target at \$2,705 : The next logical area where buyers may step in confluence of the 50-period moving average (4h) and prior swing low from late June.
Outlook
If ETH reaches \$2,705 and shows bullish signs (hammer or bullish divergence on RSI), expect a retest of the \$2,800 area. Conversely, a decisive break below \$2,705 could open the path to \$2,650 and lower. Adjust your plan accordingly based on how price behaves around these key levels.
Disclaimer : Always conduct your own due diligence and size positions according to your risk tolerance. Markets can be unpredictable, use proper risk management.

ETH Gearing Up for Lift-Off — Eyes on $4,000+ETH Weekly Outlook
ETH is currently trading around $2,660 on the weekly timeframe and holding up well at these levels.
If the momentum continues, the upper resistance zone near $3,550 could act like a magnet — pulling price higher. A breakout above this zone may trigger a strong rally toward $4,000+.
And when ETH starts to move big… altcoins usually follow.
Keep an eye on it. The next few weeks could get interesting.
DYOR, NFA

Weekly trading plan for EthereumLast week's price action followed our bullish scenario perfectly. Currently trading above the weekly pivot point, we've already hit target 1. Now anticipating target 2 - either directly or after a local pullback. However, if we lose the pivot with no buyer recovery, expect downside momentum toward support. Also explained the $2,112 target rationale in the video analysis
Which scenario do you think will play out? 👀

ETH Short IdeaRising trend broken. You can see MSB easily
Volume going down during price rising.
I am waiting correction to 1860

Ethereum (ETH): Will Say It Again $2800 Is Scripted!Ethereum buyers are dominating currently, with the price climbing closer and closer to our major target of $2800.
What to pay attention to are the 100 and 200 EMAs, where usually once we have shifted apart from them, we have seen some kind of correctional movement if buy-side momentum is lost so that's what we are keeping an eye on.
If we see currently further buy-side pressure, then we might reach our target within this week, but if sellers take even slight control, we most probably will retest the EMAs before another attempt to upper zones.
Swallow Academy

ETH/USDT Long term ContinueAbsolutely! Here's your Ethereum long position analysis in English based on the chart you shared:
🧠 My Position – Long at $2,590
📍 Current Price: ~$2,605
👉 That means you're currently ~$15 in profit (small gain for now).
📊 Chart-Based Technical Analysis (1D timeframe)
✅ Key Support Levels
$2,423 – Fibonacci 0.382 level
$2,450–$2,475 – Close to the 50 EMA (blue line)
These zones serve as strong support, holding the price up.
🚀 My Entry Strength
You entered at $2,590, which is:
Above EMA 20 (red) — bullish short-term signal
Right in the tight moving average cluster (20/50/200) — often a sign of an upcoming breakout
📈 Risk/Reward Ratio
Entry: $2,590
Stop-Loss: $2,575 → Risk: $115
TP1: $2,743 → Reward: $1530
R/R ratio for TP1: ~1
✔️ Overall: Very good entry with balanced risk.
🔔 Recommendations:
If ETH moves above $2,650, consider moving SL to break-even ($2,590) — protect your capital
Near $2,743, you could:
Close 50% of my position
Or use a trailing stop to lock in more profit

ETH FAST TRADE [15M]📝 My ETH Short Idea (Test Trade)
This is a test idea where I’m simply practicing my analysis and trade execution. It’s built entirely on my own personal strategy, so it’s primarily for self-development and tracking.
💡 The main setup:
I’m looking for a short position on ETH, but this idea will only be valid if all my levels and conditions align exactly.
Otherwise, I’ll skip the trade.
📌 How to enter:
I’ve detailed exactly how to enter the trade:
Wait for my specific trigger conditions to be met (price levels + confirmation by my indicators).
Enter only after the setup is fully formed — no early entries.
Manage risk properly with stop-losses beyond key invalidation levels.
Scale in only if price structure continues to validate my scenario.
⚠️ Important:
This is not financial advice. I’m using this idea mainly to test and refine my strategy. Sharing it here for transparency and to improve my analytical discipline.
✅ Plan:
If the setup completes exactly as planned, I’ll look for targets according to my strategy’s rules, trailing stops along the way.

#ETH Ascending Triangle📊#ETH Ascending Triangle 📉
🧠From a structural perspective, the bullish target near the neckline support area has been achieved, so there is an expectation of a pullback.
➡️From a graphical perspective, there is an ascending triangle superimposed inside the ascending wedge. Generally, we regard such models as bearish models. Therefore, with the support of multiple decline expectations, we should not chase the rise here! ! !
🤜If you like my analysis, please like 💖 and share 💬 BITGET:ETHUSDT.P

ETH/USDT Chart Analysis (4H)
ETH has been trading inside a symmetrical triangle (shown by converging black trendlines).
A breakout has occurred above the descending trendline, signaling bullish momentum.
The rising diagonal trendline from late June is acting as strong support.
Ichimoku Cloud:
ETH is above the cloud, indicating a bullish bias.
The cloud below the price is green and fairly thin, suggesting modest support if the price dips back.
Key Levels:
Resistance Zone: $2,650–$2,700 (upper breakout zone).
Immediate Support: $2,550 trendline area.
Major Support Zone: $2,250–$2,450 (large yellow box). This has previously served as a significant accumulation zone.
Potential Scenario:
The price may retest the broken triangle trendline around $2,550–$2,570 (as indicated by the wavy projection on your chart).
Holding above this level could fuel a rally toward $2,750–$2,850 next.
Losing $2,550 would expose ETH back toward the bigger yellow support zone.
Short-Term Outlook:
Momentum favors bulls as long as ETH stays above ~$2,550.
Watch for volume on any move above $2,650 to confirm continuation toward higher targets.
Conclusion:
ETH has broken its triangle resistance and looks poised for further upside. A successful retest near $2,550–$2,570 could launch the next leg higher toward $2,750–$2,850.
Stay tuned for updates and key levels to watch!
Thanks for your support!
DYOR. NFA

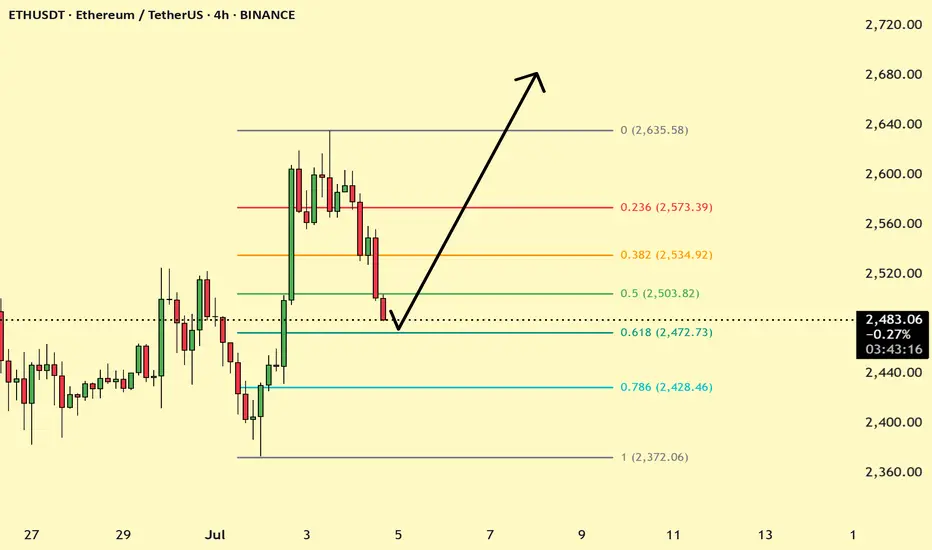
ETHUSD At 0.618 fib If holds can go 2680 ETHUSD recently in uptrend as par to correction the price has reached 0.618 Fib and price maty reverse if the bulls are Strong let us see....
ETHEREUM ROADMAPI tried to predict based on previous time periods and elliot waves.
Please note that my analysis is not short-term. Of course, there may be short-term correction waves in Ethereum.
* The purpose of my graphic drawings is purely educational.
* What i write here is not an investment advice. Please do your own research before investing in any asset.
* Never take my personal opinions as investment advice, you may lose your money.

ETH/USDT 1W Chart📊 Trend structure (Price Action)
Downtrend (historical):
A series of Lower Highs (LH) and Lower Lows (LL) — a classic downtrend.
Confirmed by the orange downtrend line.
A change in structure — a possible beginning of an uptrend:
A Higher Low (HL) has recently been formed after a Lower Low (LL).
Suggests a possible end to the downtrend and an attempt to break out upwards.
Currently:
The price is testing the upper downtrend line.
A breakout above the orange line may confirm a trend change.
🟢 Key Resistance Levels (Green Lines):
Level Meaning
3.058 USDT Potential target after a breakout from consolidation
2.767 USDT Nearest strong resistance - currently being tested
3.427 USDT Deep resistance level from the previous high (HH)
🔴 Key Support Levels (Red Lines):
Level Meaning
2.234 USDT Nearest support - previous breakout
1.883 USDT Early 2023 support
1.507 USDT Local bottom
1.204 USDT Historical support - LL extreme
📉 Stochastic RSI (Momentum Indicator):
Currently in the overbought zone.
This may suggest a short-term correction before an actual breakout.
However, in a strong uptrend, the indicator may "hang out" in the overbought zone for a long time.
📈 Potential scenario:
If the breakout above 2.767 and the orange trendline holds:
A possible move to 3.058 USDT as the first target.
Extended target: 3.427 USDT (HH).
If the breakout fails:
Correction to 2.234 USDT or lower.
There is a risk of returning to a downtrend.
✅ Bullish signals:
Higher Low (HL) formation after Lower Low (LL).
Testing the upper downtrend line with an attempt to breakout.
Volume is increasing (based on candles).
⚠️ Bearish threats:
Stochastic RSI in the overbought zone.
Breakout not confirmed by 100% (needs a weekly closing candle above 2.767).
Resistance at 3,058 could halt the move.
📌 Conclusion:
Ethereum (ETH) could be on the cusp of a new uptrend, but a breakout above 2,767 USDT is needed for confirmation. If it does, a move to 3,058 and then 3,427 is possible. However, the current overbought level on the Stochastic RSI could signal a short-term correction before the trend gains strength.
