Sunday, 6 July 2025 - ETH/USDT.P ShortTrading Journal Entry: ETH/USDT SHORT
Date of Entry: July 7, 2025
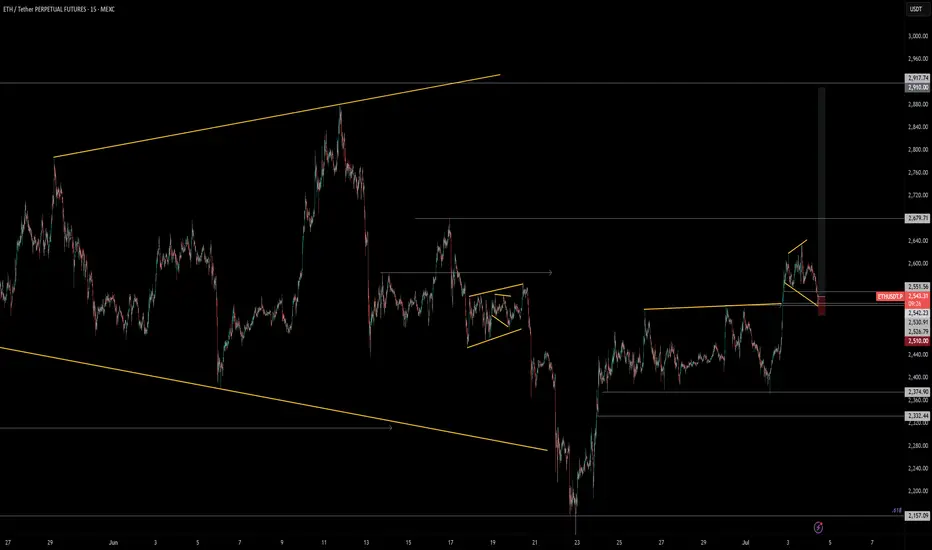
Asset: ETH/USDT Perpetual Futures
Position: SHORT
Entry Price: $2,580.00
Stop Loss: $2,615.00
Take Profit: $2,510.00
Risk/Reward Ratio: 2.00:1
Setup Grade: A+
1. Core Thesis
The trade is a high-confluence short position designed to capitalize on a probable liquidity hunt below an obvious daily support level. The core thesis is that the market is incentivized to purge over-leveraged longs, whose positions are revealed by order flow data, within the context of a clear daily downtrend.
2. High-Timeframe Context (The Strategic Landscape)
My analysis began with a top-down approach to understand the broader market environment.
Weekly Context: The market is in a large-scale consolidation range. This tells us that expecting a massive, sustained trend breakout is a lower probability. Instead, trading between major support and resistance zones is the governing dynamic.
Daily Context: The immediate trend on the daily chart is bearish. Price had established a series of lower highs and lower lows, bringing it down to a major area of historical support and the Volume Profile Point of Control (POC) around the ~$2,550 zone. This created the central conflict: a bearish trend meeting a significant support level. A naive analysis would be to buy this support.
3. Order Flow & Sentiment Analysis (The Deciding Factor)
This layer of analysis was the key to resolving the trend vs. support conflict and formed the backbone of my bearish bias.
Liquidation Analysis: The liquidation maps revealed a very large and proximate pool of long liquidations clustered between $2,470 and $2,500. This liquidity acts as a powerful magnet for price, as market makers are incentivized to push price toward these zones to absorb orders.
Funding Rate Analysis: Funding rates across almost all exchanges were consistently positive. This provided clear evidence that derivative traders were predominantly positioned long, were paying a premium to maintain those longs, and were betting on the daily support holding. This identified a crowded trade.
Synthesis: The presence of a large downside liquidity target (the "magnet") combined with a vulnerable and crowded group of participants (the "fuel") created a high-probability scenario for a contrarian move. The path of least resistance was for the market to push through the "obvious" support to liquidate these longs.
4. Tactical Execution (The Entry Trigger)
With a firm directional bias, the final step was to find a low-risk entry.
4-Hour Structure: The price action at the daily support level was weak. The 4H chart showed a low-volume, sideways consolidation, not a strong bullish rejection. This lack of a decisive bounce was my first clue that the support was fragile.
1-Hour Entry Pattern: I identified the perfect entry trigger by observing the 1H chart.
Price staged a minor rally toward the $2,580 resistance level.
Crucially, this rally occurred on visibly declining volume, signaling a lack of genuine buying interest. It was a corrective, not an impulsive, move.
My entry at $2,580 was placed at a clear support-turned-resistance flip zone, allowing us to short into weakness at a favorable price.
5. Risk Management (The Trade's Foundation)
Stop Loss ($2,615): The SL was not an arbitrary price but a logical invalidation point. It was placed just above a recent 1H structural swing high. A move above this level would have proven the "weak rally" thesis incorrect and signaled that buyers had taken control.
Take Profit ($2,510): The TP was chosen for two reasons:
Rule Compliance: It mathematically secured my required 2:1 risk/reward ratio.
Strategic Placement: It sits just ahead of the psychological $2,500 level and the densest part of the liquidation pool, increasing the probability of a fill before any potential support-driven bounce.
This trade represents a textbook example of my strategy: using high-timeframe analysis to build a directional bias, confirming it with order flow and liquidity data, and executing with precision on a low-timeframe pattern, all while adhering to strict risk management rules.
ETHUSDT trade ideas

FULL MARGIN TEST ETH✅ 2. ETHUSD (Strong bias rising)
Entry: 2565 Long on retracement
Stop Loss: 2540
Take Profit: 2600
Recommended lot size: 0.20 lot (1:100)

Classic Bear Flag formation on ETH day chartprice has been hovering in a a range for sometime before the last high made was on june 11th when ti touched 2879 and a low was made on june 22nd when it was 2115 since then price has moved up but has made a lower high of 2637 on 3rd july and now is trading around 2550 giving a classic bear flag appearance to the structure if the price breaks down below 2480 then we may see a max down move towards 1900-1800 consolidation in this range can happen and the price will start its upward trajectory as shown in the chart towards 3000-4000 range

ETHEREUM TRADE PLAN!!!Ethereum still remains bullish, especially on the daily timeframe there's a +OB/BISI supporting the price.
My focus is on the "4-Hour TF" I want to see price revisit (BISI) level as a more favorable entry point for continuation. This level aligns with a key bullish order block, which I anticipate will draw price down before resuming the uptrend.
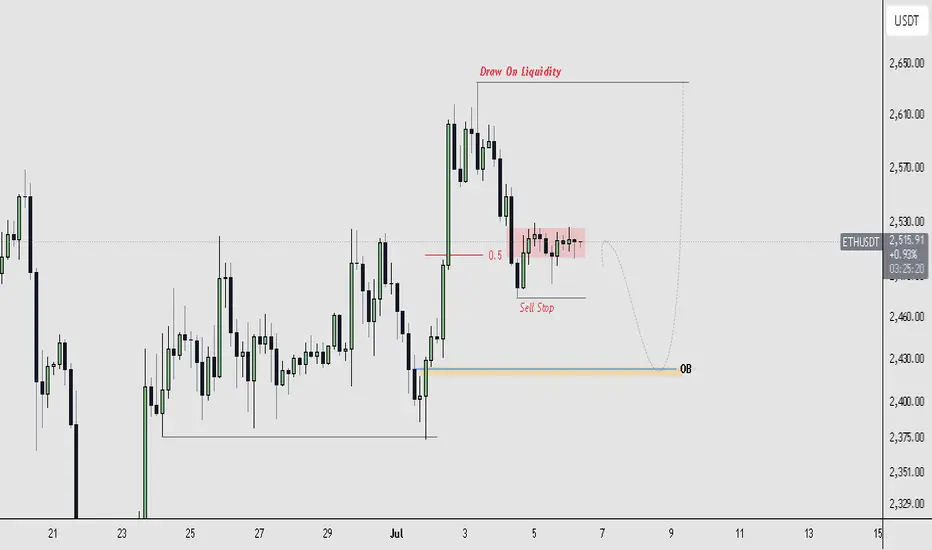
ETHUSDT - BEARISHETH/USDT Chart Overview (Short-Term Trading Idea)
- **Current Price**: ~$2,516.91
- **Volume**: 11.91K (moderate activity)
---
### 💡 **Trading Idea: Short-Term Bounce Play and then bloodbath.**
#### ✅ Setup
- Wait for ETH to retest the $2,100–$2,2000 support zone
- Look for bullish candlestick patterns (e.g. engulfing, hammer)
- Confirm with rising EMA or bullish divergence in RSI (if available)
#### 🚀 Entry
- Buy near $2,280 if price shows strength
#### 🛑 Stop Loss
- Around $2,220 (below recent support and wick levels)
### 🧠 Notes for Strategy
- Keep your position size conservative due to high intraday volatility.
- News around BTC can affect ETH—watch both charts.
- Great for scalping or a quick day trade, not ideal for long-term holds in this timeframe.
NFA
DYOR

Wait for ETH to rebound to $2528-2542 and place a short order.Short
$2528~$2542
Take Profit
$2480, $2460
Stop Loss
$2555
If the price falls below $2510, do not chase short, wait for a rebound.

Eth revealed If you want to know the simplest way to trade in ETH for the next few years.
This is how Eth is moving.
We will discuss this further in January 2027.

Why You Still Lose Money Even With Perfect AnalysisYour setup was on point, your entry was clean, your stop-loss was tight.
Everything looked perfect.
And yet, you still lost.
Maybe the real issue isn’t in your chart, maybe it’s in your head.
Hello✌
Spend 3 minutes ⏰ reading this educational material.
🎯 Analytical Insight on Ethereum:
BINANCE:ETHUSDT is currently trading inside a well-defined parallel channel 📈. It is approaching a key daily support level that coincides with an important ascending trendline. A breakout above this channel could lead to a bullish move, targeting at least a 16% gain with a primary resistance zone near $2900 🚀. Monitoring how price reacts around this area will be critical for confirming the next leg up.
Now , let's dive into the educational section,
🧠 Analysis Is Half the Game
Having a clean technical analysis doesn’t guarantee anything if your behavior ruins it.
Most traders change their minds mid-trade because of fear, hope, or noise from other sources.
Market psychology doesn’t always respect your Fibonacci retracement. You might be right and still lose because you couldn’t hold on to the plan.
🕒 Don’t Enter Before the Market Does
Timing is underrated. Many traders get in too early. Your analysis may predict a breakout, but price isn’t ready yet.
Zoom out. A solid setup on the 1-hour chart might need confirmation from the 4-hour or daily.
A great trade is not just where you enter, but when.
😤 It’s Not the Chart — It’s Your Mind
Many times, the chart setup is perfect. But when price wobbles a bit, you lose confidence.
Imagine this: a clean uptrend, higher highs forming, but a small retracement hits and you close the trade. Why? Fear. Not logic.
You lost not because of analysis, but because you couldn’t handle being right under pressure.
📊 TradingView Tools: More Than Just Indicators
If all you're using in TradingView are the typical RSI or MACD indicators, you're barely scratching the surface.
Tools like Bar Replay can simulate real-time reactions to past price action, not just for backtesting, but for testing your discipline under real psychological pressure.
Try this: pick a point where you lost money despite solid analysis. Use Bar Replay and “re-live” the chart without knowing what happens next. Was your entry early? Did you panic exit? Or did your stop-loss placement ignore structure zones?
Also, use the Long/Short Position Tool to visually plan your risk/reward, and adjust your bias if the chart structure doesn’t validate it.
For those wanting a deeper layer, add Volume Profile Fixed Range to identify value zones, where whales are active, and overlay it with your own trade setup.
TradingView isn’t just a charting platform. It’s a behavioral mirror. You don’t just look at the chart, it shows how you act when money’s on the line.
🎯 Your Stop-Loss is for the Chart, Not Your Emotions
If your stop-loss is placed based on what feels safe rather than key market structure, you’re not trading the chart. You’re managing anxiety.
Let structure dictate where your risk lies, not your nerves.
😬 Not Executing = Not Trading
If you don’t follow through with your own trade plan, your analysis is meaningless.
Did you cut early just because a big red candle scared you? Or because someone tweeted a bearish take?
That’s not discipline, that’s reactive trading. It has nothing to do with your original logic.
📉 Losses Are Part of Trading… But Not These Ones
There’s a difference between calculated losses and emotional mistakes.
The first is expected, even professional. The second will drain your account and confidence.
Take losses when the plan fails, not when your emotions freak out.
🔍 Reverse-Engineer Your Entry Logic
Next time you trade, take a screenshot and write down your full reasoning.
Why this entry? What did you see? How will you exit?
Later, go back and compare it to what actually happened.
This habit alone can fix more issues than a dozen trading books.
💡 Perfect Analysis ≠ Profitable Trading
Analysis opens the door, but execution and consistency keep you in the room.
Most traders think the problem is their indicator, but it’s usually the part of themselves that doesn’t listen to the indicator at the critical moment.
🧠 The Power of “Logged Experience”
The real difference between amateurs and veterans isn’t screen time. It’s tracked behavior.
Use TradingView’s built-in Note feature, place icons or comments on every trade setup, and keep a record of your actual thought process.
That feedback loop is gold. It builds self-awareness, the rarest edge in trading.
📺 Make It Visual to Make It Stick
Don't rely solely on indicators.
Use Chart Pattern Drawing Tools, head and shoulders, flags, triangles, and reinforce visual memory.
Also, by managing Visibility Settings, you can keep your charts clean while viewing different structures across timeframes.
The result? You start to see the story behind price, not just numbers.
🔚 Final Thought
If you're still losing money with accurate analysis, maybe it’s time to analyze your reactions instead.
TradingView gives you the tools, but the real upgrade is learning to trust your system under stress.
✨ Need a little love!
We put so much love and time into bringing you useful content & your support truly keeps us going. don’t be shy—drop a comment below. We’d love to hear from you! 💛
Big thanks , Mad Whale 🐋
📜Please remember to do your own research before making any investment decisions. Also, don’t forget to check the disclaimer at the bottom of each post for more details.

ETH Short setupETH showing some weakness, manual SL if 4hrs candle closes above the mentioned point then must close the trade don't hold and wait for the new setup.

ETHUSDT Swing Trade AnalysisEth still struggling to break weekly bearish fvg, rather it's bullish or bearish, it must revisit the orange line which is daily bearish fvg, if it taps this and drops then a good sign , if it doesn't tap this and drops then it's a bad sign for eth, 3rd scenario is if we get any 4hr closing above the green line then I will not take the short and close short on the entry price, then I will short from the 3k area till 2.8k for scalp, if eth rejects from orange line 2583 then I will hold the trade till tp2. short only from the mention zone, if it doesn't tap the bearish fvg i will share another short trade with extended tps. remember that that yellow zone is important eth must retest it or break it to be bullish, without tapping this and drops then it's not a good sign for eth.

ethererum
how to play around crypto and win the day
every crypto traders needs to know the following before taken any action.
(1) US10Y
(2)DXY
(3) GREED AND FARE INDEX
(4) BTCMARKET CAP CHART FOR CAPITAL INFLOW AND OUTFLOW.
(5) US FED INTEREST RATE DECISION.
(6) BITCOIN DIRECTIONAL BIAS AND SEASON(BULL/BEAR)
#SHAVYFXHUB #BITCOIN #BTC #CryptoTrading #Ethereum #Solana #AVAX #BNB #CryptoEducation

ETHEREUM ETHUSDT is awaiting a directional bias .but at the moment it has to break a weekly supply roof and sustain the gains as buy confirmation.

ETH BEARISH AT RESISTANCE ETH rejecting daily resistance, likely price will look to find supports at zones marked below
DYOR

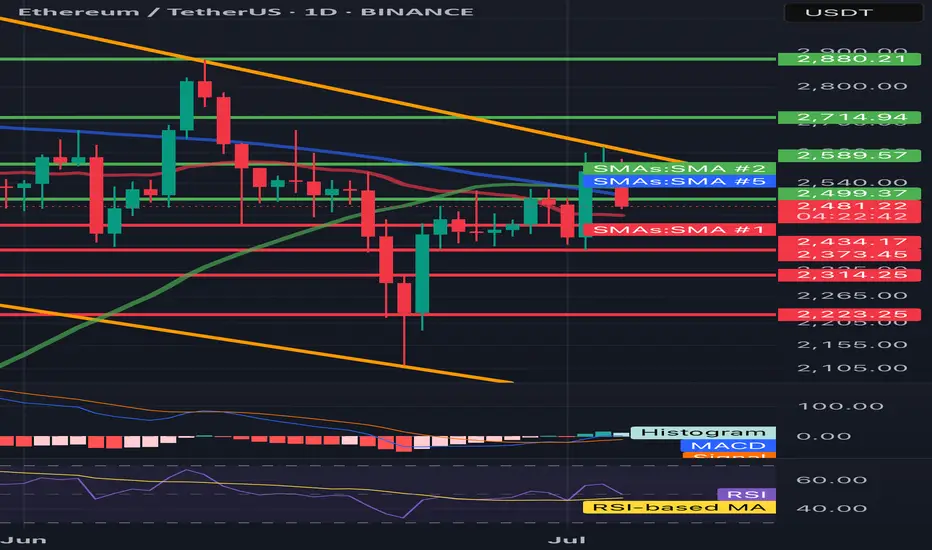
ETH/USDT 1D🔍 ETH/USDT - technical analysis (1D interval):
📉 Price: 2478 USDT (-4.36%)
🔧 Resistance:
• SMA 200 (green): ~ 2589
• Resistance zone: ~ 2715 → 2880 USDT
• SMA 100 (blue): ~ 2500 (just rejected)
🔧 Support:
• SMA 50 (red): ~ 2434 - currently tested
• Strong support: 2373, 2314, 2223 USDT
📊 indicators:
• MacD: freshly intersected, but the momentum is weakening
• RSI: ~ 45 - neutral/weak, under 50 (no bull strength)
• Trend: Still in the downward channel (yellow trend lines)
⸻
⚠️ Conclusions:
• Price rejected from 2500 (SMA 100) and flies down.
• If 2434 falls, a further discount is possible to 2373–2314.
• Lack of bulls with key resistance - the inheritance scenario dominates.
• Watch behavior at 2434 - this is now a key level.
ETH/USDT at Critical Decision Point: Breakout or Rejection AheadETH is pressing into a major confluence zone between two key trendlines. Price is currently testing both diagonal resistance and horizontal support, making this a pivotal area to watch 👀
📍 Scenario 1 – Bullish:
If ETH can break above Resistance Zone #1 and hold, there’s clear upside toward $2,900 (Resistance Zone #2). A confirmed breakout could mark the start of a new short-term uptrend.
📍 Scenario 2 – Bearish:
Failure to hold Support Zone #1 could send price back into the lower range, with $2,300 and $2,100 in play. Watch for rejection from the descending trendline and a break of the rising channel.
This post is for educational purposes only — not financial advice. Use your own judgment and proper risk management when trading.
#ETH #Ethereum #TechnicalAnalysis #TradingView #BreakoutWatch #SupportResistance #CryptoTA #QuantTradingPro

Ethereum Technical Analysis – Key Support Levels to Watch!🚨 Ethereum Technical Analysis – Key Support Levels to Watch!
After a strong rally in recent days, Ethereum (ETHUSDT) is now experiencing a healthy correction. The $2,440 zone is currently acting as a crucial support level that could determine the next move.
📉 If price breaks below this level, the next major support lies around $2,270, which could become a key area for bulls to step in again.
💡 All the important support and resistance levels are clearly highlighted on the chart. This is a must-watch zone for short-term traders!
🔔 Follow for more daily updates on Ethereum, Bitcoin, and altcoin setups!
#ETH #Ethereum #CryptoAnalysis #TradingView #TechnicalAnalysis #ETHUSDT

ETH SWING TRADEETH Showing strong momentum against BTC, July is also good for eth and some alts, maybe we see correction in Aug, September but before expected pullback towards 2.9k-3k. Must use SL as market is very Volatile these days.
HolderStat┆ETHUSD correctedKUCOIN:ETHUSDT is moving inside a rising wedge after reclaiming support near $2,500. Recent breakout from consolidation supports a continuation push toward $2,720–$2,760. The current trendline structure and bullish price action suggest upside potential.

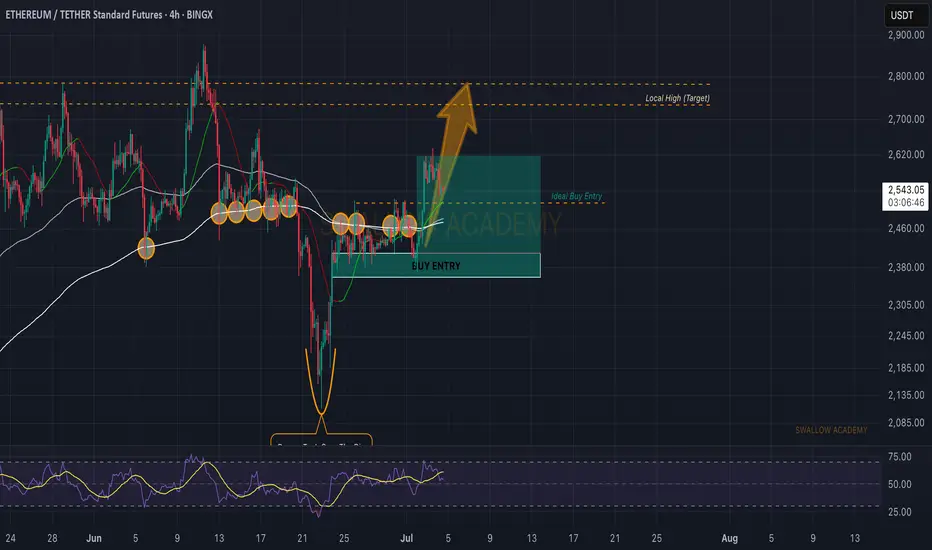
Ethereum (ETH): $2800 Is Next TargetEthereum had a good rally where buyers took control over EMAs, whereafter a successful retest, buyers are back in the game (hopefully).
We are starting to look for another long entry on the COINER at $2,600; once we see a proper BOS in this region, we will be opening a long position.
Swallow Academy
ETH Bullish Update
Ethereum is looking bullish, and is respecting clearly defined support and resistance levels.
In my primary count, we have finished black wave 1. The question is to determine if black 2 is already finished, which could lead to strong upside.
There is no way to know without further price action, and a break of green resistance is a very bullish signal.

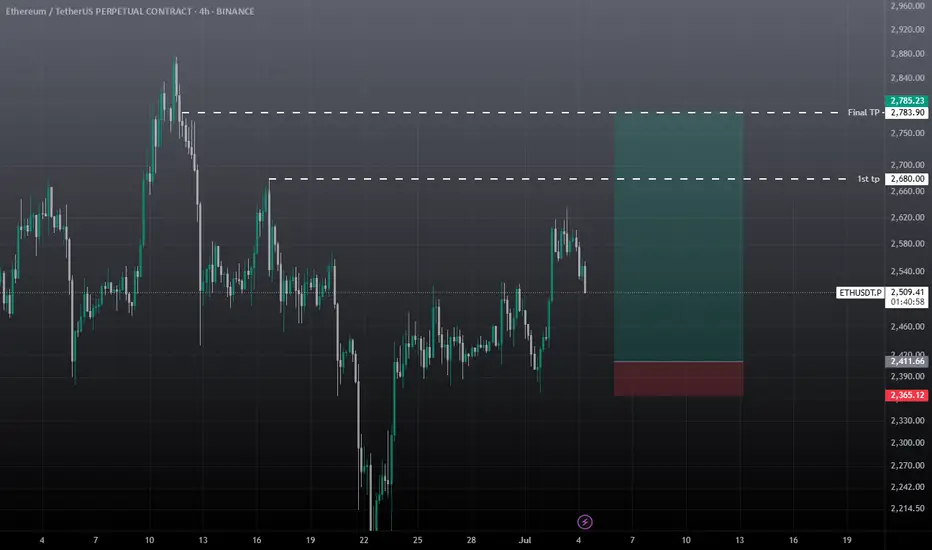
ETH SHORT SCALP ! to 2500
Executed an ETH short from the earlier setup — took 75% profit at TP1, then let the rest run.
Price pulled back into the secondary zone, added to the position with structure confirmation.
Let it roll into the next leg — clean execution, solid momentum follow-through.
+113.84% on the full move, managed with scale-out and conviction on the retest.
Patience paid. System did the work.

Momentum Reload: Next Scale-InHello traders,
First position still floating. The scale-in has been executed. The structure is clear, and the positioning, sequence, and entry are all solid. I'm comfortable taking a potential loss on this position. Stops from the previous trade have been moved to the current stop-loss level, making the overall position risk-free.
I'll release a video soon to walk you through the details.
Stay safe chads! Peace
MEXC:ETHUSDT.P
BINANCE:ETHBTC
CRYPTOCAP:TOTAL
Ethereum in JULYEthereum should close above $3000 by the end of July to stay in the bull run, Monthly candle is so important now.
