ETHUSDT WEEKLY UPDATE — PART 1
When Conviction Fails: Apex Rejection, Hidden Redistribution, and the Illusion of Demand
Good morning, good afternoon, good evening, wherever you're tapping in from. Now, as always, I’m not here to waste your time with unnecessary waffle. Let’s get straight into it and unpack this mess step-by-step.
THE APEX REJECTION | MORE THAN JUST A WICK
So picking up from last week's update, we find ourselves right at the crossroads, and not the romantic kind either. What we’re looking at right now so far, is a clean yet 100% conclusive rejection from the apex of a key macro structure.
This isn’t just any level. This is the intersection of vertical momentum and horizontal memory, the apex of a triangle that’s been forming for months. This is where bullish intent was supposed to hold, supposed to assert dominance, but instead, what did we get? A strong push into resistance, a failure to fix above it, followed by exhaustion and signs of institutional unloading.
Now, to the untrained eye, this may look like a pullback, or even a healthy correction. But we’re not here to look at charts with retail goggles. We’re here to track the true intent behind the price action, and if you know your schematics, this is screaming redistribution. And not just any redistribution, the kind that happens right before the market changes its personality.
WHERE ARE WE IN THE SCHEMATIC?
If we overlay Wyckoff logic on top of this structure, it's very clear:
We’ve had our PSY (preliminary support).
Followed by a spring, a shakeout, and a fake rally.
Now we’re dancing around what appears to be the UTAD (upthrust after distribution) — but weaker.
This isn’t classic distribution, it’s redistribution masked in macro confusion.
Here’s the thing this range isn’t just price consolidation, it’s behavioural conditioning. This long, choppy sideways movement is designed to wear out both bulls and bears, making them question their bias, mismanage their risk, and either overstay or exit too early.
The market is methodical, not random. These candles aren’t accidents, they are footprints of algorithmic trap setting, and right now, it looks like the net is about to close.
VOLUME TELLS THE TRUTH
Let’s not forget volume. Look at the weekly volume through this recent push:
Decreasing volume on the rallies,
Higher volume on the red closes,
And multiple spikes that failed to carry price past resistance.
That’s your dead giveaway. You don’t need to be a wizard, just follow the clues. Price is being pushed, not lifted. Demand isn’t stepping in, liquidity is being removed. This isn’t smart money accumulation, if confirmed by the endd of this week, this most recent move up cout be doing of smart money unloading, Quietly and Efficiently.
THE MARKDOWN IS PRIMED
Let’s now address the elephant in the room, the range low and point C of the triangle on the 4H.
T hat’s where liquidity is sitting.
That’s where the market’s next objective lies.
We’ve now failed to reclaim the apex, the wick was slapped down, and unless something significant shifts, the next logical move is to sweep that C point, take out the emotional support, and either:
Tap into true demand (if it exists), or
Begin the cascade toward the final green demand zones between 2,150–2,070, which we marked weeks ago.
And don’t forget, this sweep may not be clean. We could get a fakeout bounce mid-range — enough to bait in more longs, only to roll over again.
PSYCHOLOGICAL LAYER
What’s happening here isn’t just technical, it’s emotional warfare. This entire range has been one long gaslight for the average trader. Between the failed breakouts, failed breakdowns, and chaotic intraday behaviour, retail has been turned into liquidity.
And if you’re still trying to long blindly at the top of this, hoping for 3k ETH without a confirmed structure reclaim, then respectfully, you’re the product right now.
Coming next in Part 2:
A full breakdown of the 4H macro setup
Analysis of the internal range mechanics
Recalculated fib zones
Where the liquidity pockets are
What the most probable path is short, medium, and long-term
Stay tuned — I’ll keep the flow coherent, structured, and aggressive. No fluff. No hopium. Just structure, psychology, and execution.
ETHUSDT trade ideas

Ethereum Leveling Map — ETH/USDT 1DNo directional bias for Ethereum, but will use levels to spot entries for intraday.
Right now located at POC and seems balanced for both sides.
Potential Adam&Eve setup in development.
Quality levels for support $2150, 2000, 1800, 1500.
Resistances $2700, 3000, 3500, 4000
Keep in mind it will follow BTC price action by most of time.
Happy trading

Ethereum (ETH): Buyers Above The EMAs | Looking For $2800Buyers are back in control where they secured the lines of EMAs, which means that we are expecting the $2800 to be reached this week.
Now, despite us currently seeing some kind of weakness in markets, we think that EMAs will still be holding it's ground so as long as we are above them, we are bullish here!
Swallow Academy

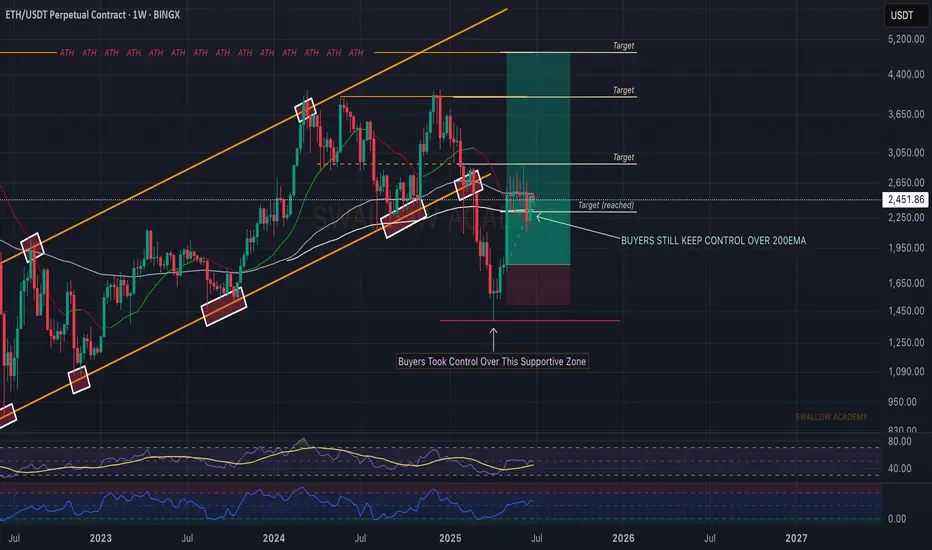
Ethereum (ETH): Buyers Took Back Control Over 200EMABuyers are back in control over the 200EMA, so nothing is lost yet. We keep our bullish game plan here. As many know, ETH is still far from its potential...considering the fact that BTC has already outperformed itself.
Time for ETH to shine now!
Swallow Academy
ETH IN NO-MAN'S LANDEthereum is caught in no-man’s land. After a sharp rally in May that pushed price cleanly above the 200-week moving average, ETH has now slipped back between the 200 MA (around $2,400) and the 50-week MA (just under $2,600). It’s a classic case of being stuck in the middle – too weak to break higher, too strong to roll over completely. This is where momentum goes to die.
Until one of those moving averages gives way, expect more chop and indecision. A breakout above the 50-week could reignite bullish momentum, but a drop below the 200-week would bring $2,141 support back into play. For now, Ethereum’s just dancing between the lines.

2/6/17 BIG SHORT ETH MEGA DUMPI expect the strongest fall in bitcoin and ether, so I take such a trade with a profit risk ratio of 1k12 as part of a classic pattern stop over the 3 top

Technical Analysis of the Financial Chart
1. Main Trend
The overall trend for the ETH/USDT chart (30-minute timeframe) appears bullish, confirmed by the recent breakout above the $2,480 resistance level and price maintaining above the moving averages (MA 50 and MA 200).
The latest upward momentum pushed the price to around $2,510, but the current candlestick seems to be consolidating at this level.
2. Key Levels
Resistance:
$2,543 (next critical level).
Support:
$2,480 (previous resistance, now acting as a key support zone).
$2,461 (aligned with the MA 50 and prior consolidation).
Breakout: A breakout above $2,480 has occurred. The bullish trend is likely to continue as long as the price remains above this level.
3. Technical Indicators
RSI (Relative Strength Index):
Currently around 63, indicating positive momentum but not yet overbought (70+), suggesting more upside potential.
MACD:
Both the MACD and Signal lines are above 0 with a recent bullish crossover. However, the lines are converging, pointing to potential consolidation.
Moving Averages (MA 50 & MA 200):
The price is trading well above both moving averages, reinforcing the bullish outlook.
4. Risk/Opportunity
Entry Point: Long above $2,505 (continuation of the bullish trend).
Stop-loss: $2,470 (below the breakout level and MA 50 to reduce risk).
Take-profit:
Level 1: $2,543 (first visible resistance).
Level 2: $2,570 (potential extension of the trend).
Confidence Level: High (given the strong breakout and supporting technical indicators).
Recommendation
Trading Setup:
Asset: ETH/USDT
Direction: Long
Entry: $2,505
Stop-loss: $2,470
Take-profit:
Level 1: $2,543
Level 2: $2,570
Confidence: High
Additional Notes:
Monitor volatility and volume: A drop in volume may signal weakening momentum.
Bollinger Bands indicate possible tightening after the breakout, suggesting consolidation.
🏦 Conclusion: The current setup supports a bullish continuation strategy with a favorable risk/reward ratio.

Ethereum – 1D timeframe overview with Initiative AnalysisHey traders and investors!
The seller has reached their target.
A buyer started buying from the 2184 level and now holds the initiative.
Targets are on the chart.
This analysis is based on the Initiative Analysis concept (IA).
Wishing you profitable trades!
ETH, hinting of a monster RISE from 2.4k to 4k... SEED NOW!ETH has been the most stubborn pair in comparison to BTC. Its price behavior is almost opposite that of BTCs with unstable volatility the last 2 years -- and thats an understatement.
But from what we know based on its historical movement -- ETH, when it gets into the zone, theres no stopping this sleeping giant to capturing new heights. And that's what we're sensing now with initial hint of BIG SHIFT transpiring this month based on its latest long term metrics.
From our diagram above. Here is what we observed.
LONG TERM MOMENTUM BEAR CLERANCE SHIFT.
FIRST ONE IN 2.5 YEARS! LAST TIME WAS JANUARY 2 2023
Lower highs momentum baselines conveying intense build up ascend pressure.
Precise 78.6 FIB LEVEL TAP. This is where most buyers converge before a BULL SEASON.
From this metric changes, something is definitely evolving. This shift doesnt happen often. It took ETH 2.5 years to repeat this signal, and we got one this month. This is special and it is BIG.
SEED NOW while you can. See you up there at 4k era soon and beyond.
Spotted at 2400
Mid/Long term Target 4k++
Trade Safely. Market is Market.
Not financial advice.
TAYOR.


Ethereum Rebounds from Strong Base – ATH in Sight?Hello traders, here’s the CRYPTOCAP:ETH Monthly Outlook
Ethereum is flashing early signs of a bullish reversal, with a clean Morning Star candlestick pattern forming right above the $1,050–$1,200 support zone, a historically strong base.
After bouncing hard from this level, ETH is now approaching the major resistance area at $3,400–$3,800, the same zone that previously rejected upward moves.
If ETH can break and close above this resistance, we could see the start of a fresh bullish leg. But until then, this zone remains a major hurdle.
Keep an eye on the monthly close, it could confirm a shift in long-term momentum.
DYOR, NFA
Thanks for following along — stay tuned for more updates!

"ETH Bullish Heist: MA Breakout Confirmed! Next Stop 3600?"🔷🔹 "THE ETH HEIST: MASTERPLAN TO LOOT 3600!" 🚨💰 (Breakout + Pullback Strategy)
🌟 Yo, Fellow Market Robbers! 🌟 (Hola! Bonjour! Salaam!)
Listen up, Money Makers & Thieves! 🏴☠️💸
Based on the 🔥Thief Trading Style🔥, we’re about to pull off the ultimate ETH/USDT heist—Ethereum vs Tether is our target!
🔪 THE TRADE SETUP (LONG HEIST)
🎯 Entry Signal:
"The heist begins at MA Breakout (2900)! Wait for confirmation, then strike like a pro thief!"
Option 1: Buy Stop above MA (2900) for breakout momentum.
Option 2: Buy Limit on pullbacks (15-30min TF) for sneaky low-risk entries.
📌 ALERT! Set a breakout alarm—don’t miss the robbery!
🛑 Stop Loss (Thief’s Escape Route):
"Yo! If you’re entering on breakout, DO NOT set SL before it triggers! Place it at the nearest swing low (12H TF)—or risk getting caught by the bears! 🐻🔪"
🎯 Profit Target: 3600 (OR Escape Early!)
Scalpers: Only long scalps allowed! Use trailing SL to lock profits.
Swing Thieves: Ride the wave but exit before the cops (bears) arrive!
⚡ WHY THIS HEIST WILL WORK:
Bullish momentum + MA Breakout = Easy Loot!
Overbought? Trap? Reversal? Nah—we escape before the danger zone! (Yellow ATR = High Risk)
📢 THIEF’S WARNING:
🚨 News Alerts = Market Chaos!
Avoid new trades during high-impact news.
Trailing SL = Your Best Friend.
💥 BOOST THIS HEIST!
👉 Hit 👍 LIKE & 🔔 FOLLOW to strengthen our robbery squad! More heists = More profits! 🚀💰
Stay tuned, thieves… Next heist coming soon! 🏴☠️🔥

ETHUSDTThe price is in the local area
If the price stabilizes above the volume range and the trend line and moving average 60
We can expect growth to the range of 2.90 and 3 and then 3.4 thousand dollars.
Don't forget risk management and always expect any movement from the market.
Ethereum Breakdown Ahead? Classic Head & Shoulders Pattern Hello Guys!
Ethereum looks like it’s setting up for a potential drop after forming a textbook Head & Shoulders pattern on the 4H chart.
This pattern (marked clearly with a left shoulder, head, and right shoulder) is often seen before a price reversal. Right now, ETH has already broken below the neckline (around $2,480), confirming the bearish pattern, and is currently retesting that level from below.
📉 What’s Next?
If the pattern plays out, we could see ETH drop toward the projected target zone around $2,200–$2,250, which is highlighted in blue on the chart. This zone also lines up with a previous area of interest and sits near a broken trendline, adding confluence to the setup.
✅ What I see:
Resistance: ~$2,500 (neckline retest)
Target: ~$2,200 support zone
Broken trendline adds downside pressure
Unless bulls reclaim the neckline quickly and push above the right shoulder (~$2,650), this looks like a bearish continuation setup.

ETHEREUM PRICEACTION TRADINGETHUSET have tested the broken demand floor and it looks like buyers are going for another .
if that level is broken ,it will be a wave of long which will hope to take profit on the supply zone .

ETH/USDT High winning scalping signals in 15 minutes are as foll- Signal: LONG
- Admission: 2,436 ~ 2,442
- Take Profit: 2,462, 2,478

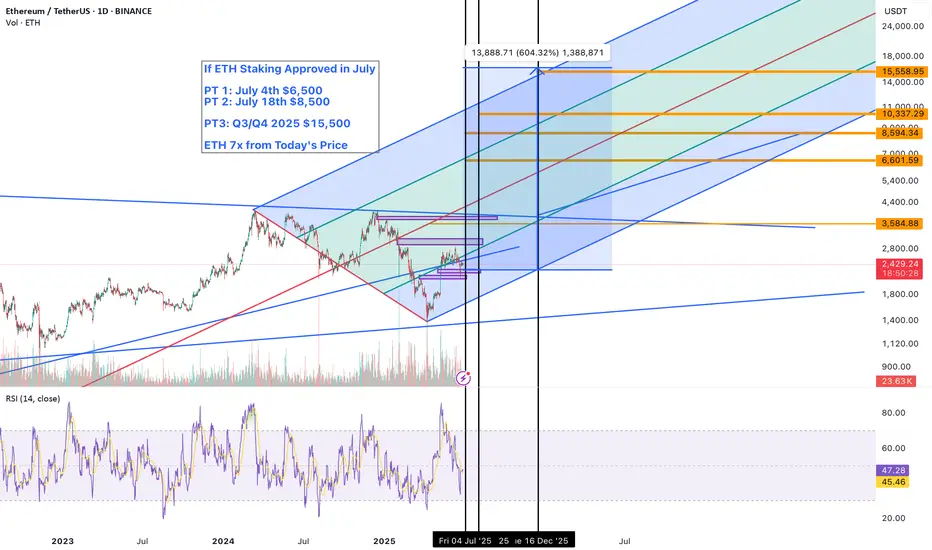
Ethereum’s $10K Breakout Is in Sight — BRock's Staking ETF July🚨 Ethereum’s $10K Breakout Is in Sight — BlackRock’s Staking ETF Could Trigger a Historic Supply Squeeze
All eyes are on the SEC’s pending decision regarding BlackRock’s Ethereum Staking ETF, and if approval lands in July 2025, it could trigger one of the most powerful supply-side shocks in Ethereum’s history.
This isn’t just about price speculation. It’s about structural demand meeting vanishing supply.
🟢 Why This ETF Is a Game-Changer
BlackRock isn’t just filing for an Ethereum ETF—it’s filing for a staking-enabled ETF. That’s a huge distinction. This means:
ETH held in the ETF will be staked, earning real yield
Staked ETH is locked and removed from circulation
Institutional capital gains exposure to yield + price upside
Ethereum becomes a yield-bearing digital commodity
It’s no longer just “digital oil.” It’s now digitized yield, and institutions are hungry for real yield in a low-rate environment.
📈 Technical Setup Is Bullish
ETH is coiling under its former ATH of ~$4,800
RSI shows no major bearish divergence
ETH/BTC ratio shows signs of breakout after long consolidation
Bitcoin dominance is peaking → altseason rotation imminent
Add a major ETF approval catalyst to this technical structure, and ETH could move explosively.
🔮 Ethereum Price Forecasts Post-Approval
Scenario Price Target Timeframe
Conservative $6,000–$7,000 2–4 weeks post-approval
Upside / Momentum $9,000–$10,000 Q3 2025
Supercycle Case $12K–$15K Q4 2025–Q1 2026
Why $10K ETH is Realistic:
Bitcoin’s ETF sparked $15B+ in inflows in <6 months
ETH has smaller market cap, so similar flows have outsized impact
Staking ETF removes ETH from float, making price reflexively bullish
TradFi gets exposure to yield + deflationary asset in one product
🔥 This Could Be Ethereum’s “GBTC Moment”
Remember how Grayscale’s GBTC product in 2020 created a reflexive premium and drove massive BTC inflows?
This is version 2.0, with yield attached. And instead of retail FOMO, we now have pension funds, RIAs, and endowments allocating via regulated ETF rails.
That’s not hype. That’s capital rotation—on-chain.
🛑 Risks to Watch
SEC delays or waters down staking component
Macro headwinds (rate volatility, geopolitical shock)
ETF approval gets front-run and sells the news
But even with these risks, the ETH supply structure is fundamentally stronger than during prior cycles. The burn is active. The float is tightening. And now TradFi wants in.
✅ Conclusion: July Could Be Ethereum’s Tipping Point
With a BlackRock staking ETF on deck, a macro environment ripe for a Fed rate cut, and Ethereum sitting under its ATH with rising momentum…
$10K ETH isn’t a moonshot—it’s the logical next leg.
If approved in July, Ethereum may never trade below $5,000 again.
🔔 Follow for updates on ETH ETF flows, ETH/BTC ratio breakouts, and altseason timing models.
📊 Comment below—what’s your Ethereum price target if the ETF is approved?
#Ethereum #ETHUSD #CryptoETF #BlackRock #Altseason #ETHAnalysis #CryptoNews #TradingView
ETHusdt soon above 3K$Two major weekly supports now are 2200$ and 2000$ and we can expect more pump and heavy rise to start from these area first target is near red trendline resistance and then after breaking that here we can expect new high and more rise.
DISCLAIMER: ((trade based on your own decision))
<<press like👍 if you enjoy💚

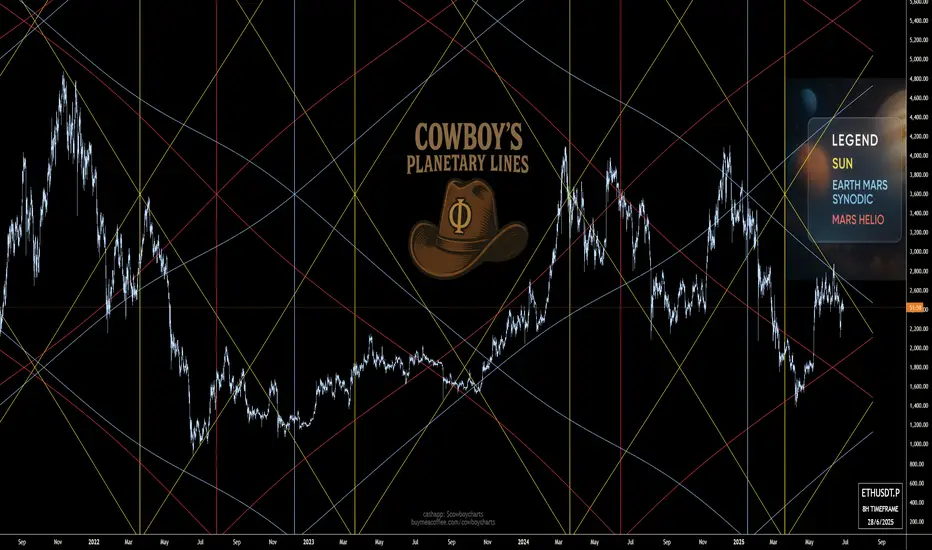
ETH - Intergalactic, Planetary, Intergalactic, PlanetarySun Lines (Gold Fences): These vertical yellow posts mark the high-noon moments when Solar power kicks off major stampedes. Note how the late-2021 Sun line lit the fuse for ETH’s first big buck, and the spring 2024 fence set the stage for that gallop up to nearly $4,800.
Earth-Mars Synodic Ropes (Blue Lassos): These sweeping blue arcs show us when Earth and Mars line up in the sky—and in price rhythm. Each blue lasso tends to corral momentum, either roping in a rally or reining in a sell-off. Early 2023’s synodic rope kept bears at bay, while the latest loop around June 2025 hints at a pick-me-up near $2,400.
Mars Heliocentric Rails (Red Corral Bars): The red lines are Mars’s own heliocentric fences—tough support and resistance levels that often drive price back toward the barn. When ETH bucked above a Mars line in mid-2022, it stalled for months; when it fell through a red rail in early 2025, it trailed off toward $1,500.
Trail Ahead: We’ve just passed another Sun post and are nearing a Mars corral bar around $2,200–2,300. If the blue synodic rope holds, expect a gentle trot back up toward $2,800; if ol’ Mars drags us off-trail, we might be bucked back toward $1,600. Keep your eyes on those planetary fences—the next cosmic roundup’s comin’ soon!
BYBIT:ETHUSDT.P
EthusdttHis asset has presented my expectation information, in which my my sell confident level is 90% for now, while the 10% left can be defined by FA.
the entry zone is valid. but if price kick my stoploss then , i will like to see price seek little higher price to the zone i point magnifier.

ETH 1D Analysis – Eyes on the 21EMAETH is currently hovering near $2,420, right above the key support at $2,415. Price is trying to reclaim the 21 EMA, which is crucial for bullish momentum.
🔹 Two Fair Value Gaps (FVGs) acting as demand zones
🔹 Daily close above 21 EMA = strong bounce expected
🔹 First major resistance at $2,740
🔹 Breakout could trigger a rally toward the $2,900+ zone
Bias: Bullish if reclaim confirmed
📌 Watch daily close – reaction from this level is key
NFA | DYOR
#ETH #Ethereum #Altcoins #Crypto #FVG #21EMA

$ETH is showing signs of a potential bullish move!CRYPTOCAP:ETH is showing signs of a potential bullish move.
The recent consolidation looks like it's building up for a strong breakout.
With market sentiment improving and growing interest in ETH-based projects, this could be a good time to accumulate before the next move up.
I’m watching the key resistance levels closely, if they break, we could see a fast rally.
#Ethereum
ETH.... You can do it. Get back into structure. ETH is struggling below resistance; however, an exchange of hands on lower timeframes can give the bulls a bit more wind. A break back into structure would be bullish. Don't mind me, I've been smoking that hopium.
Full TA: Link in the BIO
