ETHUSDTDISTRIBUTION +ACCUMULITON= RE ACCUMULITON
Accumulation begins and reaccumulation is being completed and the Wyckoff structure is completed
Composite Academy and Analysis
Professor Ramtia Siddiqui
Aram Pizbin Professor
BINANCE:ETHUSDT
ETHUSDT trade ideas

Ethereum (ETH): Seeing Struggle But Nothing Serious | Bullish AFETH still looks bullish to us, with the price staying above the local 200EMA, where last time we had a decent bounce from it.
Now, as many remember and know, we are bullish on ETH only due to 1 big reason: the liquidity of BTC has to go somewhere, and as investors have already had their fun (most of it, at least) with BTC, now they need to relocate their money and ETH is the next step.
$4000 is still our target (once again, as we already reached it once basically), and the current zone seems like a good bounce area with the 100 EMA and the middle line of the BB sitting there, in addition to lots of liquidity being distributed here (based on the order book we use)!
Swallow Academy
ETH: LIVE TRADEHello friends🙌
✅Given the good rise we had, we had a small correction that was a buying opportunity and there is another support area where we can buy the second step in case of further correction.
We have also specified targets for you, be careful and do not act emotionally and observe capital and risk management.
🔥Follow us for more signals🔥
*Trade safely with us*

ETH Price Weakens: Watching This Strong Demand Zone Closely$ETH/USDT Analysis (12H)
Ethereum has broken below a key support zone, confirming short-term weakness in price structure.
At the same time, the RSI is showing bearish divergence, signaling slowing momentum while the price was making higher highs — a classic early warning of a potential drop.
Now all eyes are on the strong demand zone below. If ETH finds support there, we could see a solid bounce or even a full trend reversal. But if this zone fails, deeper correction may follow.
DYOR, NFA
Thanks for the reading

ETH 4H – Demand Ladder Holding Strong, Bullish Set Up?Ethereum has been climbing a ladder of demand zones on the 4H chart — with each major impulse followed by consolidation and a successful retest of prior support. This current pullback has once again tapped into a reclaimed demand area near $3,400–$3,500.
So far, every past structure has acted as a springboard for the next leg up — a pattern that’s held since April.
📊 Key insights:
– Multiple confirmed demand zones stacking higher
– Prior demand flips to support after each breakout
– Most recent pullback held structure with Stoch RSI bouncing from oversold
– Structure and momentum suggest potential continuation if $3,400 holds
A breakdown of this final zone could invalidate the staircase, but until then, structure favors the bulls.
Is ETH gearing up for $4,000+ or finally losing steam?
Drop your thoughts in the comments.

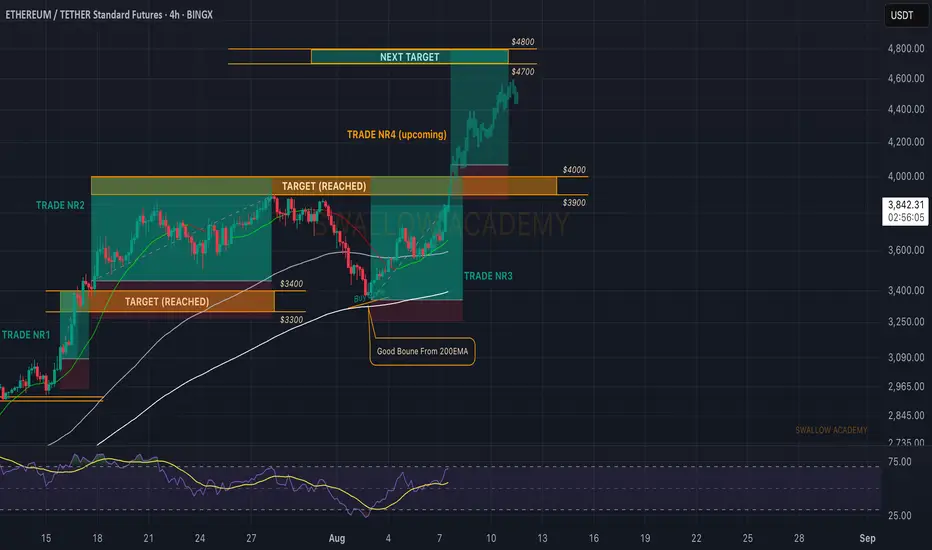
Ethereum (ETH): On Fire, Heading For Another Breakout Attempt ETH is on fire, where the price is catching the buyside momentum and probably going for that $4000K breakout attempt once again, where our trade will be closed as well (in the region of $3950-$4000).
So we wait for that zone to be reached and once we break it there, we will be looking for another entry for a long to $4800!
Swallow Academy
ETHUSDT: Elliot Analysis You can see the Ethereum chart in the long term, which indicates the end of the fourth wave and the beginning of the fifth wave, so with capital management, you can have a good investment.

ETH Targets $12,500 With Potential Ascending Triangle BreakoutThis post updates my earlier post and revises the previous prediction upwards.
Pattern
As we can see on the 3-Month ETH/USD log chart, ETH price compresses within an Ascending Triangle formed by trendlines set at the candle bodies (not wicks). The upper trendline is almost perfectly horizontal and sits at $3600. ETH is currently attempting breakout, but would need a 3-Month close (end of Q3) above the upper trendline at $3600 to confirm the new uptrend.
Target Price
As someone new to Technical Analysis, my original chart used the linear layout, which I have come to learn is less well suited for charting patterns on long timeframes. The updated chart here shows a much more reliable pattern, but also suggests a much higher, yet still conservative, price target of $12,500. I am unsure of the timeline for which ETH could achieve this price, but I assume it would occur this cycle, which is consistent with other bullish ETH predictions, such as Tom Lee's recent call for $10k - 15k.
Method
Ascending Triangles are bullish continuation patterns. The breakout price target is obtained by measuring the percentage distance from the widest part of the triangle and projecting that same percentage above the upper trendline.
Please feel free to offer your criticisms and observations. This is not financial advice.

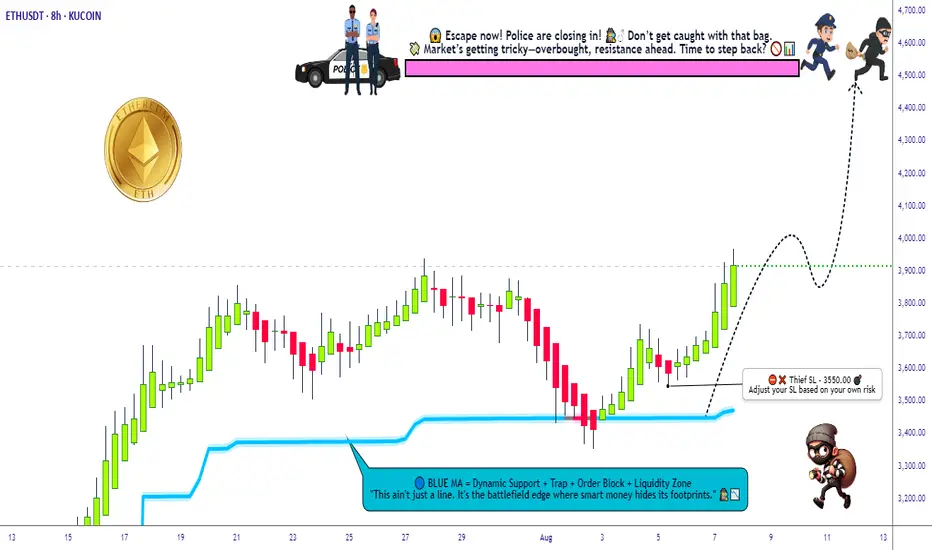
ETH/USDT Grid Plan » Bullish Loadout » Stealing the Top🚨ETH/USDT Crypto Heist Plan 🔓💰
Asset: ETH/USDT "Ethereum vs Tether"
Plan: 🟢 Bullish – Multi-Layered Entry Grid
Strategy: Thief-style limit orders (GRID / DCA stacking)
Entry: Any Dip is a Heist Opportunity 💸
Stop Loss: 🔻 3550.00
Target: 🎯 4500.00
👋 Hey Thieves & Money Makers!
Get your gear ready – it's time to loot the Ethereum Vault 💎🚀
🔥Thief Trader's ETH/USDT Master Robbery Blueprint🔥
This ain’t your average plan — we break in with layered entries, lock in on breakout volatility, and ride the bullish train to the moon 🌕.
💼 Entry Strategy:
No need to overthink. Any dip = loot zone!
Stack multiple limit orders like a pro (15M–1H level).
We're playing the grid game. The more dips, the bigger the stash! 🧱🪙
🚨 Stop Loss:
Set SL at 🔻3550 or under recent swing lows.
Adjust by risk appetite and how many entries you stack.
Thieves don’t chase – they calculate risk.
🎯 Target Zone:
We're eyeing the 4500 mark. But remember – exit before the vault shuts if momentum slows. 🏃♂️💨💰
🔁 Scalpers Alert:
Only long. Only bullish. Only profit. 🧲💥
Stack it, trail it, and let it run with a sniper's precision. 🎯🧠
📊 Market Context:
ETH bulls gaining control post-accumulation.
Strong on-chain metrics, solid macro tailwinds.
Bears trapped in the shadows – we move in daylight. 🐂🆚🐻
📰 Warning – News Bombs Ahead!
💣 Avoid fresh positions during high-impact events.
🎯 Use Trailing SLs to protect your loot.
Smart robbers never get caught unguarded.
💥BOOST This Idea if you're part of the robbery crew 🔐💰
Every boost powers our next move.
Let's rob the crypto market together – one breakout at a time! 🏴☠️📈🤑
Thief Trader™ – Locking Targets. Looting Charts.
💎🕵️♂️📊 #CryptoHeist #ThiefStyle #ETHBreakout #GridGang #BullMode
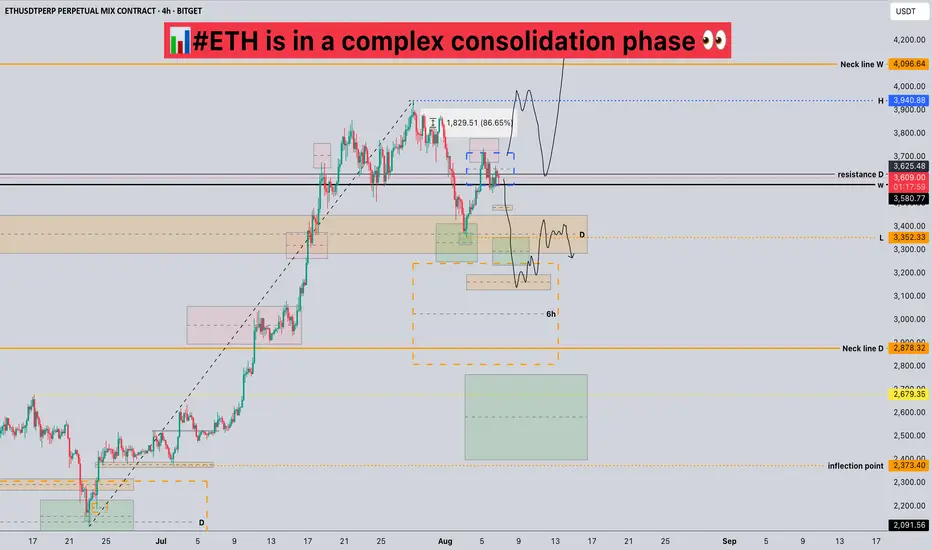
#ETH is in a complex consolidation phase📊#ETH is in a complex consolidation phase 👀
🧠From a structural perspective, the previous long uptrend has ended, so we should be wary of a deeper correction. We are currently in the middle of a complex consolidation, so there are many contradictions.
➡️Thus, if you want to participate in a long trade, you need to patiently observe whether this period of sideways consolidation can continue and a bullish structure can be established.
➡️If you want to participate in a short trade, you need to patiently wait for a break below the yellow support zone on the daily chart. This will then turn into resistance, and then look for short signals within that resistance zone.
🤜If you like my analysis, please like 💖 and share 💬
BITGET:ETHUSDT.P
ETH/USDT 15m SETUP.ETH/USDT 15m Setup 🚀
Price is approaching a clean POI (Order Block + Imbalance zone).
Expect a short-term dip into the zone followed by a bullish reaction.
📌 Trade Idea:
Wait for price to tap the POI
Look for bullish confirmation
Target upside continuation after liquidity grab & structure shift
High probability long setup incoming!

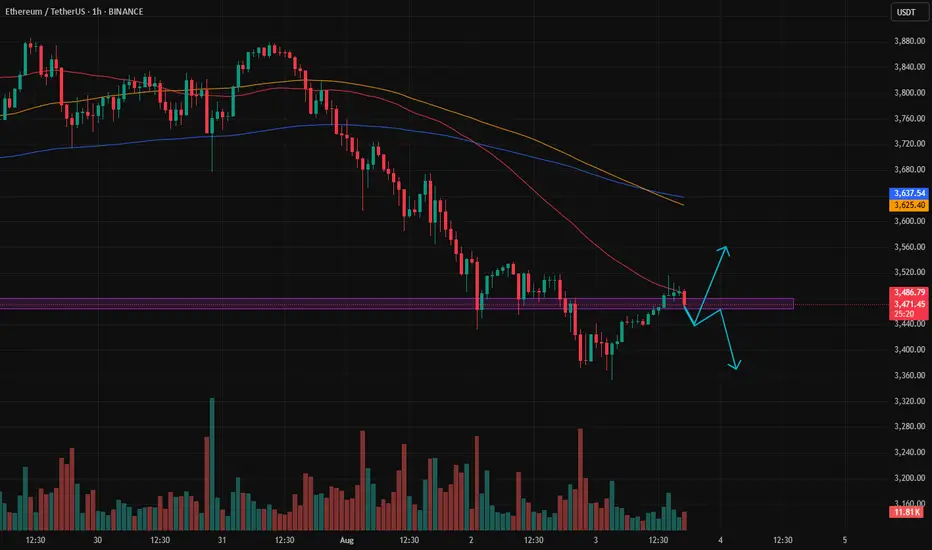
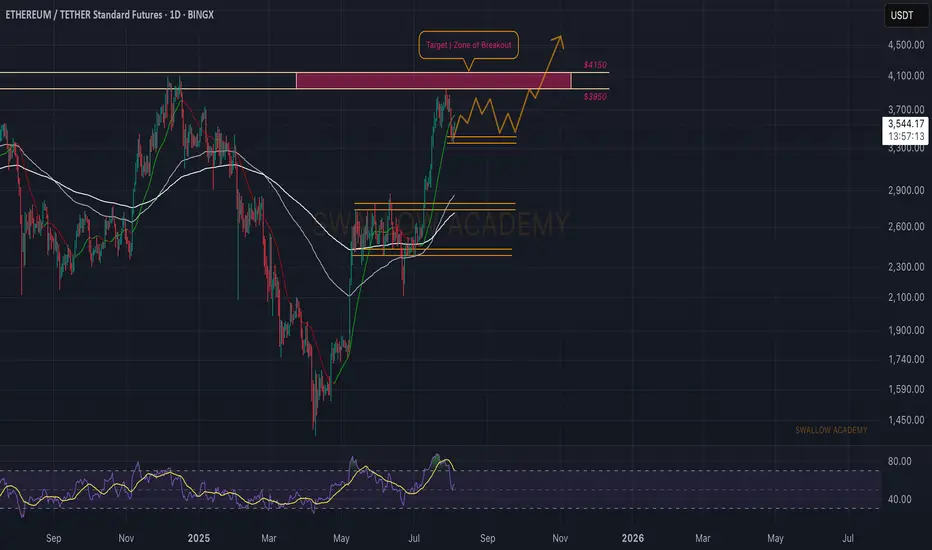
Ethereum (ETH): Zone of Rejection Turning Into Zone of BreakoutSince last time, we were looking for a zone of rejection, which happened as well, where price had a smaller pullback, and now upon the start of a new week, we might be seeing the start of recovery as well.
Which means, as long as we are above the $3,350 zone (which is the local low area), we are bullish; if we break that zone, this would be the ideal area for a short!
Swallow Academy
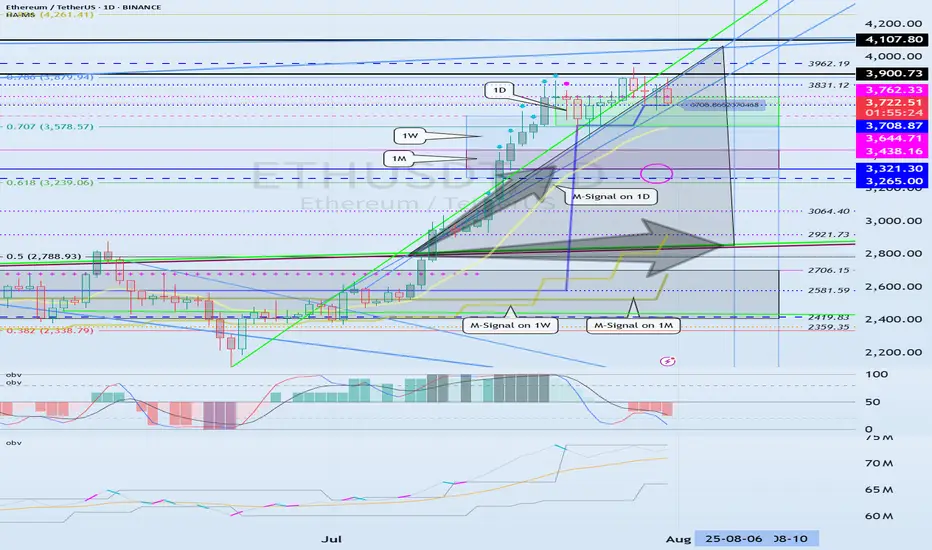
The key point to watch is whether it can rise to 3900.73-4107.80
Hello, traders. Nice to meet you.
If you "Follow," you'll always get the latest information quickly.
Have a great day.
-------------------------------------
(ETHUSDT 1D Chart)
The upward trend continues, with the M-Signal on the 1D chart > M-Signal on the 1W chart > M-Signal on the 1M chart.
Therefore, if the price holds above 3265.0-3321.30, a medium- to long-term uptrend is likely.
Currently, the HA-High ~ DOM(60) range is formed across the 3265.0-3762.33 range on the 1M, 1W, and 1D charts.
Therefore, the key question is whether support is found within the 3265.0-3762.33 range.
-
While the price is trending upward along the short-term trendline, if it falls below the short-term trendline and encounters resistance by falling below the M-Signal indicator on the 1D chart, a decline to the 3265.0-3321.30 range is likely.
ETH's volatility period is expected to last from August 6th to 10th.
The key point to watch is whether it can rise above the 3900.73-4107.80 range after this volatility period.
-
Since the StochRSI indicator has entered an oversold zone, the downside is likely to be limited.
Since the OBV indicator of the Low Line ~ High Line channel remains OBV > OBVEMA, a significant decline is unlikely.
However, since the TC (Trend Check) indicator is below zero, selling pressure is dominant.
Therefore, a decline below 3708.87 could lead to further declines. However, as previously mentioned, the decline is likely to be limited, so a significant decline is not expected.
Once the M-Signal indicator on the 1D chart is encountered, the trend is expected to re-establish itself.
-
Thank you for reading to the end.
I wish you successful trading.
--------------------------------------------------
- This is an explanation of the big picture.
(3-year bull market, 1-year bear market pattern)
I will explain in more detail when the bear market begins.
------------------------------------------------------
ETH LongFollowing a significant decline, the asset will take support and bounce back from this point.
Disclaimer: This is not financial advice.
This algorithm provides highly precise buy and sell signals with alerts:

ETH | Ethereum Game Plan - Swing Long IdeaETH | Ethereum Game Plan - Swing Long Idea
📊 Market Sentiment
Market sentiment remains bullish, supported by expectations of a 0.25% rate cut at the upcoming FOMC meeting. The weakening USD and rising risk appetite across global markets are favoring crypto assets in particular.
📈 Technical Analysis
Price swept the range low (Weekly Fair Value Gap), resulting in a deviation.
It then aggressively reclaimed higher levels and closed above key resistance.
A 12H demand zone was formed during this move.
We’re now seeing a retracement towards that 12H demand zone.
📌 Game Plan
I’m looking for price to hit the 12H demand zone at $3,530 and show a strong reaction.
This level is also below the 0.5 Fibonacci retracement, placing it in the discount area — an ideal entry zone for me.
🎯 Setup Trigger
After price taps the demand zone, I want to see a 1H–4H bullish break of structure to confirm the reversal before entering.
📋 Trade Management
Stoploss: Below 1H–4H swing low
Targets:
• TP1: $3,872
• TP2: $4,090
I’ll trail my stop to lock in profits aggressively as price moves in my favor.
💬 Like, follow, and comment if this breakdown supports your trading!
More setups and market insights coming soon — stay connected!

ETH Testing Critical $4K Resistance!BINANCE:ETHUSDT is trading inside an ascending triangle on the weekly chart, with price compressing between the resistance line and a rising support line. After a strong rally from the $1,500 demand area, ETH has reclaimed the 100- and 200-week EMAs and is testing the triangle’s upper trendline with increasing volume.
A weekly close above $4,000–$4,200 would confirm a triangle breakout and open upside toward $6,000–$7,500, while a rejection could send price back toward $3,200–$3,000 for further consolidation. Wait for a clear weekly close and volume confirmation.
Cheers
Hexa
BITSTAMP:ETHUSD CRYPTOCAP:ETH

ETHUSDTPreferably suitable for scalping and accurate as long as you watch carefully the price action with the drawn areas.
With your likes and comments, you give me enough energy to provide the best analysis on an ongoing basis.
And if you needed any analysis that was not on the page, you can ask me with a comment or a personal message.
Enjoy Trading ;)

Smart Money Knows: ETH Is Gearing for a Supercycle...Hello Traders 🐺
In this idea, I wanna break down why $15K ETH isn't just a fantasy — it's a real, reachable target. So stay with me 'til the end, because this is just the beginning for Ethereum and the altcoin market.
If you’ve been following my ideas over the past year, you know I’ve been loudly calling for an incoming altseason — especially since ETH hit $1700. I kept saying: “Load up on ETH while you can,” because smart money was clearly rotating into it.
And now? We’re seeing the result.
Since then, Ethereum has nearly 2x’d, and ETH ETFs are pulling in massive inflows — but the price hasn’t exploded yet. Why? Let’s look closer.
Over the past 90 days, ETH has rallied around +180%, but in a quiet, steady climb — which is actually bullish. A strong move with low hype = accumulation. That’s how smart money moves.
📊 Monthly Chart Breakdown:
ETH is moving inside a perfect ascending channel, with clean touches on both support and resistance. Right now, price is forming a bullish flag pattern at the upper range — a classic continuation structure.
Volume has dropped during this flag, which is a textbook sign of accumulation. Add to that: RSI is sloping downward, signaling that large players are shaking out weak hands while loading up quietly.
So yes — ETH has already done +180% during this consolidation phase, which tells us something big is brewing.
🔁 The current pullback on the daily? In my opinion, it’s just a technical reaction to the flag resistance. RSI is also trying to break above its own trendline. If both confirm, the next wave begins.
🎯 Targets?
First target: All-Time High around $4870.
After that? There's nothing but air until we hit the top of the monthly channel near $15,000.
That breakout above ATH is where the real FOMO begins — not just for ETH, but for the entire altcoin market.
Let’s not miss what’s coming.
And as always, remember our golden rule:
🐺 Discipline is rarely enjoyable, but almost always profitable. 🐺
🐺 KIU_COIN 🐺

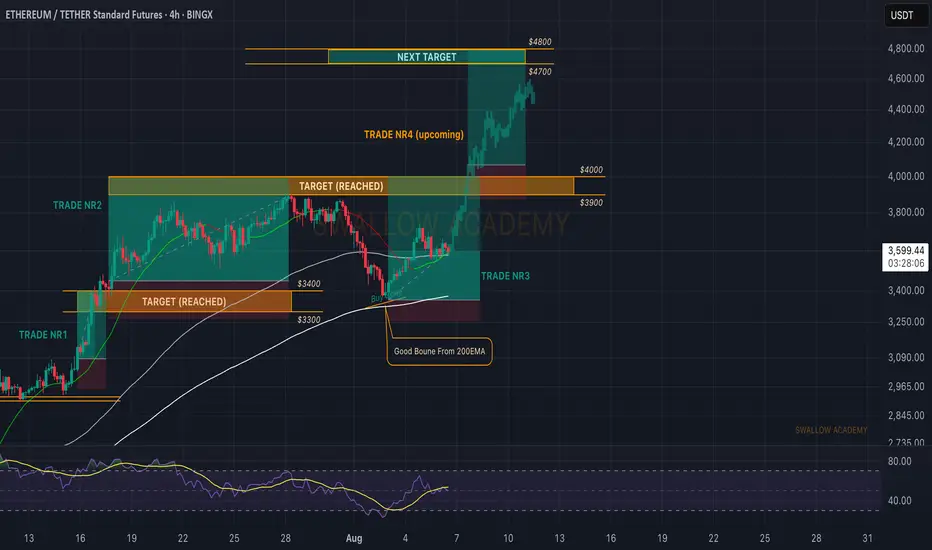
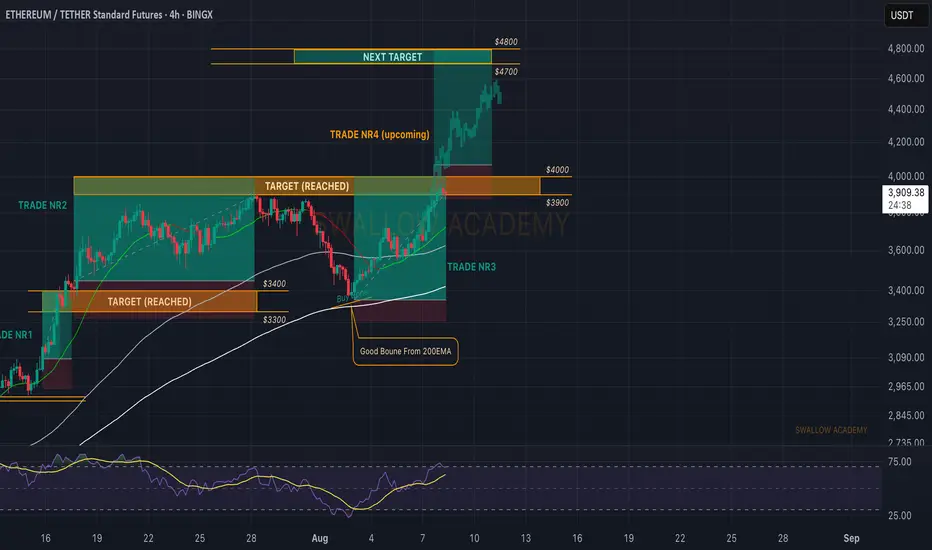
Ethereum (ETH): Caught 45% of Movement in Total | $4800 Is Next3 trades we had on ETH, in combined 45% of market price movement. Now that we are at the end of the current week, we are going to look for a proper breakout from $4000, where then we will be opening yet another long with the target being at $4800.
Swallow Academy
Can Ethereum Hold This Crucial Level and Continue its Ascent?Can Ethereum Hold This Crucial Level and Continue its Ascent?
ETHUSDT presents a clear bullish structure on the daily timeframe, having recently broken out of a multi-month consolidation pattern. The market has encountered a significant resistance zone but has since pulled back to test a key support level. The price action is currently defined by a series of well-established support and resistance zones, along with a crucial rising trendline, which together will determine the asset's next major move.
1. The Bullish Impetus & Key Resistance:
All-Time High Resistance ($3900 to $4000): This upper red zone represents a significant supply area where sellers have historically entered the market, preventing a new all-time high. The recent rally encountered resistance in this zone, leading to the current pullback.
The Rally from the Consolidation: Following a period of consolidation, Ethereum staged a powerful rally, breaking through several resistance levels on its way to re-testing the all-time high zone.
2. The Immediate Support Zone:
First Support ($3300 to $3500): The current price is engaging with this green zone. This level has been a key area of previous support and resistance, and its ability to hold as support will be a critical test for the bulls. A successful defense of this zone would be a strong signal for a continuation of the upward momentum.
3. The Crucial Level & Trendline Confluence:
Crucial Level ($2700 to $2900): Below the immediate support lies a more significant support confluence zone, marked by the blue box and a rising trendline. This "Crucial Level" is a major demand zone that has previously served as a pivot point in the market. The confluence with the rising trendline, which has been providing support since late March, makes this a highly significant area.
0.5 Fibonacci Retracement: This area also aligns with the 0.5 Fibonacci retracement level of the recent major move, reinforcing its technical importance. A break below this zone would suggest a significant shift in market sentiment.
4. The Ultimate Support:
Long-term Support ($2000 to $2200): This lower green zone represents a robust long-term support level. If the "Crucial Level" were to fail, this area would be the next major target for a deeper correction. The 0.618 Fibonacci level is also situated within this zone, further highlighting its significance as a potential bounce area.
Conclusion:
ETHUSDT is currently re-testing its first major support zone after a rally toward all-time highs. The ability of the bulls to defend the "$3300 to $3500" level will be crucial for a potential re-test of the "$3900 to $4000" resistance. A failure to hold this support would likely lead to a retracement toward the even more critical "$2700 to $2900" level. The integrity of the rising trendline and the "Crucial Level" will be the ultimate determinant of whether the long-term bullish trend remains intact.
Disclaimer:
The information provided in this chart is for educational and informational purposes only and should not be considered as investment advice. Trading and investing involve substantial risk and are not suitable for every investor. You should carefully consider your financial situation and consult with a financial advisor before making any investment decisions. The creator of this chart does not guarantee any specific outcome or profit and is not responsible for any losses incurred as a result of using this information. Past performance is not indicative of future results. Use this information at your own risk. This chart has been created for my own improvement in Trading and Investment Analysis. Please do your own analysis before any investments.

ETH 1H – Retest in Play, But Can Bulls Push Past 3.95K?Ethereum has tapped into the 3.95K resistance zone after a strong upward run, with Stoch RSI now cooling off from overbought levels. Price action suggests a potential pullback toward the 3.77K–3.78K support zone, which aligns with prior breakout structure and moving average support.
If buyers defend this retest, momentum could carry price through the 3.95K barrier and open the door for continuation toward 4K+. Failure to hold the lower zone, however, may trigger a deeper correction into the mid-3.6K range.
Key watchpoints:
– Retest of prior breakout level at 3.77K
– Stoch RSI oversold potential bounce setup
– Clear resistance overhead at 3.95K to break for further upside

Ethereum ETH at Key Resistance: Here's My Trade PlanEthereum (ETH) has maintained a fairly bullish structure overall 🟢, but price is now trading into a significant resistance level 🧱📈. I’m closely monitoring for a reaction at this zone — ideally a rejection that leads to a pullback into a key support area 🔄📉.
If ETH finds support and we get a clean bullish break in market structure from there 📊🚀, that could present a high-probability setup to the long side — contingent on price action confirming the bias. 🔍 Not financial advice ⚠️.

Patience to identify the market trendBased on the previous analysis, after hitting the sell target, the price made an upward correction.
Right now, it’s unclear whether we’re seeing the beginning of a trend reversal to the upside, or if the price is going to drop back below the zone, giving us another short opportunity.
If it does drop again, there’s a possibility it could fall as far as 3000.
We need to be patient and let the market show its hand — then we can respond accordingly.