Ethereum near term.Possible near term scenario.
* The purpose of my graphic drawings is purely educational.
* What i write here is not an investment advice. Please do your own research before investing in any asset.
* Never take my personal opinions as investment advice, you may lose your money.
ETHUSDT trade ideas

ETH + ALTSEASON | NEW All Time Highs Soon ??This would have been the first time that BTC made a new ATH during a bullish cycle, but ETH didn't - are we too hasty?
Very interesting to compare the two side by side and see that ETH has much more to gain than BTC:
The BTC new ATH update can be found here:
______________________
BINANCE:BTCUSDT BINANCE:ETHUSDT

Ethereum (ETH): Good Rejection Happening | Correctional MovementEthereum had a good rally, but now we are seeing the dominance has fallen to sellers. While seeing the smaller correction that we have been looking for, we are seeing the price fall towards the 100EMA, where we expect to see another upward movement from there on.
So the game plan is simple here: we wait for clarity and proper touch to the 100EMA before looking for a long position on ETH.
Swallow Academy

Ethereum (ETH): Sellers Showing Dominance, ETH up by 50% Ethereum is up by 50% since our entry on that coin, where we already took some decent profits as well (more than 60%). Despite us seeing further movement to upper zones, price has fallen for now to the major EMA line (200), where we need to see dominance fall back into buyers to see our second target reached.
With that being said, we are looking for upward movement towards our second target, from where we expect to see another wave of correction, similar to what we are seeing right now.
Swallow Academy

Short-term correction waves.Ethereum’s RSI has been rising significantly recently and has reached the overbought region. Therefore, it would not be surprising if it drops to the RSI mid-band from here. Then I expect Ethereum to continue its bullish waves.
* The purpose of my graphic drawings is purely educational.
* What i write here is not an investment advice. Please do your own research before investing in any asset.
* Never take my personal opinions as investment advice, you may lose your money.

ETHEREUM New Update (1D)Ethereum has reclaimed the flip zone, but it hasn't tested this area or made a proper pullback yet.
It's expected that this zone will be tested before the price moves toward higher targets.
If we see a strong reaction around the green zone, we can look for potential buy/long positions.
A daily candle closing below the invalidation level would invalidate this analysis.
For risk management, please don't forget stop loss and capital management
When we reach the first target, save some profit and then change the stop to entry
Comment if you have any questions
Thank You

ETHUSDT LONG TRADE IDEA.ETHUSDT is showing strength but I will not long it blindly, first I will look for liquidity sweep then reclaim that point which is marked as POI. Then you can ride on long.

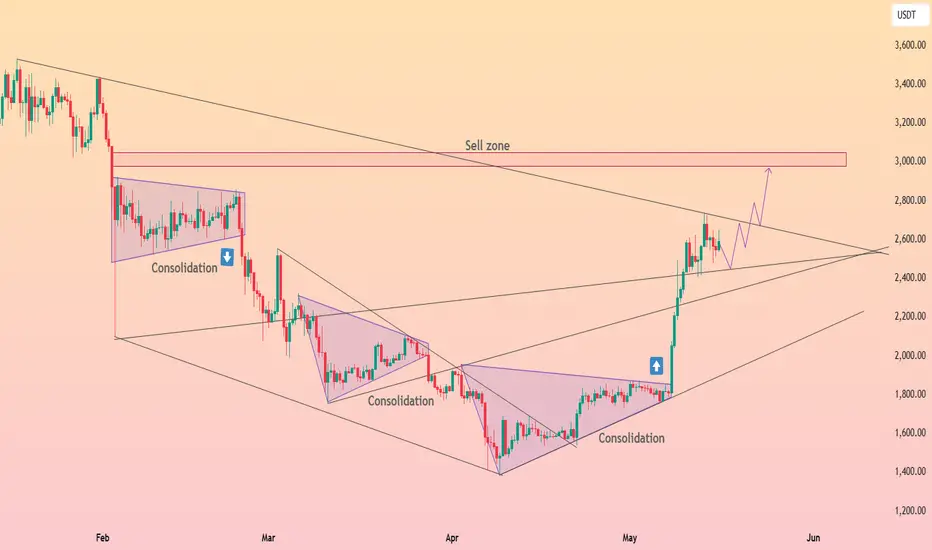
HolderStat┆ETHUSD wedge liftoff eyes 3 k sell zoneCRYPTOCAP:ETH blasted out of a multi-month falling wedge, erupting from 1.8 k to 2.7 k in one vertical burst. Price is now hovering above the broken wedge roof and an intersecting long-term trend line at roughly 2.55-2.60 k. If this freshly minted support holds, the pattern’s measured move directs attention to the 2.9-3.1 k sell zone in red. A dip under 2.45 k would simply delay, not negate, the bullish structure while the broader trend stays up-sloping.
ETH IS SHORT TIMEEthereum (ETH) recently enjoyed a strong bullish run, capturing investor excitement and surging in value. However, after the rally, it’s now pausing—consolidating gains and catching its breath. This cooldown is natural and healthy for long-term growth, setting the stage for potential future moves with renewed strength and stability.

ETH ANALYSIS📊 #ETH Analysis
✅There is a formation of Falling Wedge Pattern on daily chart and currently trading around its major support zone🧐
Pattern signals potential bullish movement incoming after sustain above the major support zone
👀Current Price: $2380
🚀 Target Price: $2785
⚡️What to do ?
👀Keep an eye on #ETH price action and volume. We can trade according to the chart and make some profits⚡️⚡️
#ETH #Cryptocurrency #TechnicalAnalysis #DYOR

Next step for ETHThere is a ending diagonal formed from five overlapping waves and now it is preparing to break the bottom of the first wave and then decline again.
*In principle, I am not a supporter of any direction, but I am only giving my point of view, which may be right or wrong. If the analysis helps you, then this is for you. If you do not like this analysis, there is no problem. Just ignore it. My goal is to spread the benefit. I am not one of the founders of the currency.

Short ETH | Target: $2,128ETH has tapped into a key resistance zone, potentially completing a 5-wave Elliott impulsive structure.
We’re also observing bearish divergences across multiple indicators, suggesting weakening bullish momentum.
Additionally, the neckline of a Head & Shoulders pattern has been broken, further supporting the bearish outlook.
I'm targeting the $2,128 level as the next area of interest, aligning with .618 Fib support and previous structure.
On the daily timeframe (D1), the $2,128 level aligns with a local demand zone and major trendlines that are likely to be retested
📉 Let’s see if the market confirms this setup.


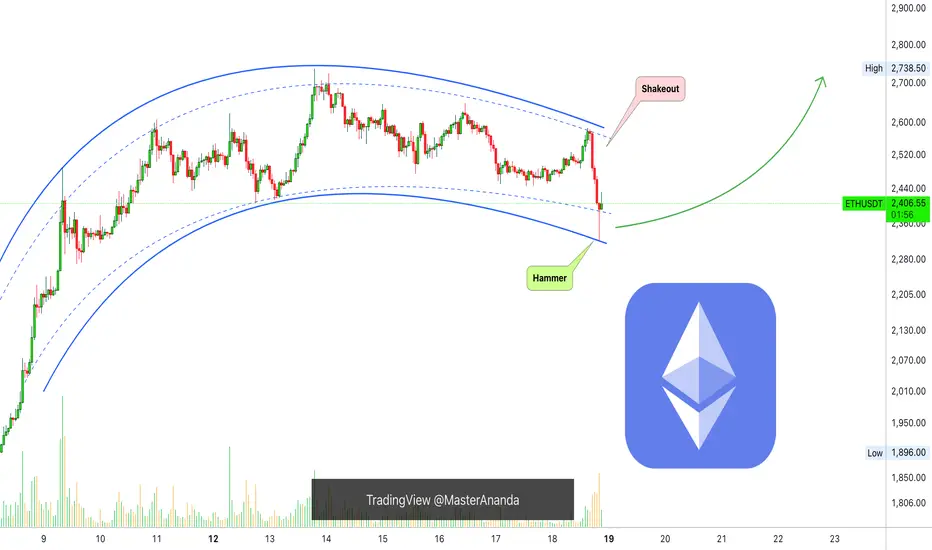
Ethereum Short-Term, Bullish Or Bearish?Notice this recent shakeout on the chart, this is a major move and surely removes lots of over leveraged positions. It also traps the bears, a bear-trap.
If this move continued lower it would be bad news but the 1H candle ended with a long lower wick, producing a hammer which is a reversal signal. This candle produced the lowest price since 9-May, 9 days ago, and the current candle is green, this tells us that a shakeout is confirmed.
The bearish move is a failed signal so the next move is up. With a very small bullish continuation, the current candle closing at current price or higher, it is confirmed ETHUSDT to continue rising.
(If the current candle were to close red and lower this would be a bearish confirmation.)
Short-term bullish structure intact. It is normal to see the market shaking before a major move. Remember, Bitcoin is about to close its 6th consecutive week green, the most bullish development of the decade. This affects Ethereum of course and the entire Cryptocurrency market.
Namaste.
Ethereum: +80% in a Month — What’s Next?Hey traders and investors!
The price of ETH has surged by more than 80% over the past 30 days, but the momentum is starting to slow.
To understand the current position, we’re using the magic of timeframe switching and focusing on the 15-day chart.
Key Observations
1️⃣ A sideways range (consolidation) has formed on the 15D chart, with anchor points 1–6 (see chart).
2️⃣ The last major initiative came from sellers (move from point 5 to 6), and it includes some key features:
The initiative pushed below the lower boundary of the range — $2111.
The highest volume occurred on the last bar of this move (IKC bar).
The IKC bar absorbed liquidity not only below point 4 of the range but also below point 0 — the origin of the price move that preceded the formation of the range.
3️⃣ Buyers began developing their initiative by absorbing the sellers’ IKC bar, pushing price back into the range, and forming a buyer zone (blue rectangle on the chart, with the upper boundary at $1957).
4️⃣ Buyers have already reached the first target — $2717 (point 1 level).
What Does It Mean?
The rapid rally may slow down — the market likely needs some consolidation or a pullback.
A correction toward $2111 or even $1957 is possible. Both zones are attractive for medium-term long setups.
The medium-term bullish scenario remains valid as long as price stays above $2111.
Trade Outlook
📈 Long zones: $2111, $1957, or after a breakout and hold above $2717
🎯 Targets: $3744, then $4100
📉 Shorts are currently not justified — sellers show no real strength
Be ready for a potential “pause” in the rally and watch buyer activity — they currently hold the initiative (!).
This analysis is based on the Initiative Analysis concept (IA).
Wishing you profitable trades!

Last year Nov ETH $ETH VibesIf we See a $2800 Zone Breakout it will be Huge Week for Alts Ethereum
Will history repeat itself?

Eth Short ScalpEth is wanting to start it's b wave correction, so am expecting price to head lower than my Profitzone, so will update the idea as it progresses.
Idea includes:
Entry - Stop Loss - Conformation - Profit Zone
Not Trading Advice. Not Always Worth Ignoring.

Accumulation / Sign of Strenght The observed structure suggest a potential accumolation phase according to the Wyckoff model , currently in a testing or awaiting a Sign of Strenght

A bullish divergence on the 1-hour (1H) time frame for ETH (EthePrice chart: ETH has made lower lows over the past few hours.
RSI: RSI shows higher lows during the same period.

Test of new trading pattern strategy: ETHStarted using my own new favorite method of charting, it went well with previous coin (almost spot on), so testing it here with ETH with my LONG idea. No more words here, lets just watch the results first.

Ether ready for another leg higher.I think ether will continue its upside move.
People are wanting lower but it seems like it is not going to happen before it melts faces.
For now i think it is worth taking the risk to long from here.

2025.05.18 ETHEREUM Short-term long positionWe are the SeoVereign Trading Team.
With sharp insight and precise analysis, we regularly share trading ideas on Bitcoin and other major assets—always guided by structure, sentiment, and momentum.
🔔 Follow us to never miss a market update.
📈 Ethereum (ETH) Long Position Outlook
Ethereum is currently one of the most difficult assets to predict in terms of direction.
Recently, it has shown frequent irregular movements, which—while unpredictable—can be attractive from a short-term trading perspective due to the increased volatility.
From a technical standpoint, Ethereum appears to have completed its B wave.
When measuring the 5-wave structure using trend-based Fibonacci extension, the B wave concludes near the 0.786 level.
This 0.786 extension is a custom wave ratio developed by the Seovereign team and has shown strong reliability in live trading scenarios.
To avoid visual clutter on the chart, we have chosen to highlight only the most important 0.786 level in this analysis.
All detailed wave counts and ratios have been marked on the chart, so feel free to refer to them for more specifics.
🎯 Target Levels
1st Target: 2,555
2nd Target: 2,589
3rd Target: 2,624
Due to the high volatility, the potential for opportunity is also high—but proper risk management remains essential.
This zone is considered a technically valid entry point for a long position.
Approach the market with flexibility and strategic focus.

ETHUSDT.P~We are In Accumulation To Seek Liquidity SSL/4D Maybe (2314)
~If We are "Respected" Next target Is IPDA 40
~ Maybe To Next Week
