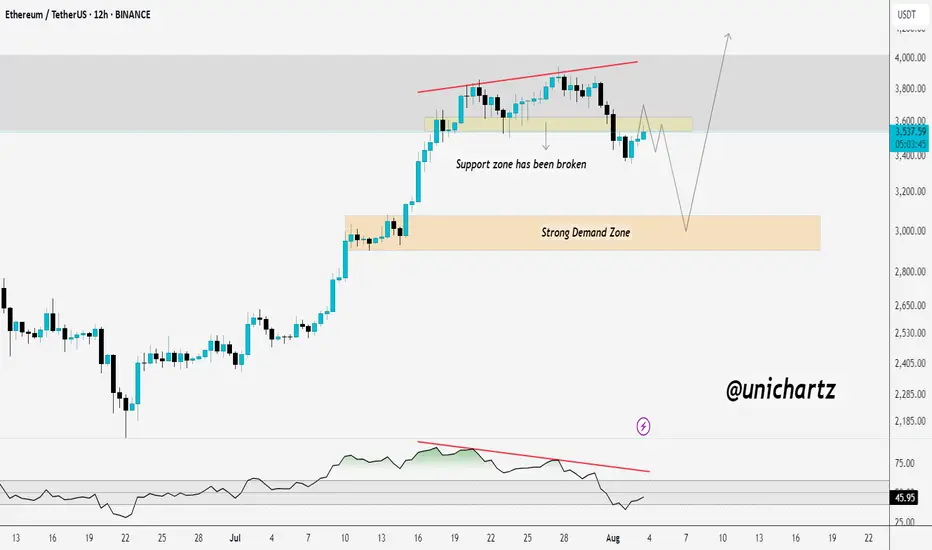
Breakdown Confirmed? ETH Could Drag Alts LowerCRYPTOCAP:ETH support zone around $3,560 has been broken, and current price action appears to be a retest of the breakdown. If ETH fails to reclaim this level, we could see further downside toward the strong demand zone near $3,000.
The RSI bearish divergence also adds to the bearish bias. If this retest fails, altcoins may face deeper corrections, as ETH often leads the market.
DYOR, NFA
ETHUSDT trade ideas

ETH Breakout Strategy
🚀 ETH Breakout Strategy 🔥
♦️ As mentioned before, the long position on ETH/USDT had to be placed before the 0.03277 breakout on ETH/BTC.
✅ Simultaneously, ETH.D broke above 12.16%, adding strong confluence to the bullish setup.
⭕️ The final confirmation came when ETH/USDT broke above 3724.00 – a high-probability entry for trend-followers.
💎 Missed it? Don’t worry.
🔜 The next long setups will be:
1. Break of 3900.00
2. Followed by the break of 4000.00 – which is probably to break impulsively and sharply.
♦️ Until ETH drops below 3300.00, I remain bullish-biased and will look only for long setups.
Even if I miss potential short-term short opportunities, it's not an issue.
❗️Why?
Because my strategy is based on aligning with the higher timeframe trend – and for me, that’s the 1D cycle, which is currently bullish.
🔥 In trading, patience with direction beats chasing every move.
🚀 If you value clean structure-based analysis, hit the rocket, drop a comment, and don’t forget to follow for more crypto insights!

Long trade
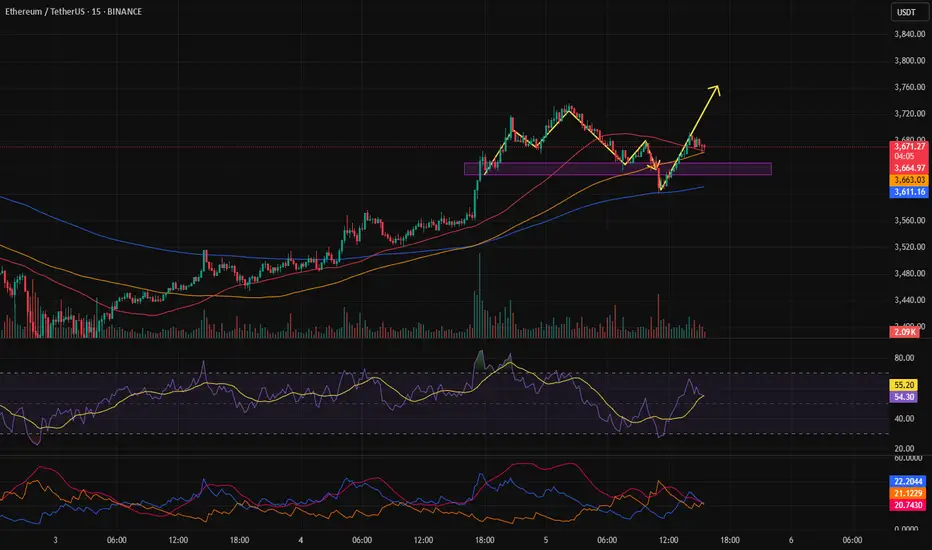
15min TF overview
🟩 Trade Type: Buyside Trade
Pair: ETHUSDT
Date: Sunday, 3rd August 2025
Time: 5:15 PM
Session: London–New York Overlap (LND Session PM)
Timeframe: 15 minutes
🔽 Entry Parameters
Entry Level: 3,455.23
Stop Loss: 3,436.73 (-0.54%)
Take Profit: 3,877.00 (+12.21%)
Risk-to-Reward (RR): 22:8
📉 Market Structure & Technicals
Trend Context:
Price reversed from a steep bearish trend and showed signs of a bullish momentum shift.
EMA/WMA Levels:
EMA (blue) and WMA (yellow) show a bullish crossover at the point of entry
Both MAs began to slope upward, confirming the trend shift.
Liquidity Observations:
Clean sweep of prior lows below 3,500 preceding entry.
Price traded back into a premium zone after reacting from a deep discount.
🧠 Narrative / Rationale
Set up Narrative:
ETH completed a strong downtrend and printed a bullish market structure shift (MSS) on the 15-minute TF. Entry was taken after price reclaimed the (POI) and confirmed a higher low.
Current Status: Trade in progress, profit levels partially hit.
TP aligns with the previous supply zone or relatively equal highs around 3,784.
Additional liquidity above 3,877–3,915 for extended targets if trade continues.

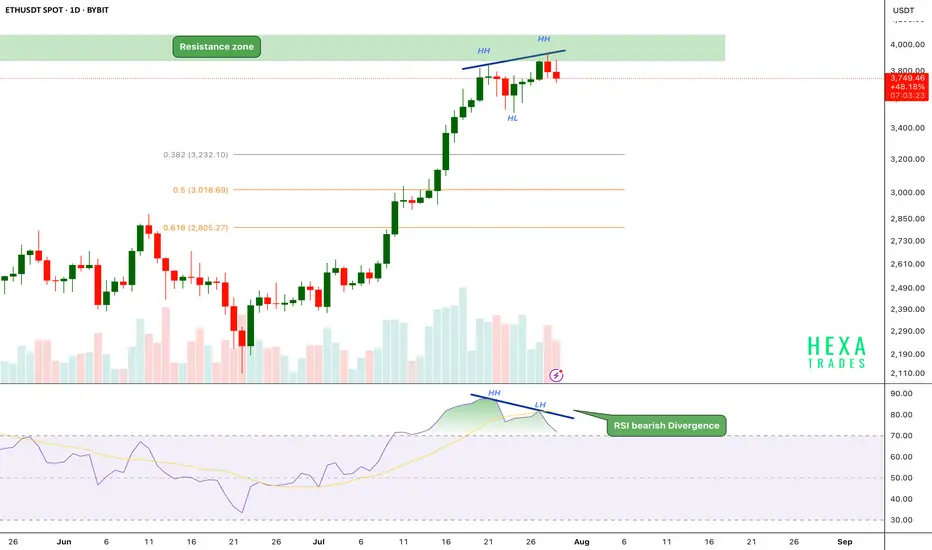
ETH Bearish Divergence!CRYPTOCAP:ETH has been in a strong uptrend, printing consistent higher highs (HH) and higher lows (HL). However, on the daily chart, the price has now reached a critical resistance zone near the $3,800–$4,000 range.
Key Points:
🔸 Bearish RSI Divergence
While price action has formed a new higher high, the RSI has printed a lower high, signaling bearish divergence.
This indicates that upward momentum is weakening even as price attempts to push higher — a common early warning of a possible short-term reversal.
🔸 Fibonacci Retracement Levels
The fib 0.382 at $3240 and 0.5 and 0.618 retracement levels are sitting around $3,000 and $2,800, respectively, potential targets if a correction follows.
🔸 Volume Profile
Volume is gradually declining as price approaches resistance, suggesting buyer exhaustion.
If the price breaks above the $4,000 psychological resistance, we could see a strong bullish move.
ETH is facing strong resistance after a powerful rally, with RSI bearish divergence and weakening momentum hinting at a possible short-term pullback. We should be cautious entering fresh longs here without confirmation.
Support: $3,200, $3,000, and $2,800
Cheers
Hexa
BINANCE:ETHUSDT BITSTAMP:ETHUSD
ETHUSDTPossible short on ETH, as we know this might be a news dump that caused this blood in the market and might recover very soon, but we broke a key support level, this is the 4HR chart and we will have a better idea what's on the table when weekly close.

Failure of the head and shoulders pattern to activateThe failure of the head and shoulders pattern to activate suggests that the bullish trend may likely continue.
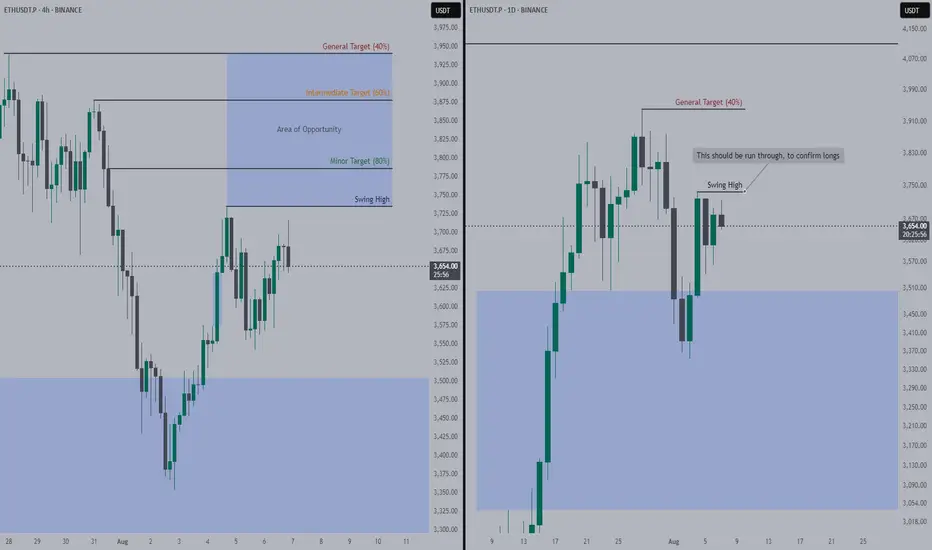
Ethereum Needs to RUN Swing High (Latest)To confirm longs and look for entries, we need price to run through Swing High.
If price closes above Swing High in 4H price action, I will be looking for longs within Area of Opportunity (AoO).
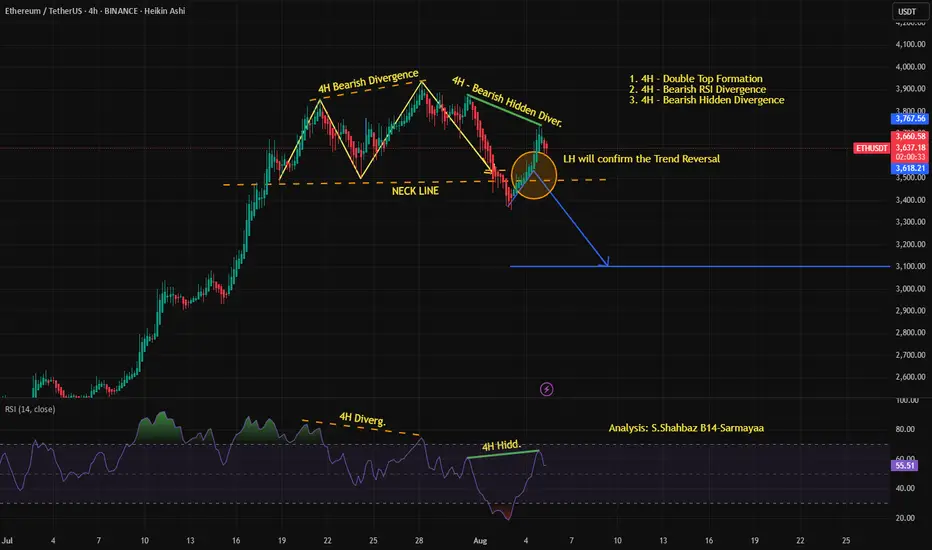
ETH/USDT - 4H Bearish Reversal Setup Confirmed by Double Top &..This 4H chart of Ethereum (ETH/USDT) is indicating a strong bearish reversal setup. A double top formation has formed near the $3,770 zone, accompanied by both a regular bearish divergence and a bearish hidden divergence on the RSI.
Price has broken down below the neckline of the double top, and a possible retest zone is marked, which may act as resistance.
If the price gets rejected from this retest area, the 4H confirmation candle will validate a trend reversal, potentially targeting the $3,100–3,000 zone.
ETH/USDT – Smart Money Is In. Is a New Bull Cycle Starting?What is the market telling us? Without a doubt, Ethereum is entering a new weekly-level bullish cycle, a move that could reshape the altcoin landscape in the coming months.
🔍 Trend Confirmed – Breakout from Ichimoku Cloud & Key Resistance
ETH has just broken out of a multi-month accumulation phase around the $2,000–$2,400 range. On the weekly timeframe, price has clearly broken above the Ichimoku Cloud and pierced through the major resistance zone that had previously capped upside moves.
This is not a technical bounce — it’s a confirmed trend shift into a mid-to-long-term uptrend.
💡 Key Insight: Steady Volume Growth = Smart Money
Unlike FOMO-driven rallies, this breakout is accompanied by steady, non-explosive volume, indicating smart money accumulation rather than speculative chasing.
🧱 Fair Value Gaps (FVGs) – Zones You Can’t Ignore
On the weekly chart, ETH has printed multiple Fair Value Gaps — price zones where strong buying pressure left the market no time to fill the gaps.
Key FVG zones to watch:
🔹 $2,400 – $2,700
🔹 $2,900 – $3,200
🔹 $3,400 – $3,700
These are not just support zones — they are “whale footprints”. Price often reacts to these levels and they offer ideal re-accumulation zones before the next leg up.
📈 Clear Trend Structure – Higher Highs, Higher Lows
ETH is currently trading around $3,910, a price level that hasn’t held steady since early 2022. But now, things are different:
✅ Trend shift confirmed – Higher Highs & Higher Lows
✅ Volume supports the move
✅ Market sentiment is clearly improving
If ETH holds above $3,700, the next target could be $4,800 – $5,000. In a more bullish scenario, we may even see a return to all-time highs, especially if Bitcoin continues to lead the market.
🧠 Trading Strategy: No FOMO – Wait for a Better Entry
❌ I’m not buying into $3,900+.
✅ I’ll wait for ETH to pull back into the $3,400–$3,600 range — a confluence zone including:
Strong FVG
Previous support
Ichimoku Cloud
Bullish structure
If clear confirmation shows up here (e.g., increasing volume, pinbar, bullish engulfing), I’ll open a medium-term long position targeting the $5,000 zone.
At that level, the risk:reward is extremely attractive.
💬 Final Take: This Is Not Just a Technical Bounce
Looking at the full picture — structure, volume, smart money flow, and sentiment — this is not a typical technical rebound. It's the early phase of a new bullish cycle, led by Ethereum.
And as I always say:
"Altcoins don’t rally because of FOMO — they rally because Ethereum leads the charge."
👉 What price zone are you watching ETH at?
Do you have a strategy for this wave?
Drop your thoughts in the comments — I’d love to hear your view!

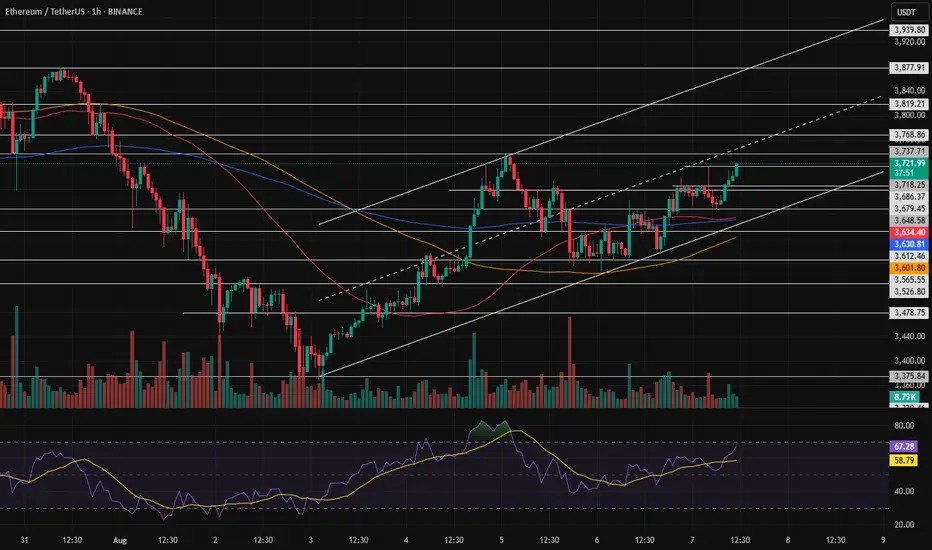
The 3738.28 zone is the golden pointAfter confirmation in this price zone, we can say that the path to 3800 becomes much easier and more likely, making the move toward 4000 more feasible. However, it's still too early to make decisions about that, so for now, we're only analyzing up to 3800.
EthusdHonestly probably marks up very heavily soon...
We are entering etf bid war phase of the cycle.
Can't even really draw how vertical this chart could go as certain macro economic conditions seem to be brewing...
15k is the predicted target of certain large tradfi firms that are accumulating, bitmine for example.
They are basing their targets from the success of the circle internet groups public listing as well as fundamental factors such as JPMorgan and other institutions launching their own stable coins on ethereum...
Multiple companies rushing to accumulate 5% of the supply while predictions of a 75bps rate cut from the fed are starting to brew...
Supply shock combined with inflationary event aswell as eths successful merge earlier this year are incredibly bullish catalysts and we aren't even at the ath valuations seen last cycle.

Update on the previous analysis.Our analysis hasn’t changed much since yesterday — we still believe the price will reach the $3,330 zone unless buying volume increases significantly and this area turns out to be a fakeout.
ETH updateIF you remember this:
Current chart show prospective, not targets (sure they are), but step-by-step)
Good luck

Market update for EthereumThe price managed to hold above the weekly pivot point, triggering growth according to the bullish (green) scenario. At this point, the price has reached the first two targets and set a new local high. However, it is now in a resistance zone, and only 4% remains before breaking a key level.
If the 4,116 level is broken, the path toward 4,600 will open, potentially leading to a new ATH. But if the price breaks below 3,736 , the bearish (orange) scenario is likely to play out, and the price may start to decline.

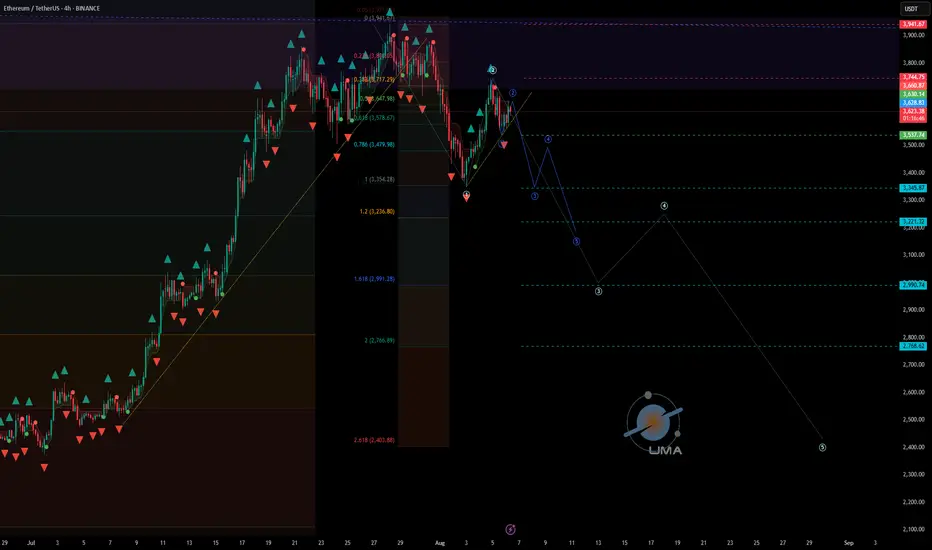
ETHUSDT - UniverseMetta - Analysis#ETHUSDT - UniverseMetta - Analysis
Potential reversal & correction setup in progress
📆 W1 – Weekly Timeframe
🔹 Price is testing a major monthly resistance zone, from which price has previously rejected toward the lower edge of a large triangle structure
🔹 According to the 3-wave structure, ETH has reached 161% of Wave 1 and closed above the 200% Fibo level
🔹 If the price fails to make a new high this week, a top fractal may form — a possible signal for a medium-term correction
📉 D1 – Daily Timeframe
🔹 A double top pattern is forming, along with a potential retest of the trendline
🔹 If confirmed, this could trigger a 3-wave correction structure downward
🔹 A downward fractal is already printed — adding confluence to the bearish scenario
🎯 Correction targets:
• $3,242
• $2,546
⏳ H4 – 4H Timeframe
🔹 Current price action suggests a correction from the recent impulse
🔹 A 3rd wave may initiate upon trendline breakout
🔹 Entry confirmation may come from breakout + retest, or via confirmed double top structure
🔹 Stop should be placed above the high of Wave 1 (H4)
🎯 Trade Setup:
Entry: 0.64930
TP: 0.65404 - 0.65700 - 0.66164 - 0.66676
Stop: 0.64482
‼️ Risk should not exceed 1–3% of your portfolio
This signal/idea is not financial advice
📌 Key Fundamental Triggers to Watch:
🔹 Federal Reserve expectations – a dovish shift could support ETH short-term, but failure to materialize may drive a pullback
🔹 ETH ETF news – updates on applications, approvals, and volume flows can significantly impact sentiment
🔹 Correlation with NASDAQ/S&P500 – weakness in equities could drag crypto lower
🔹 On-chain activity – declining gas usage or demand may indicate lower network utility and bearish pressure
🔹 Weekly overbought condition – many technical indicators (RSI, MACD) point to overextension

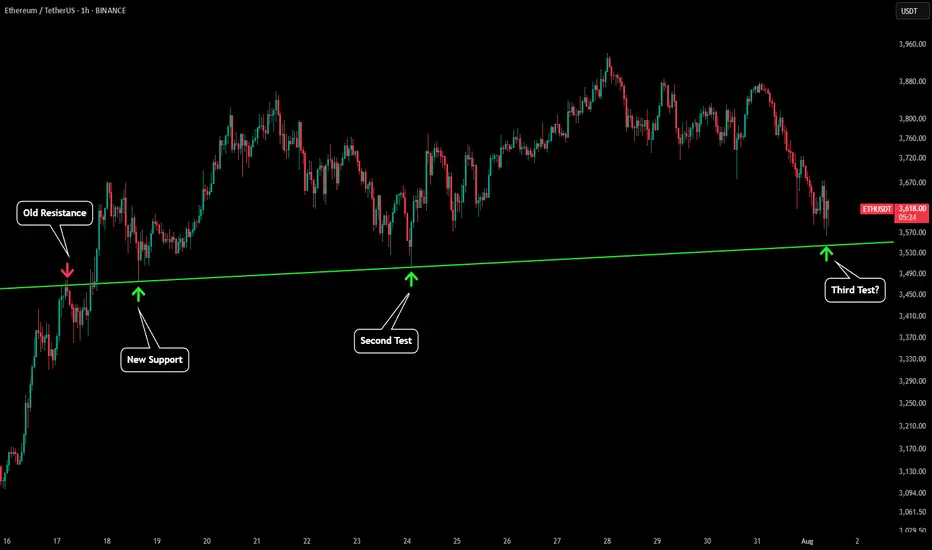
ETH - Still Respecting Important LinesPlease refer to our previous post:
Eth looks to be going for a third test of our green trendline. This would price around $3,550 which is also the 1D 21 MA. Therefore continuing to close daily candles above that price level will keep the uptrend in tact.
Ethereum Technical Analysis | August 8, 2025📊 Ethereum Technical Analysis | August 8, 2025
Ethereum has shown a strong bullish reaction after bouncing from the key $3,893 support zone, confirming the move with a solid bullish candle. If this support holds and further bullish signals appear, the next upside targets will be:
$4,088
$4,140
And potentially $4,291.
🔻 However, if the $3,893 support fails and price closes below it, the next important support to watch is around $3,757, which could act as a barrier against deeper declines.
📌 Summary:
Holding above $3,893 keeps the bullish scenario alive for Ethereum, while losing this level may increase selling pressure. Mark these key levels on your chart to make more precise trading decisions.

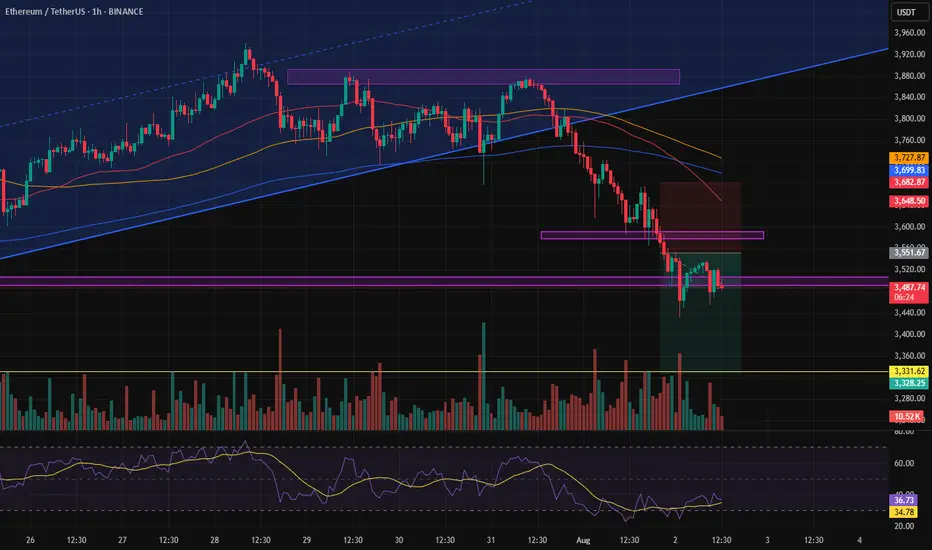
ETH/USDT Bearish Setup – Rising Wedge Breakdown & RetestEthereum (ETH/USDT) has broken down from a rising wedge — a classic bearish pattern — and is now showing signs of rejection after a clean retest of the broken trendline around $3,679.
Structure:
Rising wedge pattern on the higher timeframe
Breakdown confirmed with retest of lower trendline as resistance
No bullish follow-through after retest
Trade Plan:
Bias: Bearish below $3,680
Entry Zone: Anywhere below $3,670–3,680 if rejection is confirmed
Stop Loss: Above $3,720 (invalidation)
Targets:
Target 1: $3,298
Target 2: $2,880
Target 3: $2,640
Key Notes:
If ETH reclaims and holds above $3,680, the setup gets invalidated
Watch BTC behavior — ETH tends to follow
Volume shows no strength from bulls post-breakdown
This setup presents a high-risk, high-reward opportunity if the price continues to decline from this zone.
Conclusion:
Stay cautious, as the market could see more downside if ETH stays below $3,680. Manage risk accordingly.
DYOR | Not Financial Advice

Ethereum Long Trigger Just Got Valid — Don’t Miss This SetupHey, it’s Skeptic from Skeptic Lab.
In this breakdown, we’re looking at a fresh long opportunity on Ethereum after a clean 45% move from our last trigger.
I’ll walk you through the daily and 4H timeframes, explain why the correction looks weak, and where the next breakout trigger is setting up.
Plus, I’ll show you how ETHBTC can help confirm the move and improve your risk/reward.
If this gave you clarity or value, give it a boost — and I’ll catch you in the next one.
Disclaimer: This is not financial advice. Always do your own research before making any trading decisions.

Eth / UsdtBINANCE:ETHUSDT
### 📈 **Ethereum (ETH/USDT) Update – Technical Snapshot**
💵 **Current Price:** \~\$3,490
🔺 **Intraday High:** \$3,670 | 🔻 Low: \$3,453
---
### 🧱 **Support Zones**
✅ **\$3,500–\$3,600** → Key short-term demand zone
✅ **\$3,000–\$3,200** → Strong mid-term cushion
✅ **\$2,000–\$2,500** → Long-term on-chain investor base
⚠️ **\$2,120** → If broken, risk accelerates toward \$2,000
---
### 📉 **Resistance Zones**
🚫 **\$3,860–\$3,900** → Breakout zone = Bullish confirmation
🚫 **\$4,100–\$4,500** → Major zone with historic pressure
🚀 **\$5,000–\$5,300+** → ATH targets if macro + ETF narrative holds
---
### 📊 **Strategy Overview:**
| 🧭 Scenario | 📌 Strategy |
| ------------------------ | --------------------------------------------------------------- |
| ✅ **Bullish Bias** | Hold above \$3,600 → eyes on \$3,900–\$4,000 next |
| 💥 **Breakout Play** | Clean break above \$4,500 = open skies toward \$5,000–\$5,300+ |
| 🧯 **Bearish Risk** | Below \$3,500 could revisit \$3,000 or \$2,500 support bands |
| ⛔ **Critical Breakdown** | Breach under \$2,120 = watch for strong downside toward \$2,000 |
---
### 🧠 **Final Thoughts**
ETH is in **consolidation near highs**.
• Volume & ETF inflows are key catalysts
• Indicators like **RSI, MACD, Fib zones** can help confirm setups
---
⚠️ **Disclaimer:** Not financial advice. Always **DYOR** and manage your risk wisely. 🧠📉

#ETH Update #6 – Aug 02, 2025#ETH Update #6 – Aug 02, 2025
Although Ethereum may seem like it has dropped significantly, it still hasn’t completed the correction of its last impulsive move. If we are to say a proper correction is happening, Ethereum must pull back to the $3,300 zone. If it continues upward without reaching this level, the risk of a deeper retracement increases. That’s why it would be much healthier for Ethereum to extend this pullback and complete the correction around $3,300.
If this correction is completed, the next target will be around $4,450. There is also an imbalance zone around $3,300, and since the price is already close, it might aim to fill that as well — possibly even reaching down to the $3,200 level. Contrary to much of the current market sentiment, Ethereum is heading toward a correction in a very healthy manner, and I believe completing this move would be the best scenario.
