ETH/USDT Trade Setup: Bullish Trend, Entry Zone & More🚀 ETH/USDT Trade Setup 💸📊
Keeping a close eye on Ethereum paired with USDT right now. 🔍📈
ETH has been holding a solid bullish trend, with healthy pullbacks into value zones that have repeatedly offered discounted long entries. 🛒⚡
I’m bullish overall, looking to trade with the trend. Looking for ETH to dip into my preferred entry zone. 🎯
🛡️ Stop-loss to go just beneath the most recent swing low to keep risk tight and controlled.
In this video, I cover:
🔹 How I apply Fibonacci tools to dial in my entry points and targets
🔹 My full ETH game plan, including the zones I'm watching and how I’m managing this setup
⚠️ Not financial advice. Always do your own due diligence and risk management.
💬 Are you trading ETH right now? What are your thoughts? Let me know in the comments below! 👇🔥
ETHUSDT trade ideas

ETH/USDT 4HOUR CHART UPDATE !! ETH/USDT Chart Analysis
Ascending channel: Price is moving within a rising channel, with higher highs and higher lows, indicating bullish momentum.
Strong support area (~$2,600): Price repeatedly bounced off this level, reinforcing it as a key support zone.
Immediate resistance: Price is testing the upper boundary of the channel around $2,800–$2,850.
The 50-day MA (red) and 200-day MA (green) are trending upward, supporting the bullish structure.
A breakout above the channel’s resistance (above $2,800) could trigger a move toward $3,000–$3,200.
Failure at resistance might lead to a retest of support around $2,600, and a break below that could send the price back to the yellow zone (~$2,200).
Conclusion:
Bullish above $2,600, especially if $2,800–$2,850 is cleared with volume.
Bearish risk if price breaks below the channel, especially under $2,600.
Thanks for your support!
DYOR. NFA

ETH Market AnalysisETH has been consolidating for 19 days and 17 hours within the price range of 2,268.67 USDT to 2,738.54 USDT . Today, ETH broke the Weak Swing High , resulting in a Break of Structure (BOS) . Currently, ETH has reached the Daily Supply Zone at 2,746.00 USDT to 2,859.79 USDT . If ETH successfully breaks above this level, it could trigger a significant bullish momentum—potentially leading altcoins into a strong rally .
Note: Only ETH will drive the altcoin season .

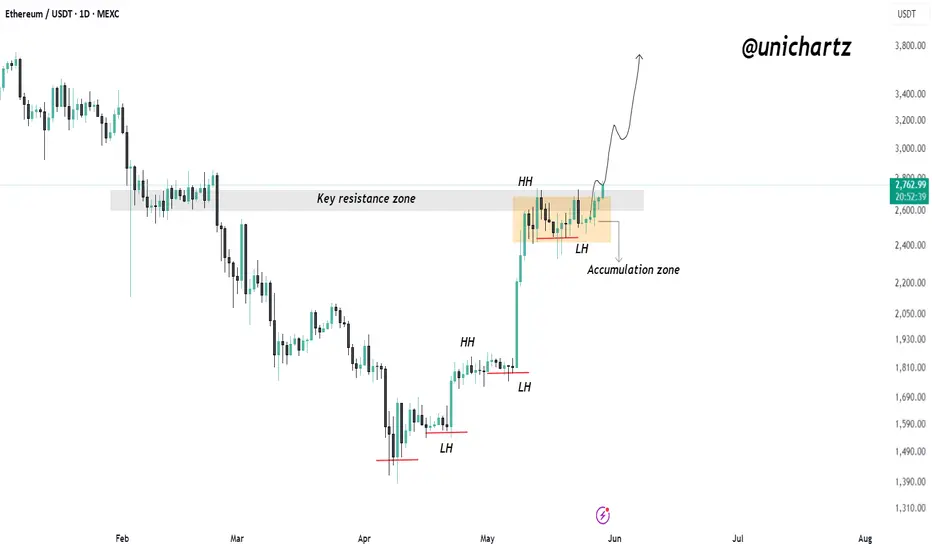
ETHUSDT Bullish Structure Intact: Higher Highs Continue#ETHUSDT – 1D Chart
Ethereum is in a strong uptrend, consistently forming higher highs (HH) and higher lows (LH).
Price recently broke above a key resistance zone after consolidating in an accumulation range. This breakout confirms bullish strength.
If ETH holds above this zone, we could see a continuation move to the upside in the coming days.
Structure remains bullish — trend is intact.
Ethereum Ethereum has rebounded significantly and needs a short respite. We are currently trading at a strong resistance level and experiencing strong selling pressure at the 2700 area. The correction will end at 2435/2335.

Ethereum 8X Leveraged Trade OpportunityIf you want to make it big really fast, there is still one last chance to get ETHUSDT with a great entry price and high lev.
The chart setup is good. The market is good and everything is great.
Market conditions are only improving and the Altcoins are starting to heat up.
Right now, you see $1,600 but tomorrow the price can be $1,800 or more, that's how the Altcoins work. One day everything is quiet, the next day everything blows up. By the time the action is in, it is too late to buy, but not now, there is still one final chance to get bottom prices before the 2025 bull market shows up in full force.
Here is Ethereum, ETHUSDT, a great chart setup. Once the breakout happens, it will never trade at this price ever again. This is the last chance. It is yours to take.
Thanks a lot for your continued support.
I am wishing you profits, health, wealth and success.
You are appreciated, always, and you deserve the best.
Namaste.

Ethereum 6X Lev. Full PREMIUM Trade-Numbers —2nd Entry—PP: 1806%This is a second entry for a long-term leveraged chart setup for ETHUSDT (Ether).
This is truly the last chance to get Ethereum at low prices before a major bullish impulse, the biggest one in a long time.
The chart structure is perfect. The low conditions look very similar to June 2022, very similar.
We have long-term higher lows blah blah blah... By now, you already know all these things as I read this chart a million times.
I don't have much to say other than remain calm, whatever happens. Sleep easy because Crypto is going up. It is as simple as that. It will grow, soon.
Full trade-numbers below:
_____
LONG ETHUSDT
Leverage: 6X
Entry levels:
1) $1,900
2) $1,825
3) $1,630
Targets:
1) $2,125
2) $2,405
3) $3,347
4) $4,017
5) $4,871
6) $6,000
7) $7,337
Stop-loss:
Close weekly below $1,600
Potential profits: 1806%
Capital allocation: 3%
_____
I would like to thank you again for reading. Your support is appreciated.
I know it is a lot of content but this is meant for many different people all across the world.
If you like what you see make sure to follow.
If you want to see more, leave a comment and boost to show your support.
This is the big one.
Namaste.

Ethereum 6X Lev. Full PREMIUM Trade-Numbers (PP: 3,198%)Ether (Ethereum's token) just set a long-term higher low. The main low happened in June 2022 and the higher low now, April 2025.
Ok, let's make a pause. Before going into the chart details and technicals, let me say that this is a high probability trade setup. If you've been following for a year or more, you know what this means. This is a win.
Ethereum is set to grow and this growth will happen based on the long-term.
The numbers below can produce a huge reward with relatively low risk.
This is for advanced traders only. You need to be able to adapt to market conditions and have some experience before your decide to trade. If you are certain and you are a responsible adult; Welcome, I am wishing you tons of success.
The market gives and the market takes.
The market is set up now to give and it will give us big, big wins. These wins are here for you, if you have what it takes.
Full trade-numbers below:
____
LONG ETHUSDT
Leverage: 6X
Entry levels:
1) $1,650
2) $1,500
3) $1,450
Targets:
1) $2,125
2) $2,405
3) $3,347
4) $4,017
5) $4,871
6) $6,000
7) $7,337
8) $8,861
9) $9,947
Stop-loss:
Close monthly below $1,380
Potential profits: 3198%
Capital allocation: 5%
____
Thanks for reading and for your continued support.
I am wishing you health, wealth, success and love.
Thanks for the follow.
Thanks for the comments.
Thanks for all these years of sharing, discussions and personal growth.
Let's continue together long-term.
We are only getting started.
Namaste.

eth/usdtHello, this is my daily analysis for Ethereum and I think we are in the best place on the chart and we can have an upward trend. What do you think, friend?

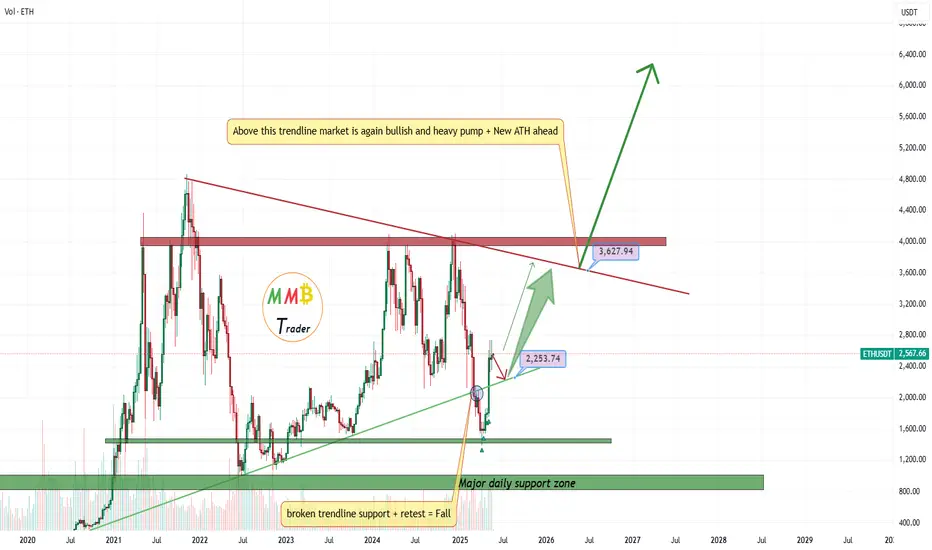
ETHUSDT still sleep but soon will break the NewsETHUSDT this time will touch new ATH with Bitcoin pump not like previous time sleep price is still weak but first resistance is broken and soon will pump above 3000$ and the journey will start there and huge pump will lead ASAP.
DISCLAIMER: ((trade based on your own decision))
<<press like👍 if you enjoy💚
ETHEREUM - ETH - Crypto - Buy IdeaETH forms an ascending triangle near a key resistance zone, indicating potential bullish continuation. A breakout above this range could trigger a rally towards the next major resistance at $3380. The RSI is holding above 65, showing strong bullish momentum. A breakout from the triangle with strong volume may confirm the bullish setup.

short ETHETH bounced off the resistance level. Bearish movement to support level at $2356 is expetced to happen

ETHUSDTEth on weekly chart.
i saw more selling coming than buying, though we are expecting alt coin to go bulish, but if eth failed to go bulish we shldnt exxpect any other coin to be bulish as well. the altcoin season is likely to happen may coming year

ETHusdtas we are expecting alt season, i always make use of eth as number one alt as case study, in which i dont see any clear sign that we are going to enter alt season any moment from now. this is weekly chart, i want to see price reaction around that zone . but i have sell bias instead of buy bias for now

Ethereum (ETH): Buyers Going For Second AttemptBuyers failed to form a proper breakout the first time on Ethereum, while currently we are seeing another buyside volume accumulation happening.
While we have a smaller long position open on ETH, we would suggest waiting for a proper breakout before going long here, as once we see a breakout, we might be seeing very good upward movement toward $3000.
Swallow Academy

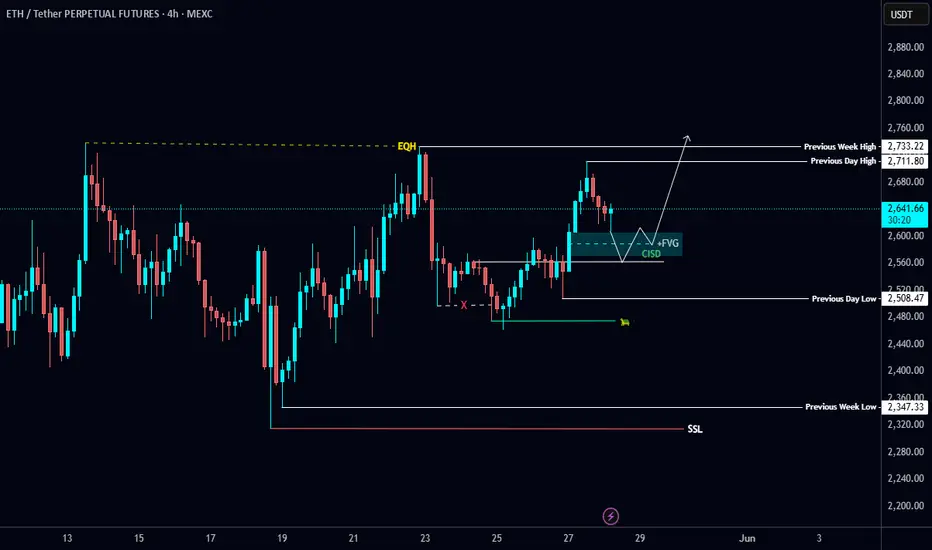
$ETH Long Setup Loading📈 CRYPTOCAP:ETH Long Setup Loading 📈
#ETH swept liquidity and printed a CISD just below the 4H FVG 🎯
That level lines up with a POC + demand zone — prime spot to hunt a new long 🔍
Let it come to you, plan the entry 💼