ETH Daily: Lower High, Lower Low. That Was My Signal
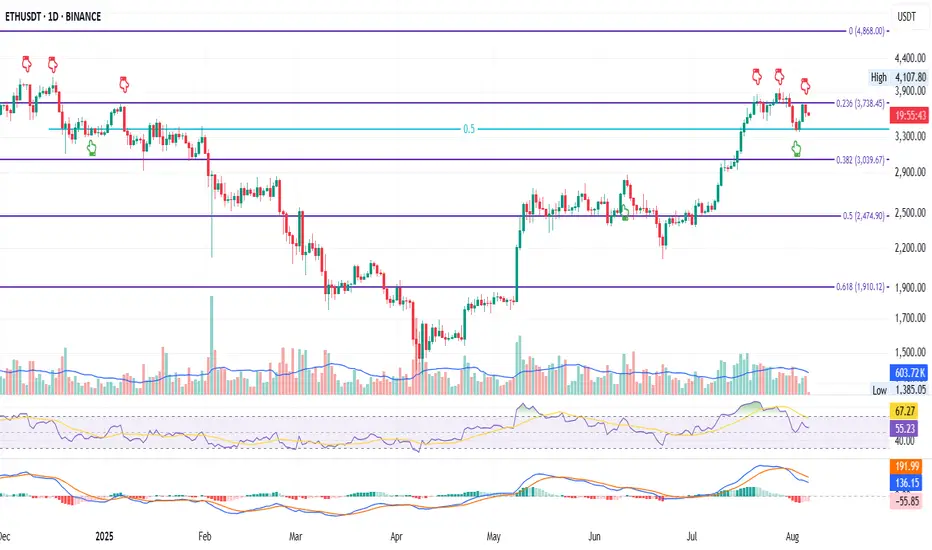
This is ETH on the Daily
Price action today looks very similar to December 2024.
Back then, ETH attempted twice to flip the 0.236 Fib level at $3378.45 — first on Dec 6, then on Dec 12. Both failed. Price found support at the 0.5 (midpoint between the 0.236 and 0.382), bounced, got rejected again at the 0.236, then went lower.
Now, we’re seeing a near-identical pattern:
– First attempt to reclaim the 0.236 Fib on July 21
– Second attempt on July 27
– Both failed
– Price found support again at the 0.5 middle level
– Bounced back to the 0.236
– Got rejected again
What will happen this time?
For me, the answer already came: we’ve now seen a lower low followed by a lower high — a temporary break of bullish structure. That’s my cue to scale out of my long and reduce exposure so I’m not caught off guard overnight.
Now that I’ve done that, I can observe the chart objectively without emotional bias or panic-selling.
Technically, ETH is in a short-term downtrend.
Fundamentally, however, I believe we’re in the early stages of a larger uptrend, driven by strong bullish news around crypto (happy to list them if you're curious).
But until those bullish narratives start kicking in and price moves up again, I have to be extremely careful not to get wiped out — so I’ll stay closely aligned with price action.
Like I said: short-term downtrend, long-term opportunity.
Always take profits and manage risk.
Interaction is welcome.
ETHUSDT trade ideas
#eth idea of short im already in it dyoreth/usd idea of short im already in it DYOR
wht im seeing eth give potentially much gains in this quarter
so its time to fill the remaining below and fullfill them
well im not financial advisor but here u can see to other dimention of digital silver

Ethereum is approaching the key level ┆ HolderStatKUCOIN:ETHUSDT is consolidating between $3,368 and $3,866 following a strong impulse move. Sideways range formation and trendline support hint at bullish continuation. Breakout above $3,866 may resume the upward trend toward new highs.

eth sell midterm "🌟 Welcome to Golden Candle! 🌟
We're a team of 📈 passionate traders 📉 who love sharing our 🔍 technical analysis insights 🔎 with the TradingView community. 🌎
Our goal is to provide 💡 valuable perspectives 💡 on market trends and patterns, but 🚫 please note that our analyses are not intended as buy or sell recommendations. 🚫
Instead, they reflect our own 💭 personal attitudes and thoughts. 💭
Follow along and 📚 learn 📚 from our analyses! 📊💡"

Ethereum Technical Update: $3,750 Target with $3,000 Correction Ethereum could rise to $3,750, and the correction may continue down to $3,000 by the end of August.
ETH | Short | 3hrs This technical analysis is for informational and educational purposes only. It does not constitute financial advice. Remember to always research and consult with a professional before making investment decisions. Good luck! 📈💼🚀

Should we expect Ethereum price growth?Ethereum is moving back towards $4,000 after the pull-back I said earlier. Will this level finally be broken and the queen of crypto will move towards $5,000? I think it depends on many parameters. There is news that money is flowing into altcoins. If the $4000 level is broken with strong volume, we should expect good news for this popular digital currency.

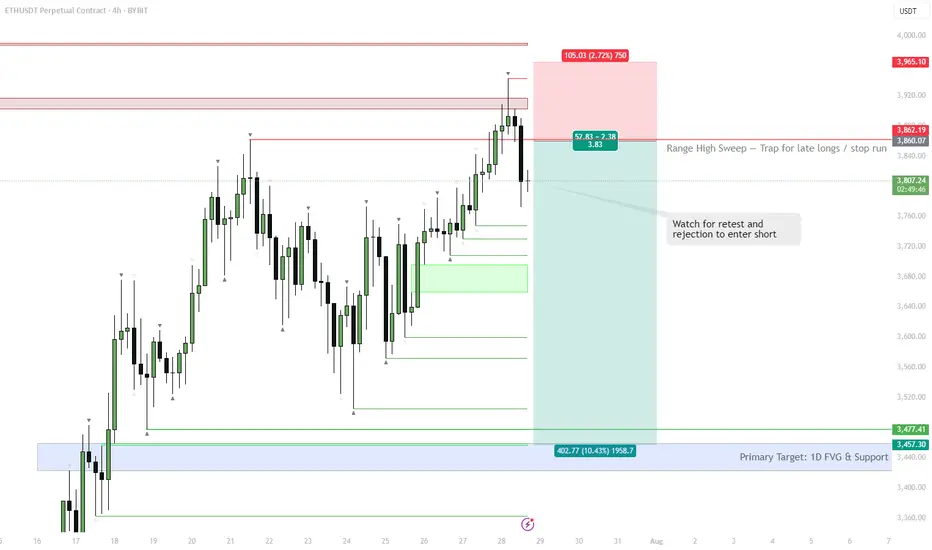
ETH | #4h #short — Range High Sweep & Short SetupScenario:
ETH swept the range high at $3,860, trapping late buyers and triggering stops. Watching for a retest of this level — if it holds as resistance and we see rejection, that’s a short trigger.
Target:
Main target is the 1D FVG at $3,457–$3,477. Possible extension: sweep of range low if selling accelerates.
Why:
Failed breakout setups are classic mean reversion triggers, especially when supported by a visible liquidity pool (FVG) below.
Plan:
Wait for a retest and rejection to confirm short. Partial TP at the FVG zone, manage risk above the sweep high.
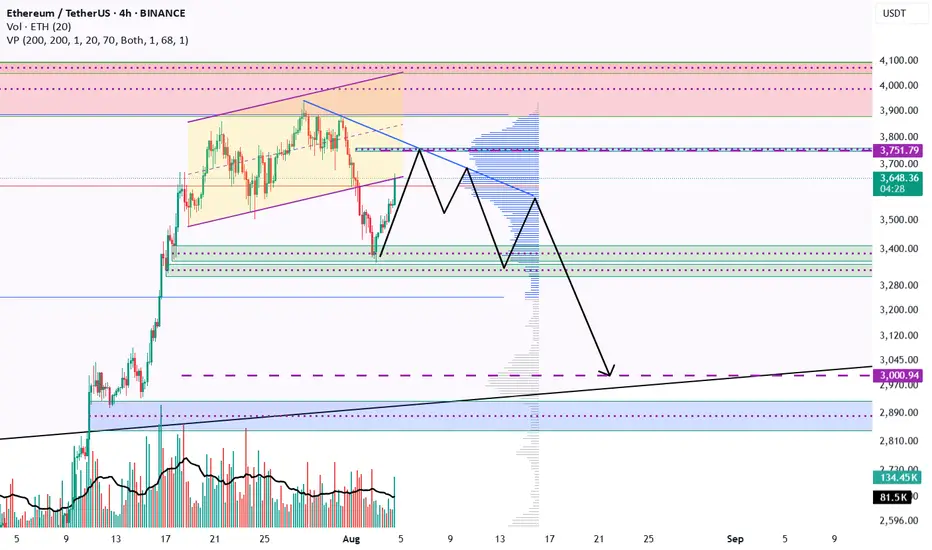
Ethereum Quick Outlook – Potential Trap Before Drop?ETH is moving within a rising channel, but momentum is fading. Price failed to break above the midline and is now testing lower support.
A fakeout to the upside toward the $4,015–$4,050 supply zone is possible before a deeper drop. The projected path suggests a short-term bounce, final liquidity sweep, then potential reversal.
🟡 Key Resistance: $4,015
🔻 Breakdown trigger: Below $3,620
🎯 Bearish Targets: $3,250 → $3,100
Structure hints at a possible Ending Diagonal (Neowave), or a Trap-Wave E inside a Complex Correction.
⚠️ Watch for manipulation near highs – confirmation needed for short entry.

ETH – Possible Pullback After Sharp Rally | Watching Buy ZoneAfter a strong breakout toward the 4014 USDT area on ETH/USDT, we might be seeing signs of a local top forming. Based on technical analysis, I’m watching for a potential pullback to the support zone around 3447 USDT, which is where I’ve placed a Buy limit order.
Key levels:
Sell zone: 4000–4100 USDT (already reached) SELL NOW
Buy zone: around 3447 USDT (waiting for possible dip)
Strategy: Buy the dip and prepare to sell on the next upward move
🔁 Repeating the cycle: Buy low – Sell high
⚠️ This is not financial advice – just my personal market view.
Let me know in the comments if you’re watching similar levels or using the same kind of strategy.
Trade active
Trade was activated
ETH Important Update 08.08.2025🚀 #ETH Update 🚀
This is the third attempt on the major timeframe for ETH to break through this yellow resistance zone. 📊
I strongly believe that this time ETH has a high chance to break it.
📌 Possible Scenario:
* ETH pushes up to this zone
* Small retracement 🔄
* Then a strong breakout 💥
We’ll monitor closely to catch the move.
⚡ Important Point:
If ETH starts retracing while:
1️⃣ Bitcoin stays in range
2️⃣ Bitcoin dominance drops 📉
➡️ Then we could see a solid rally in TOTAL3 (altcoins excluding ETH) — meaning a lot of altcoins will have good upside potential.
💡 Be prepared with liquidity — opportunities don’t wait! Insha’Allah, we’ll ride this wave together. 🌊
🔥 Stay focused. Stay ready. This could be the moment the market wakes up!

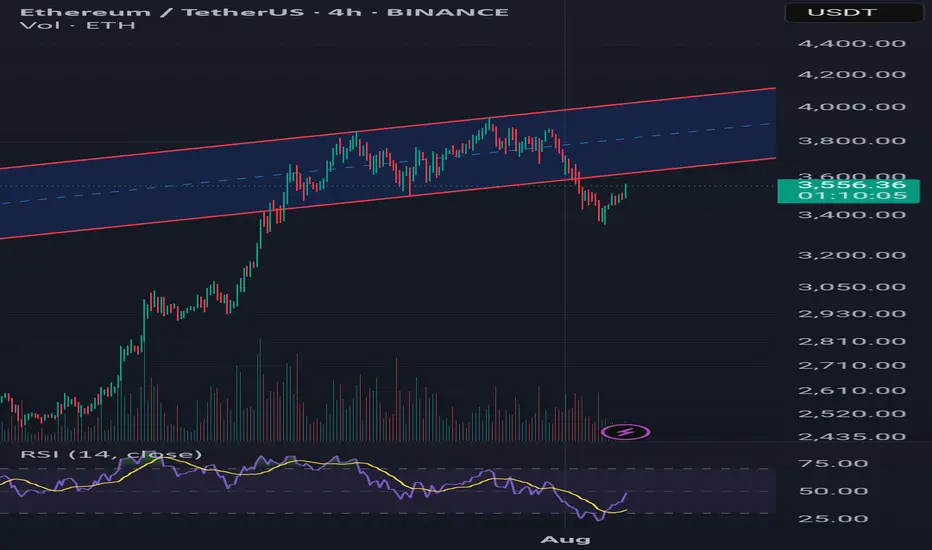
Ethereum at Critical Retest – Pullback or Breakout?Ethereum saw a sharp rally followed by a steady climb inside a rising channel. Recently, price broke below the channel’s lower boundary, signaling potential weakness. Now, ETH is retesting the broken trendline, which could be a classic pullback scenario.
Scenario 1 – Bearish Continuation:
If ETH fails to reclaim the channel and rejects around $3,600–$3,650, selling pressure may return.
Potential targets: $3,400 → $3,250 and, in extension, $3,050.
RSI is recovering from oversold levels but still below midline, hinting at possible limited upside before another drop.
Scenario 2 – Bullish Reclaim:
A daily close above $3,650 with strong volume would invalidate the breakdown and suggest a false break.
In that case, ETH could re-enter the channel and aim for $3,850 and the upper boundary near $4,050.
Risk Management:
Bearish entry: Wait for rejection candle on retest → SL above $3,700.
Bullish entry: Wait for confirmed breakout above $3,650 with volume → SL below $3,550.
eth swing buy / long setup eth well bounced from weekly fvg, now it's heading towards 4.1k double top liquidity. wait for the entry and must use SL, If candle closes below sl on 1hr tf then close on entry, otherwise wick doesn't matter. Maybe eth take 3750 liquidity first then fly high.

Long here.Genius I know right.
I though I was special calling for a big drop on XPR and closed out a nice trade to start my week with my morning coffee here in NZ.
Of course I look at the rest of the market and see that the drop was clearly across the board. I don't feel as special, but still happy. And will be really happy if we are close to a support level on ETH after this 10% drop. I am already in long with some size and ready to average into a much bigger long position. This is where I am happy to not run close stops, size up without crazy leverage and let my liquidation point act as my stop. Very rarely, but this is a very good opportunity in my opinion. Just be mindful to have a plan if we go lower, but I think we will retrace back up to $1687 within the next couple of hours.

Combining a "cup and handle" pattern with a long position on ETHCombining a "cup and handle" pattern with a long position on ETH/USDT is a classic bullish technical analysis strategy. Let's break down what this pattern signifies and how to approach it for a long trade.
Understanding the Cup and Handle Pattern
The cup and handle is a bullish continuation pattern popularized by William J. O'Neil. It suggests a period of consolidation followed by a breakout to the upside, signaling a likely continuation of the prior uptrend.
Disclaimer: Technical analysis patterns like the cup and handle are tools, not guarantees. Always combine them with sound risk management and your overall trading strategy. Past performance is not indicative of future results.
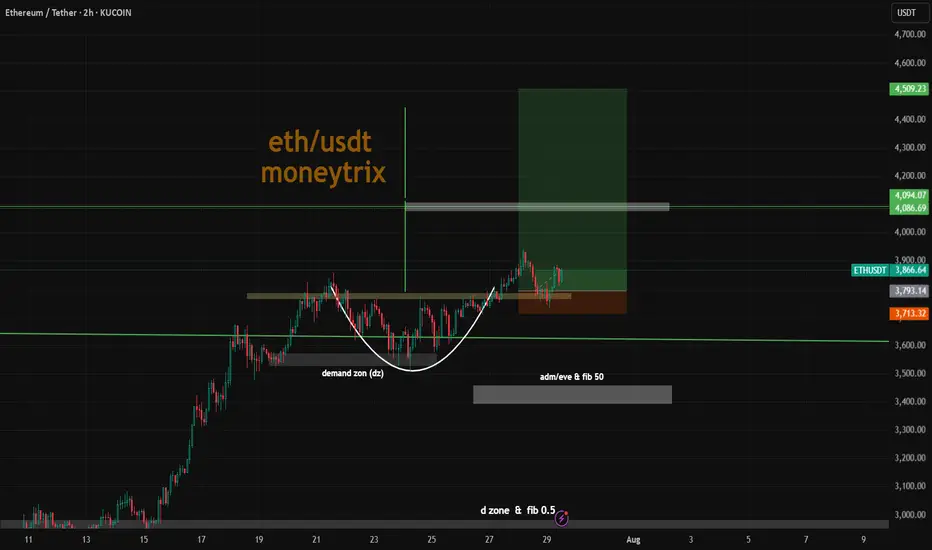
EtherumEth is in bullish trend
on 1D TF there was a bearsish divergeanc which create a correction
scrip has taken support from 0.5 fib level and bouncing back now.
apprently it is forming a flag pattern and it can hit target of 4500 soon.

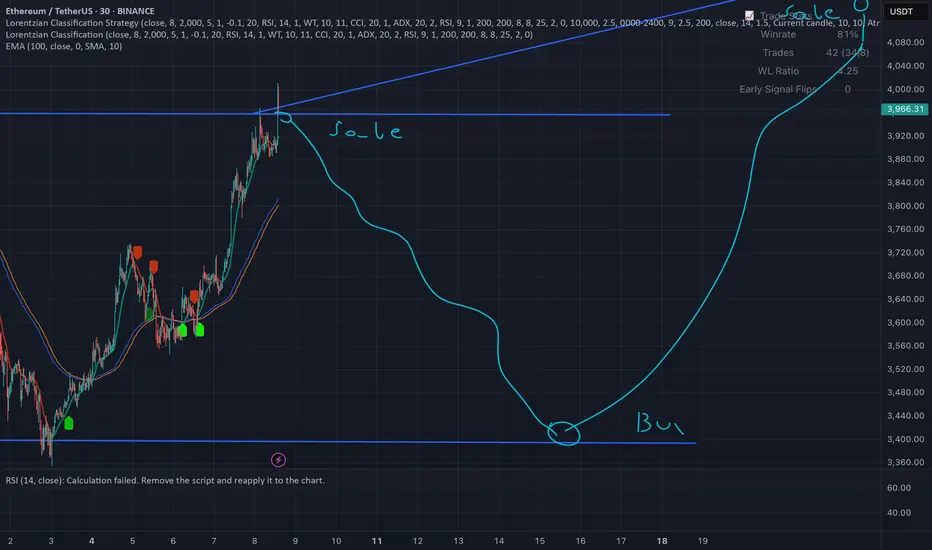
The Loudmouth Pattern: It Yells, We Trade!
On the 30-minute chart, ETH is forming a classic Broadening Formation – or as some traders like to call it, “The Big Mouth Pattern” 😄. It’s noisy, unpredictable at first glance, but when it speaks, you’d better listen.
Right now, price is moving through the bullish leg of this setup, and if momentum holds, we’re eyeing the $4,000 psychological level, followed by the $4,120 – $4,170 supply zone.
🔹 Bullish Scenario (our expected outlook):
🎯 Target 1: $4,000
🟩 Main Resistance: $4,120 – $4,170
❌ Invalidation: Confirmed close below $2,946
If price breaks and holds below that red support zone, this setup gets thrown out the window.
📊 Risk Management:
Scale in on pullbacks – if structure remains valid
No chasing without confirmation
Keep risk under 1% of total capital
📈 The market’s big mouth is open – and until it closes below $2,946, we’re listening for bullish signals. 🤑

ETHUSDT.PIf you look at the chart, you will notice an uptrend that has somewhat lost its strength and we may not be able to hit higher highs like the next strength in the next move.
Support: 3.660 - 3.590 - 3.160
Resistance: 3.900 - 4.260
Entry: 3.700
SL: 3.500
TP: 4.240
Please control risk management.⚠️

ETHUSDTConsidering Ethereum’s movement steps, 4320 is the end of Ethereum’s second leg. As big whales are adding to their holdings and there is a lot of optimism, we would expect to see higher numbers for Ethereum in the long term.

ETH NEXT MOVE AND BUY ZONE.1. Market Structure:
ETH/USDT broke previous structure highs (marked with X), confirming a bullish trend shift.
Price made a strong impulsive move upward after that break, forming higher highs and higher lows, indicating smart money accumulation.
2. Price Action & Current Retracement:
After forming a recent peak near $3,950, ETH entered into a retracement.
The retracement is currently holding above key liquidity and demand zones, showing signs of healthy correction rather than reversal.
3. Liquidity Grab – Sell-Side Liquidity (SSL):
There is Sell-Side Liquidity (SSL) resting below $3,700, which has not yet been taken out.
Smart money often targets such liquidity before initiating a new leg up — this makes SSL a potential magnet for price.
4. Fair Value Gap (FVG) + Demand Zone (POI):
Just below the SSL lies a confluence zone:
A clear Fair Value Gap (FVG) between approximately $3,680–$3,700, showing inefficiency in price.
A Demand Zone (POI) below that, between $3,640–$3,680, representing the origin of the bullish move that broke structure.
This zone provides high-probability support and a potential area of smart money re-entry.
5. Trade Setup Expectation:
Scenario: Price is likely to:
Sweep SSL below $3,700.
Tap into the FVG + Demand Zone.
Show bullish confirmation (like a bullish engulfing, Choch/BOS on lower timeframe).
Entry: After confirmation inside demand zone.
Stop Loss: Below demand zone (~$3,620).
Take Profit 1: Retest recent high at $3,950.
Take Profit 2: Extension toward $4,050–$4,100 based on higher timeframe targets.
✅
Summary:
ETH/USDT is in a bullish structure but currently pulling back. A sweep of sell-side liquidity (SSL) and a tap into the FVG + Demand Zone around $3,640–$3,700 is expected. After confirmation, it offers a high-probability long setup, aligning with smart money accumulation logic.

ETH(20250806) market analysis and operationAugust 6th ETH Contract Technical Analysis:
Today, the daily chart showed a small bullish candlestick pattern yesterday, with prices rising continuously. However, the accompanying indicator formed a death cross. Monday's gains were not followed by a significant pullback on Tuesday. Therefore, it is difficult for both upside and downside to continue, and the trend remains range-bound. Until a breakout occurs, maintain a short-term strategy of selling high and buying low. On the hourly chart, yesterday's US session continued the downward trend of the European session, correcting the current bearish candlestick pattern. The accompanying indicator formed a death cross with shrinking volume, suggesting a high probability of a pullback during the day. Focus on the upward pressure around the 3700 high.
Today's ETH Short-Term Contract Trading Strategy:
Buy on pullbacks to the 3590 area, with a stop loss at the 3560 area, and a target of the 3650 area. Sell on pullbacks to the 3670 area, with a stop loss at the 3701 area, and a target of the 3605 area.

Ethereum Above $4,000 Bullish Signal RevealsNo major drops and low volatility is a major bullish signal. Ether is bullish now with all sellers gone. Look at the down wave from December 2024 and see what three days red would do to Ethereum's price. Today we are on the third red day and ETH is hardly a few dollars below the most recent peak. A signal of strength. This strength also means that we are likely to see a continuation of the bullish move soon, Ether will continue growing.
Good morning my fellow Cryptocurrency trader, I hope you are having a wonderful day.
Everything seems calm now, a small pause... Sell at resistance, buy at support; right?
Well, not always. It depends on the context.
Here we have a rising trend and Ethereum has been advancing nicely. Now we reach resistance, is this the time to go SHORT? It is possible to SHORT at resistance and do good but here we have a very clear uptrend. When ETHUSDT peaked 28-July there wasn't much selling. This is telling us that the bullish move is not over, not complete.
Ethereum will produce additional growth. Seeing this, it would be unwise to sell SHORT. If prices drop, it is better to wait for support and go LONG. Trade with the trend, it reduces risk and increases your chances for success.
Namaste.

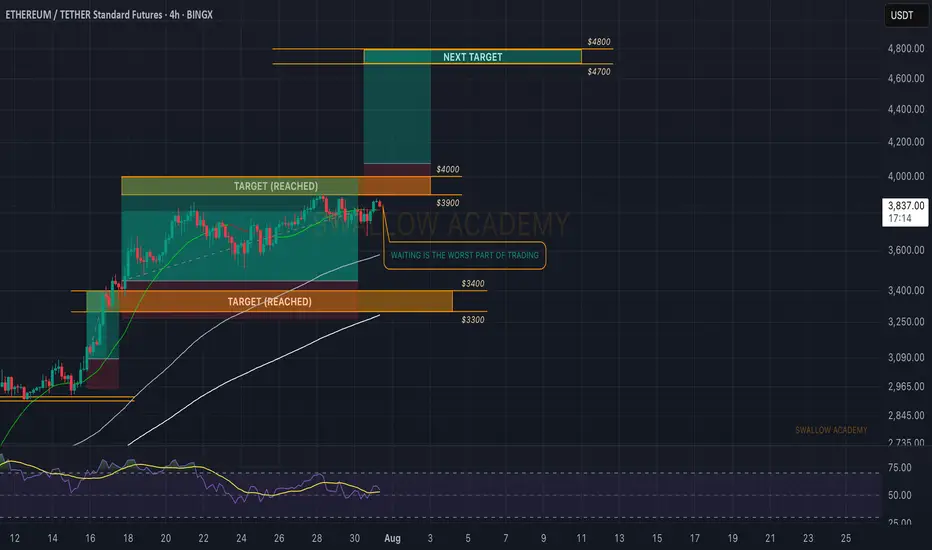
Ethereum (ETH): Waiting Is The Worst Part Of Trading | $4800ETH still looks good; we hit the target lately and now we are looking for the breakout to happen, which will give us another opportunity for a long position towards the $4800 zone.
Swallow Academy