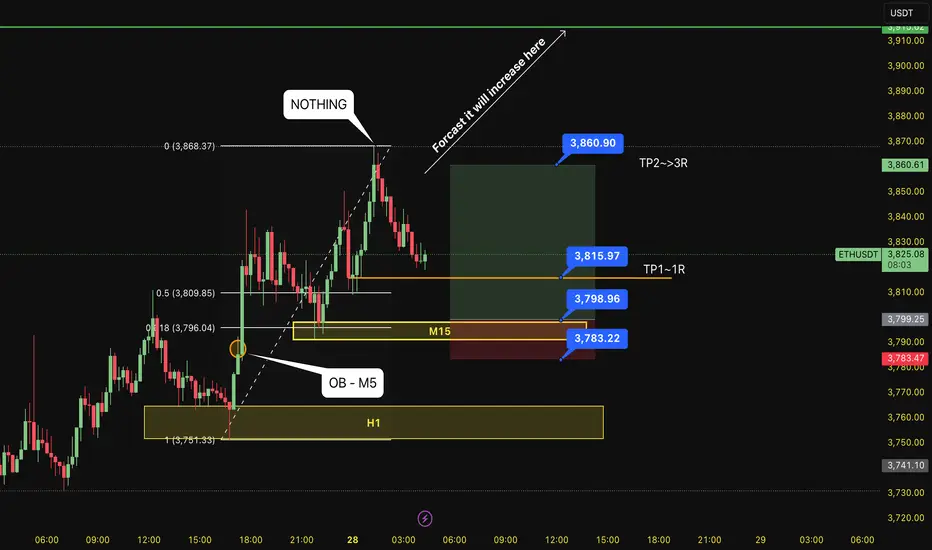
BUY ETH 28.7.2025Confluence order: BUY at M15
Type of order: Limit order
Reason:
- The current top is not touching anything, expected to rise to the H1 above.
- M15~FIBO 0,5-0,618 (same position)
Note:
- Management of money carefully at the last bottom (3,815)
Set up entry:
- Entry buy at 3,798
- SL at 3,783 (below OB NOT USED of M5)
- TP1: 3,815 (~1R)
- TP2: 3,860
Trading Method: Price action (No indicator, only trend and candles)
ETHUSDT trade ideas
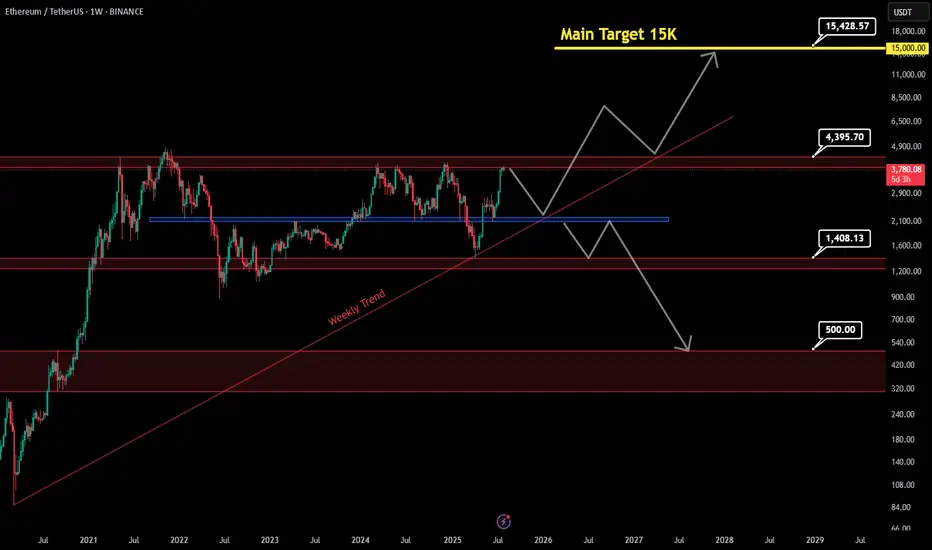
Ethereum to 15K ? or fall to 500$ !!📊 Ethereum – Long range outlook
If the price manages to break the red resistance zone above and hold above it, the path will be poised to reach the main target at $15,000, as shown by the rising arrows. If it fails, it has another opportunity to regroup buyers from the resistance at $2,228, with a very important trend that will support the upward move.
If the price fails to break the rebound from $2,227, closes this area ($2,227), and then breaks the weekly trend, we expect a sharp drop to $1,408 and even $500 in the long term.
Main Target : 15,000$
ETH Buy Idea📈 Setup Summary:
Ethereum (ETHUSD) is breaking out of a multi-week consolidation with rising volume and strong bullish momentum. Price has reclaimed key moving averages, and sentiment has shifted favorably across crypto markets.
📊 Entry & Risk:
• Entry Price: $3,860 - 3870
• Stop: $3,470
🧠 Macro Catalyst: Spot ETH ETFs Are Coming
• The SEC is reviewing multiple Ethereum Spot ETF applications from BlackRock, VanEck, ARK/21Shares, and others.
• Market expects approvals Q3–Q4 2025, mirroring the prior surge seen in BTC after IBIT and similar ETFs launched.
• A successful launch could unlock institutional ETH flows, driving significant upside.
🟢 Adding ETF tailwind to technical breakout = high-conviction swing trade.
🚀 Momentum Signals:
• RSI & MACD bullish cross on daily
• Increasing volume on breakout
• ETH outperforming BTC (ETHBTC ratio turning up)
• Crypto market as a whole showing risk-on tone
DISCLAIMER : The content and materials featured are for your information and education only and are not attended to address your particular personal requirements. The information does not constitute financial advice or recommendation and should not be considered as such. Risk Management is Your Shield! Always prioritise risk management. It’s your best defence against losses.

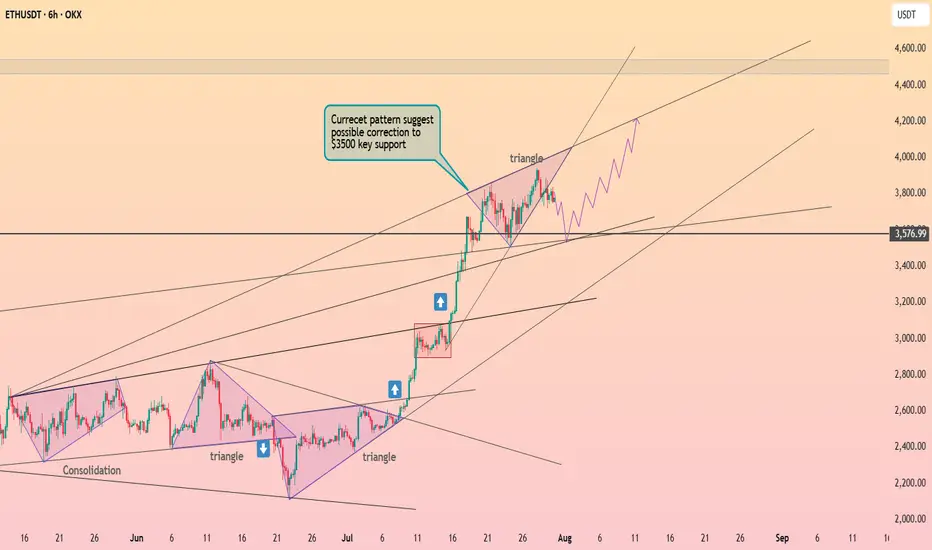
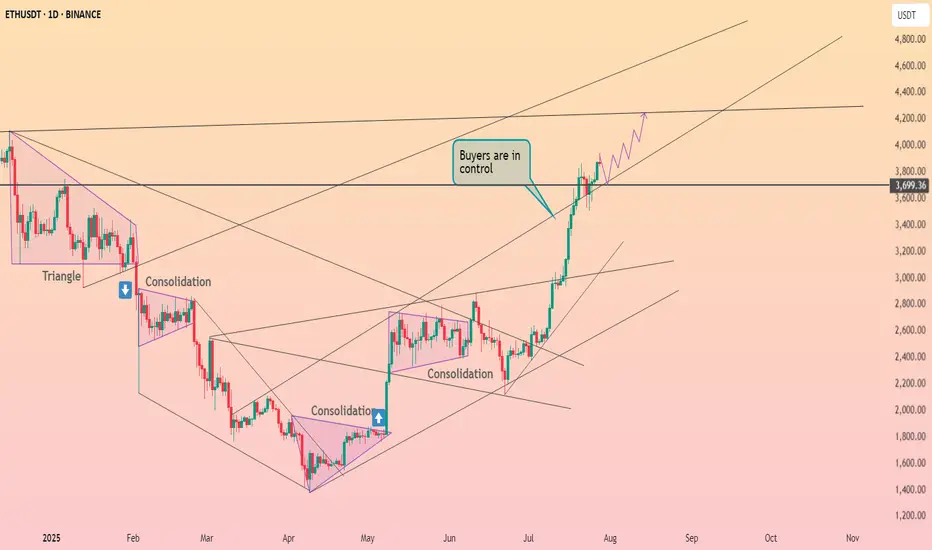
Ethereum is holding the $3700 level ┆ HolderStatOKX:ETHUSDT rallied from multiple triangle breakouts to test 4,400+ before pulling back. It’s now approaching key support at 3,576, which coincides with a major horizontal and trendline intersection. If this zone holds, the next leg up may target 4,600–4,800. Structure remains bullish above 3,500.
ETH is at a critical inflection pointETH 4H – Decision Time 🧠🐂🐻
Ethereum’s dancing on the edge of a blade.
📍 Entry: $3,778 (Short)
🧪 Next Add: Tiny at $3,906 (updated)
🚨 Major Add: Above $4,100 (TBD)
⚠️TP 1: $3,677 (updated)
We’ve broken the downtrend line — bullish on paper — but ETH is stalling right near resistance at $3,875. If bulls don’t show up with volume and conviction, this move fizzles out fast.
Here’s the playbook:
🔸 $3,875 = key battle zone
— Reclaim it clean (4H close + volume) = "short-term" bear bias invalid (◘reread◘)
— Failure = likely drop to $3,677 → $3,588
🔸 $3,720 = swing short confirmation if broken
🧩 If bulls win $3,875, I keep the short but hedge with a long. Because if the herd’s charging uphill, they might lead us to gra$$.
Momentum is king. No follow-through = fakeout top.
Let the chart breathe.
LOW LEVERAGE POR FAVOR!
Stay Sharp. Stay nimble. 🎯
100% not financial advice, for edutainment purposes only!

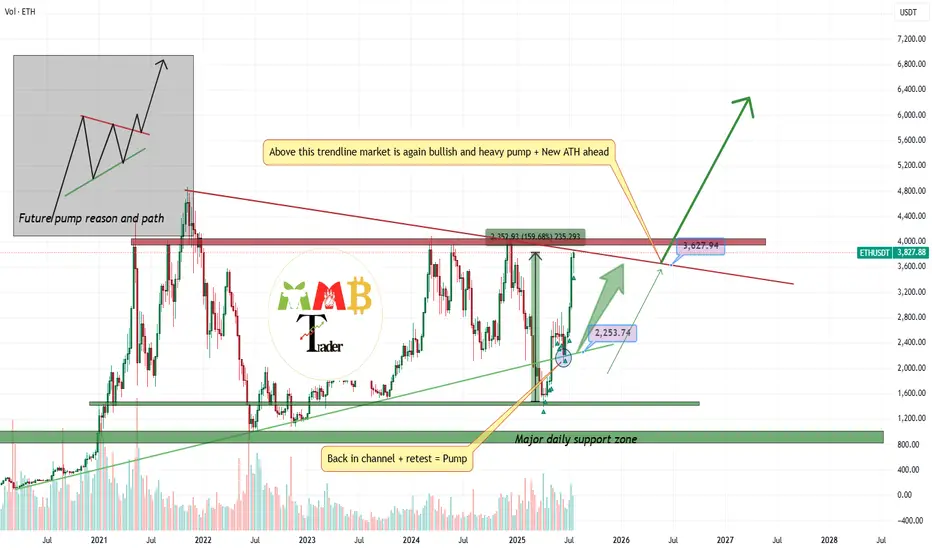
ETHUSDT market is ready to explode and PumpAs we mentioned before Price is now near weekly resistance and range and even short-term fall here is expected but this time i am looking for breakout to the upside and huge pump after that like the green arrows on chart.
So get ready and wait for that breakout and next phase of bull run to start soon.
DISCLAIMER: ((trade based on your own decision))
<<press like👍 if you enjoy💚
Bitcoin, Ethereum & Market Indexes
🔻 🚀 Bitcoin, Ethereum & Market Indexes 🔍
💎 HWC (1D) – MWC (4H) – LWC (1H) Cycle Analysis
⭕️ Structural Review: TOTAL, TOTAL2, TOTAL3, BTC.D, USDT.D
🔥 analysis Coins: BTC, ETH
📉 Strategy: Dow Theory + Fundamentals + Market Sentiment
🔥 Daily Market Analysis – July 31st 🔥
💎 Summary of Key News & Strategy:
✔️ Interest rates were officially held steady at 4.5% – as widely expected. However, Powell’s comments added slight bearish pressure to the market in the short term ❗️
✔️ It’s important to note: recent market growth happened with the same rate in place. So any positive economic news from the U.S. from now until September could trigger a Bitcoin pump 🚀
✔️ One major bullish catalyst: MicroStrategy purchased 21,000 BTC – a strong institutional support signal 💎
✔️ With the BTC monthly candle closing in a few hours, keep risk low and proceed with caution ❗️
✔️ if Volume is picking up in BTC and altcoin momentum is building. This opens up a strategic opportunity to enter long positions even before key breakouts in TOTAL, TOTAL2, and TOTAL3 🔥
♦️ BTC/USDT
Support 1: 115,000
Support 2: 111,000
Resistance: 120,000
Despite 2 days of bearish pressure, the overall BTC structure remains bullish
If the 120,000 level breaks with strong volume, we can use a stop-buy strategy to enter a long. Sellers managed to push down to 115,700, but buyers defended the level well.
⭕️ This volume near support can serve as early confirmation to enter altcoins.
🔥 Break of 120,000 is critical for sustained altcoin rallies.
♦️ BTC Dominance (BTC.D)
Watch for a breakout above 60.44 – if that happens, you should already be in altcoin positions 🔥
It still hasn’t broken the 62–62.36 zone, which remains supportive for altcoin strength ✅
♦️ TOTAL Market Cap
If we see signs of breaking 3.92, we should already be positioned 🔥
Key support: 3.71 – as long as the market holds above it, the long scenario remains valid 💎
♦️ TOTAL2
Open position should happen before a confirmed break of 1.54 ❗️
Waiting until after could lead to late and risky entries. Stay alert and responsive ✅
♦️ TOTAL3
Same logic – position before the 1.08 breakout. Entry afterward will be harder due to sharp candle and volatility ⭕️
♦️ USDT Dominance (USDT.D)
Currently attempting to break 4.40 but has not succeeded ❌ – this is good for buyers.
We should have long positions before any potential drop below 4.13 🔥
♦️ ETH / USDT
Buyers successfully defended the 3,750 support zone 💎
Given strong institutional interest, ETH has high bullish potential.
A break above 4,000 with powerful candles could kickstart the next bull run 🚀
✅ Early Entry Trigger: 3,858 – but only if ETH dips below this level first and returns back to it.
This gives us a tighter stop-loss and better risk/reward setup.
❌ If ETH blasts through 3,858 with a sharp candle, avoid chasing the move.
⭕️ Additional confirmations:
• ETH/BTC should break 0.3277 to confirm ETH strength
• ETH.D should break 12.16 for final validation
Most likely, ETH.D and ETH/BTC will give early confirmation before ETH/USDT breaks 3,858 ✔️
💥 If you found this helpful, don’t forget to FOLLOW and smash that 🚀 button for more daily insights! 💎
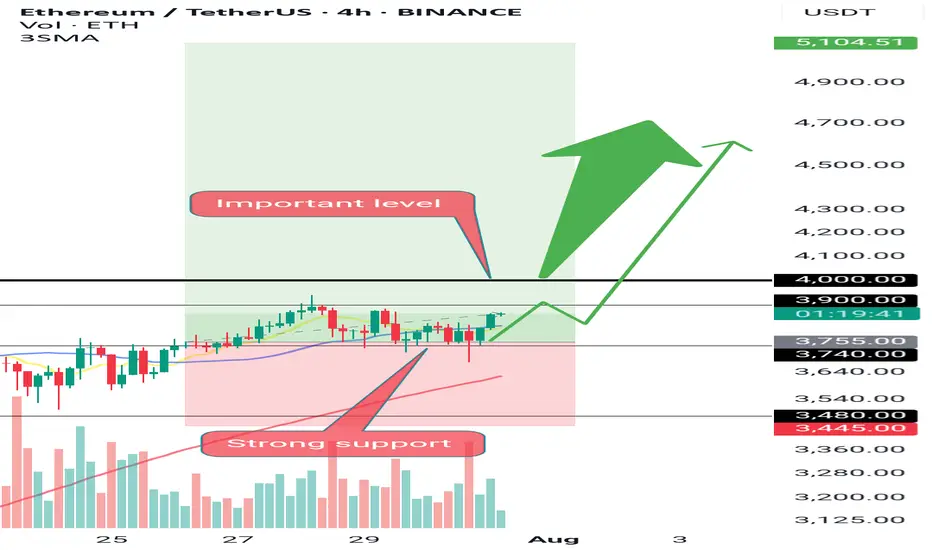
Ethereum (ETH): $4000 Incoming | Breakout or Rejection?Ethereum is not showing any remorse to sellers of the coin, and we are almost near the major resistance zone of $4000.
What we are looking for or expecting from here is either to get the proper breakout from this region or a rejection. As of now it is hard to say which one we will get so once we reach that resistance, we are going to look at further market structure development for any more signs.
Swallow Academy

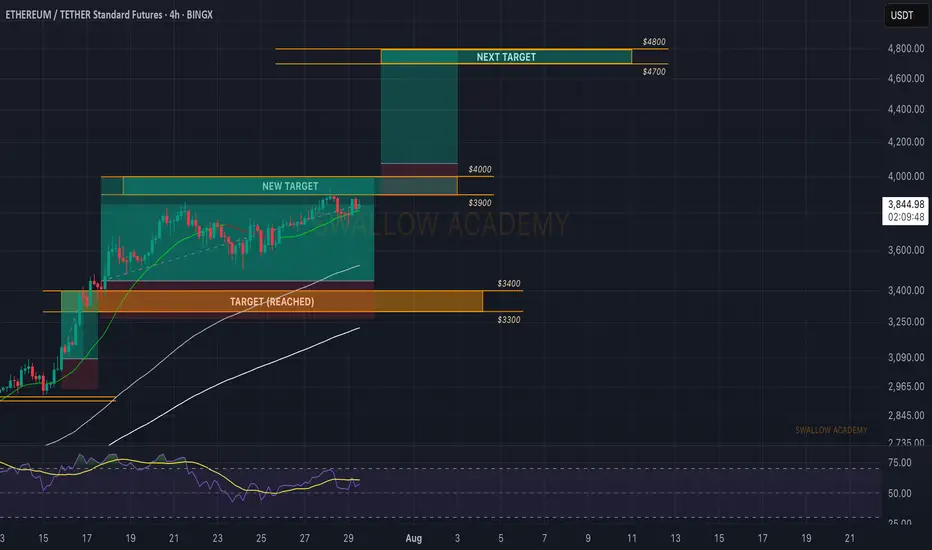
Ethereum (ETH): 2 Successful Trades | Targeting Now $4800Ethereum was so close to $4K that we considered it basically reading the target; now we set a new target and a new entry for us as well.
We are looking for a complete breakout to happen from the region of $4000, which then would open for us an opportunity for a bullish move towards the $4800.
Swallow Academy

ETH - Bounce Zones - Nears the End for BULLSHello Fello's ☕
I'm watching Ethereum today and I believe it may be very close to the end of it's bullish cycle.
I think what could become likely is an extended altseason, where Bitcoin trades around the same price for some time, and Ethereum increases slightly. Afterwhich smaller altcoins (by marketcap) make random rallies before the beginning of a bearish cycle (which is due, see my previous BTC update).
There's an interesting channel here that previously determined bounce zones... I don't believe the channel itself will hold as much value going down, but this zone may be a likely bounce zone - around $3k.
Key bounce zones to watch include:
I'm not saying it will be this straightforward, but this image demonstrates the power of bounce zones for swing trades:
Next update will be when we've lost the first support zone.
Until then!
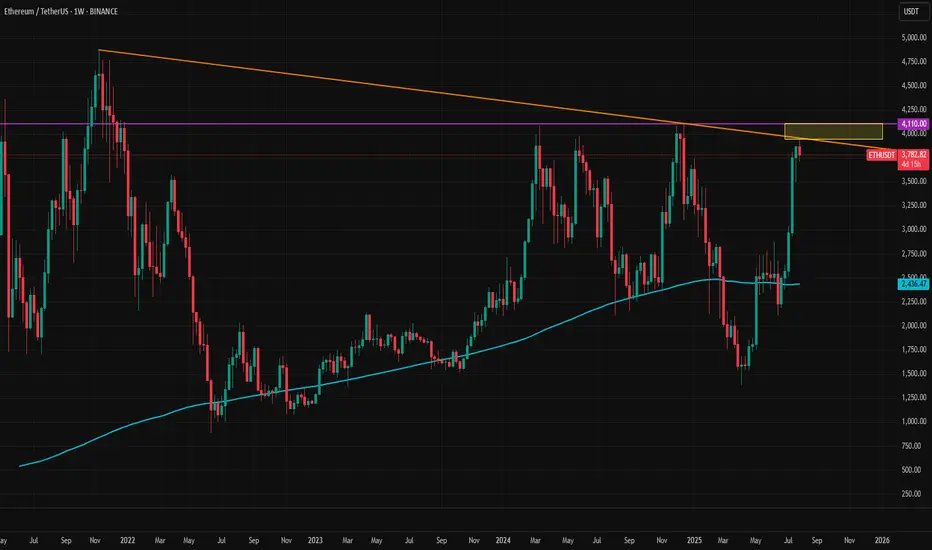
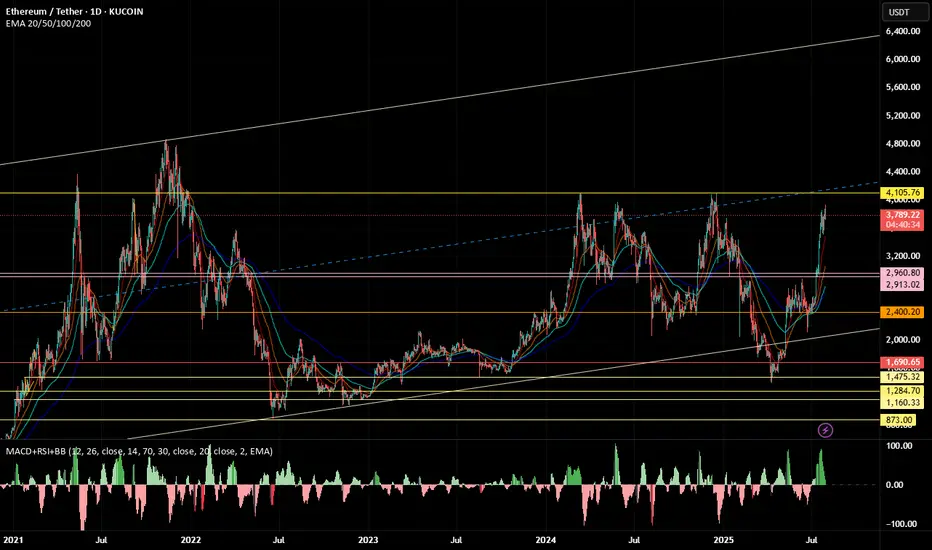
Ethereum Tests Key Long Term ResistanceEthereum continues to push higher, but a key resistance zone is causing a pause in the upward movement. Every day brings new positive developments for the crypto market, from ETF to tokenization news. This pattern reflects the typical progression of a crypto bull cycle. The latest SEC decision regarding a crypto-based ETF adds to the bullish backdrop.
However, a rising dollar index and a slowing momentum of U.S. stock market are having a short-term negative impact. Another reason for the current slowdown is the presence of massive resistance. The long-term trendline from the 2021 top, combined with the horizontal 4100 level, has formed a major resistance zone for Ether.
In the short term, ETHUSD may have formed another flag pattern. If it breaks to the upside, a retest of the 4100 resistance is possible. Today, dovishness level of Powell and the number of dissents in the rate-hold decision could significantly influence the price action.
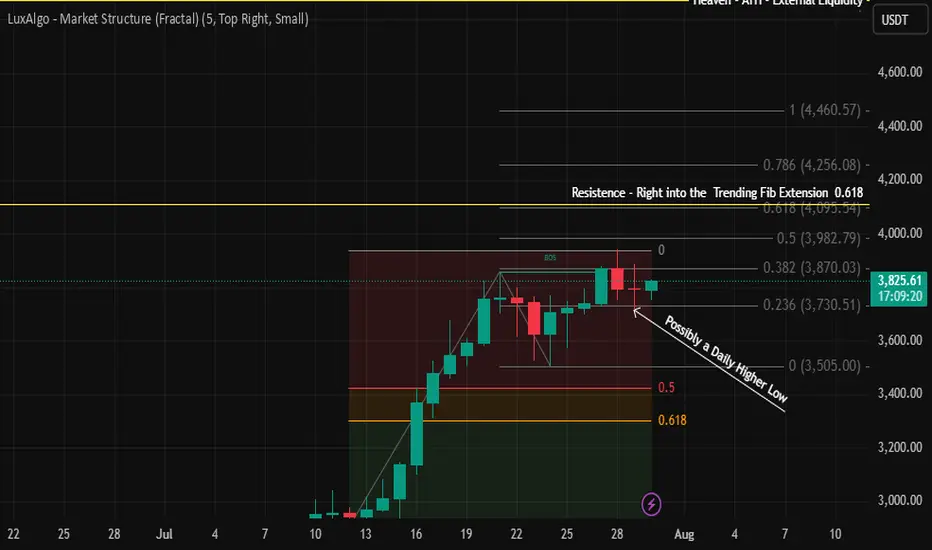
ETH to 4095 level this week??Next major resistence if it forms a daily higher low is right into the trend Fib ex .62.
Interesting to watch where ETH goes next.
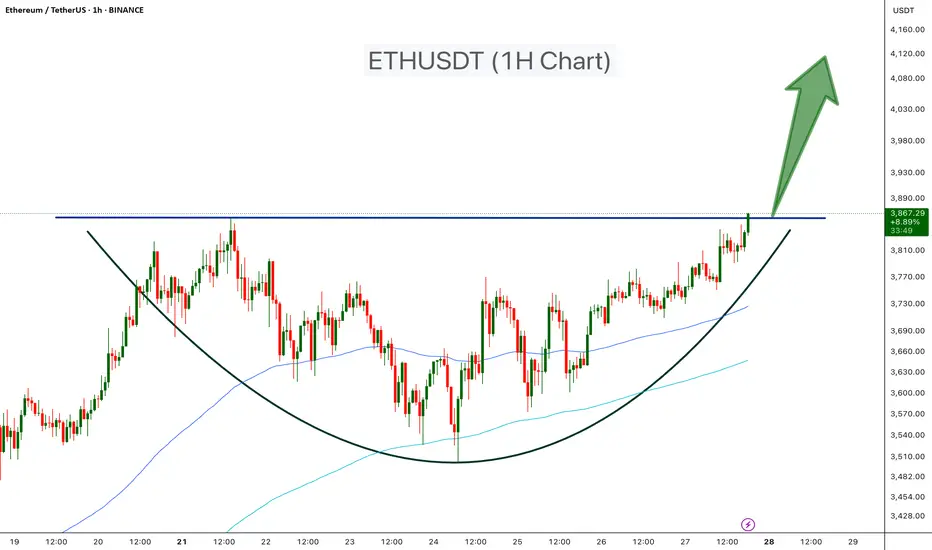
ETHUSDT Classic Cup PatternEthereum is forming a textbook Cup pattern on the 1H chart, signaling a strong bullish setup. After a rounded bottom forming the “cup,” ETH is now pushing toward the neckline resistance around $3,870. A confirmed breakout above this level could lead to a powerful upward move.
Cheers
Hexa
ethereumI think Ethereum is ready for a historic bull run, it has collected almost all the lower stops and has done everything right in terms of the right trend pattern. But from a fundamental perspective, with the arrival of President Trump and the launch of Ethereum ETFs, we can see a historic growth for Ethereum from a fundamental perspective, but we have to wait for the right pattern for the entry point. I will specify a few ranges for you, and my expectation is that Ethereum will be at $20,000.
ETH to $6500?Have had this chart created for a while since before 2020, now loading it back up looks like everything is going as planned. ETH has to reach its ATH again around 4800 then it shoots to prices discovery, it will forsure run through 5000$ so $6500 becomes a target afterwards.
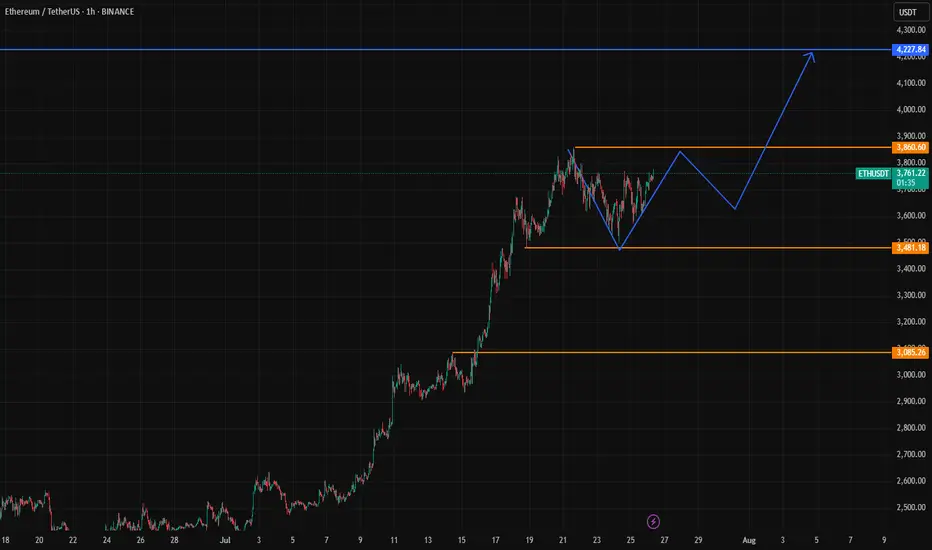
ETH Update – Eyes on the $3,820 Zone📈 ETH Update – Eyes on the $3,820 Zone
Ethereum is showing bullish momentum, and there’s a strong chance it could rally toward the orange resistance line around $3,820.
If price breaks above this level, the next target will be the blue trendline, marking the next key resistance.
🚀 Stay ready — momentum is building.
🔔 Follow for more clean setups and real-time analysis!

Ethereum destroyed resistance at the $3700 level ┆ HolderStatBINANCE:ETHUSDT remains stuck between $3,260 and $3,320, forming a tightening range with bullish undercurrents. Price is holding a higher low and consolidating under resistance, hinting at re-accumulation. A breakout above $3,325 could send ETH toward $3,400+ in short order. Bulls remain in control above $3,260.
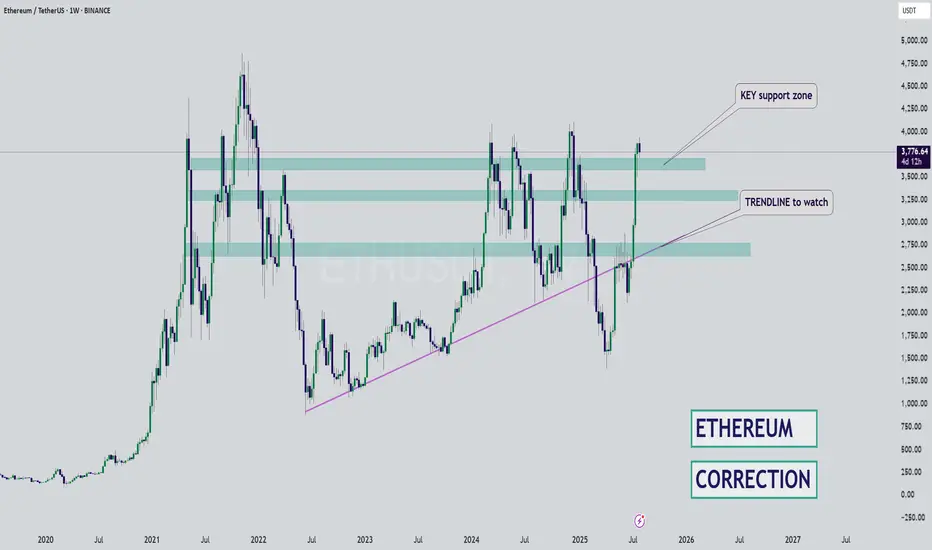
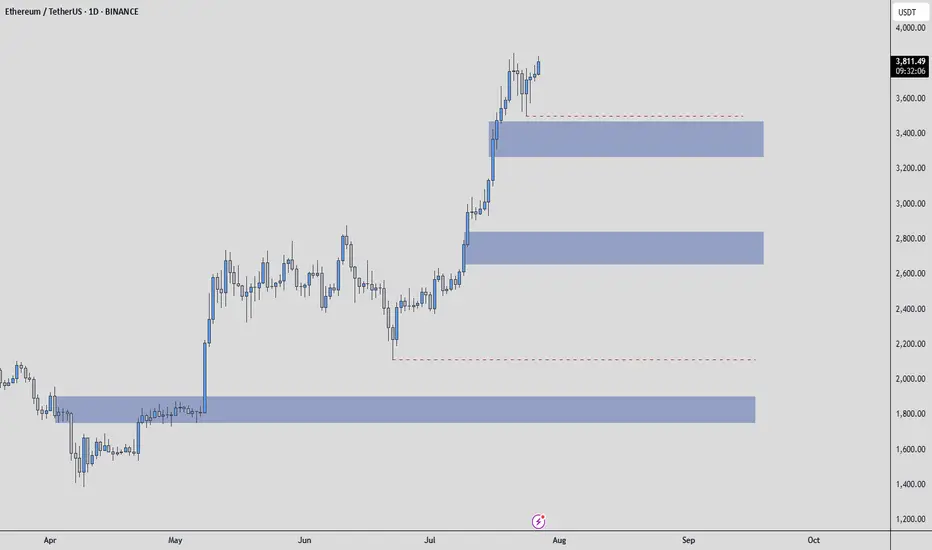
Ethereum - Possible Zones / How to use them ? Hello everyone, and special greetings to my dear friends who follow me, I hope you're happy that I helped you buy Ethereum at $2200.
Let's get to today's situation. There are many areas for Ethereum. The first blue box is the one I'd want to be the first buyer in.
I might want to be a buyer in the other blue boxes as well, but there will be increases even before these areas are reached.
I think the bottom blue box could be the one in the event of a Q3 correction.
What is a Q3 correction? All risk-on markets typically experience significant corrections in the third quarter of the year and struggle to recover from this correction until the end of the year.
The first blue box would be the first area I'd want to be in for any increases leading up to this correction.
HOW DO I GET INVOLVED!! THIS IS IMPORTANT BECAUSE SOME OF YOU LOSE MONEY WHEN BLUE BOXES ARE PULLED AWAY. THIS SHOULD NOT HAPPEN!!
When the price reaches the blue box, the transition is made to the 1-hour timeframe. Here, an upward breakout is sought, and during this breakout, the CDV is expected to be positive and rising. If these conditions are met, then RISK is taken. However, the entire amount of money isn't spent; it simply means that the conditions necessary to spend one bullet are met. One bullet is an amount that won't upset you too much; this varies for everyone.
I hope you use this analysis beneficially and profitably, because I want you to make a lot of money. Best wishes to you all, UmutTrades.
Ethereum (ETH): Approaching $4000, Targeting Next $4800Ethereum is still below our current target, which is $4000. Soon to approach it, we are looking for a breakout from there and another trade to be opened right after the breakout.
The game plan is simple: 1 trade has been successfully closed, and the second one is almost near the target. Now waiting for the third one to be activated!
Swallow Academy
Weekly trading plan for EthereumLast week's BINANCE:ETHUSDT price action performed perfectly according to our scenarios - hitting our first target and establishing a new local high. Currently, price remains above the weekly reversal level at $3,751, maintaining potential for an advance toward Resistance #2.
Key Considerations:
While above $3,751 → Resistance #2 remains in play
Break below reversal level + trendline → Likely retest of last week's low
Such breakdown would likely breach both primary support levels
Trade Plan:
Bulls: Watch for continuation above $3,751
Bears: Require confirmed break of trendline + reversal level
As always, confirmation is key - trade the breaks, not the anticipations

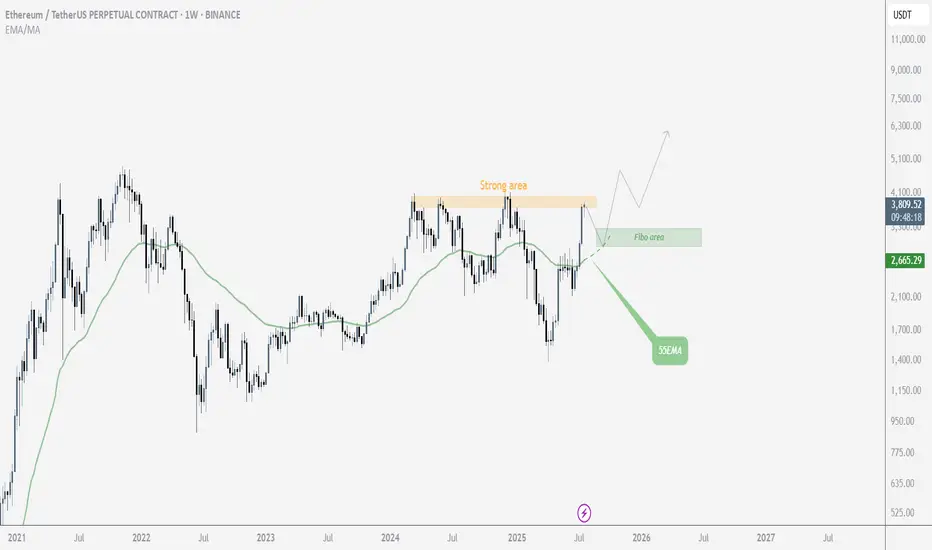
$ETH Mid-TermLooking at Ethereum from a mid-term perspective, it’s currently sitting near its price ceiling, suggesting a potential need for a correction. Of course, it’s also possible that this level could be broken, depending on overall market conditions. However, the primary scenario is that it fails to break through and pulls back, with the potential reversal zone identified based on Fibonacci levels. On the other hand, the 55 EMA is also providing solid support.
If Ethereum manages to break above this resistance, then we'll wait for either a confirmation or a pullback before entering a long position
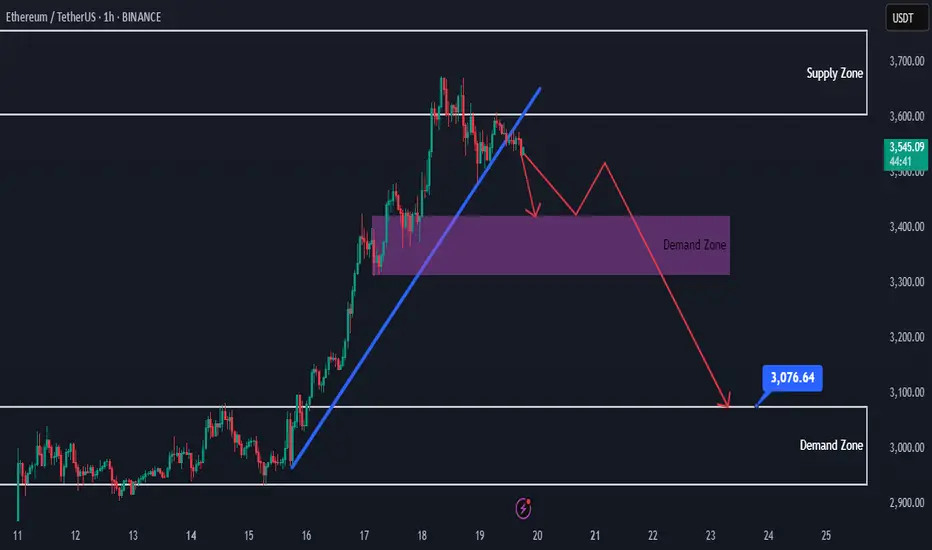
Ethereum at Key Supply — Short-Term Sell OpportunityHello everybody!
Ethereum has reached a strong supply/resistance area in the daily timeframe.
As we see on the chart, lower highs have started to forming.
In addition to that, an upward trendline has been broken.
Keeping in mind that overall trend is bullish, we can look to short time sell positions here.
The first target can be 3300-3400.
If the price breaks below 3300, we can expect it to go lower toward 3100 area.
Manage your risk and trade safe!
Ethereum (ETH) AnalysisEthereum (ETH), the second-largest cryptocurrency by market capitalization, continues to be a pivotal asset in the digital economy, driving the decentralized finance (DeFi), NFT, and Web3 ecosystems. Its price action is influenced by a combination of its own fundamental developments, the broader cryptocurrency market sentiment (primarily Bitcoin's movements), and macroeconomic factors.
1. Fundamental Strengths & Developments:
Ecosystem Growth: Ethereum boasts the largest and most vibrant ecosystem of decentralized applications (dApps). The majority of DeFi protocols, NFT marketplaces, and Web3 infrastructure are built on or heavily integrated with Ethereum. This network effect provides strong underlying demand for ETH as gas fees and collateral.
Scalability Progress (Ethereum 2.0 / Serenity): The ongoing transition to Ethereum 2.0 (now largely referred to as "Serenity" or simply "The Merge" and subsequent upgrades) is a critical long-term bullish factor.
The Merge (completed): The successful transition to Proof-of-Stake (PoS) in September 2022 drastically reduced Ethereum's energy consumption and introduced ETH staking rewards, making it a more environmentally friendly and yield-generating asset.
Shanghai/Capella Upgrade (completed): This enabled staked ETH withdrawals, reducing a major liquidity concern for stakers and attracting more participation in the staking mechanism.
Upcoming Upgrades (e.g., Danksharding, Proto-Danksharding): Future upgrades are focused on increasing scalability and throughput through sharding, which is crucial for lowering transaction costs (gas fees) and enhancing network capacity. Progress on these fronts generally bodes well for ETH's long-term value.
Deflationary Mechanism: EIP-1559, implemented in August 2021, introduced a mechanism to burn a portion of transaction fees. Coupled with staking, this can lead to a net deflationary supply of ETH during periods of high network activity, reducing circulating supply and potentially increasing value.
2. Price Action and Technical Considerations (General Outlook):
Correlation with Bitcoin (BTC): ETH's price often highly correlates with Bitcoin. A strong bullish trend in BTC typically pulls ETH higher, while a significant BTC correction usually leads to ETH declines. Observing BTC's technical structure (support, resistance, momentum) is crucial for predicting ETH's near-term movements.
Key Price Levels:
Support: Historically significant support levels often exist around previous highs or strong accumulation zones. These levels act as price floors where buying interest tends to emerge.
Resistance: Previous all-time highs or significant resistance zones (where selling pressure has historically been strong) act as ceilings. A decisive break above these levels, especially with high volume, can signal a continuation of an uptrend.
Market Cycles: Cryptocurrencies are highly cyclical. After periods of rapid price appreciation, consolidation or correction phases are common. These periods allow the market to digest gains, reset funding rates, and build new bases for future moves.
3. Macroeconomic and Regulatory Factors:
Interest Rates and Inflation: Higher interest rates and tighter monetary policies from central banks can reduce liquidity in financial markets, impacting risk assets like cryptocurrencies. Conversely, a more dovish stance can be supportive.
Regulatory Environment: Clarity or uncertainty from regulators (e.g., SEC in the US, MiCA in Europe) can significantly influence institutional adoption and overall market sentiment. Positive regulatory developments can instill confidence, while restrictive measures can cause FUD (Fear, Uncertainty, Doubt).
Global Economic Health: A robust global economy generally fosters a risk-on environment, which is favorable for crypto. Economic slowdowns or recessions can lead to risk aversion.
Outlook:
Ethereum remains a strong long-term investment given its foundational role in the decentralized web and its continuous technological advancements. The successful transition to PoS and ongoing scalability efforts are critical drivers.
Bullish Scenario: If the broader crypto market remains strong, Bitcoin maintains its uptrend, and Ethereum continues to deliver on its roadmap (e.g., successful sharding implementations), ETH could target new all-time highs. Increased institutional interest, ETF approvals (for ETH directly or indirectly), and sustained DeFi/NFT activity would further fuel this.
Bearish Scenario: Significant macroeconomic headwinds, a prolonged downturn in Bitcoin's price, major regulatory crackdowns, or unforeseen technical issues with Ethereum's upgrades could lead to a correction.
Conclusion:
Ethereum's value proposition is robust due to its vibrant ecosystem and relentless development. While short-term price movements will be influenced by market sentiment and macroeconomic factors, its long-term trajectory appears promising as it continues to solidify its position as the backbone of the decentralized future. Investors should closely monitor Bitcoin's price action, Ethereum's development milestones, and broader economic indicators.