Ethusdt buy / long setupEth has a good pullback yesterday. Eth showing strong momentum against all the market. Long at cmp 3641, first tp is 3960 the next is 4.1k. must use sl.
ETHUSDT trade ideas

Ethereum (ETH) has taken the lead in the crypto market, surpassiEthereum (ETH) has taken the lead in the crypto market, surpassing Bitcoin."

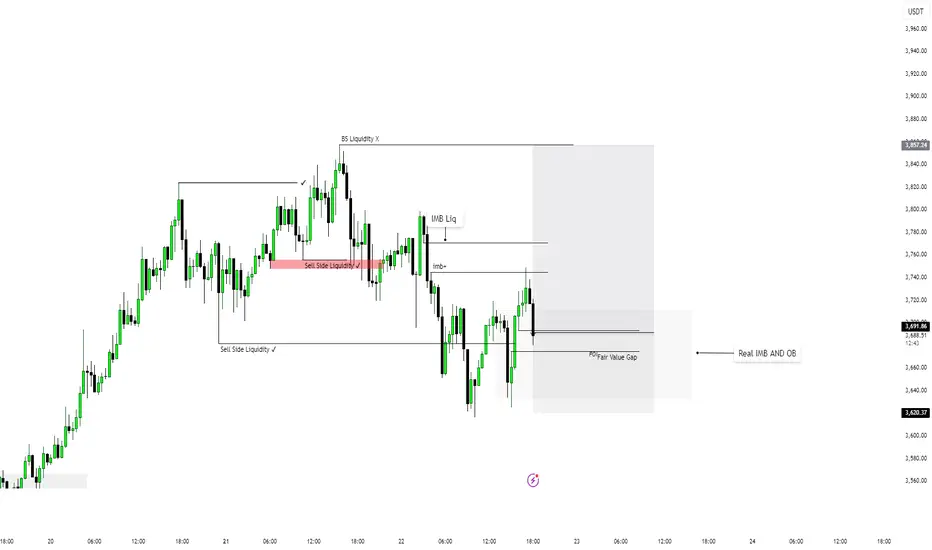
ETHUSDT SCALP SESSION SMC Analysis | Liquidity Sweep → IMB/OB Reclaim | Long Setup
Price action shows a clear sweep of Buy-Side Liquidity (BSL) above previous highs, followed by a sharp rejection and move downward. Liquidity was collected both at the top (BS Liquidity X) and below (Sell Side Liquidity ✓), confirming a classic liquidity grab setup.
Price is currently retracing into a Fair Value Gap (FVG) and approaching the zone marked as Real IMB and OB, indicating a potential high-probability reversal area.
Key confluences:
✅ BSL taken
✅ SSL taken
🕳 IMB Liquidity filled
📉 Pullback into FVG
🎯 Anticipating reaction from the OB zone (~3620) for a long continuation.
This setup targets a return toward previous inefficiencies and liquidity pools around 3694–3867. Entry confirmation required inside the OB zone or on lower-timeframe structure shift.
Ethereum Ready for Breakout Above $3850?📊 Ethereum Quick Analysis | Breakout or Breakdown?
✅ As long as ETH stays between $3400 - $3600, the bullish outlook remains intact.
🚨 A confirmed close below $3200 could mark the end of the bull market.
🚀 A clean, shadowless candle close above $3850 may push price toward $4100.
⚠️ However:
📉 Expect retail sell-offs around those highs
💸 But heavy institutional buying could send ETH to $6230 in the short term.
🔥 Altseason is officially here — get ready for explosive moves!
🎯 I'm here to track and update all major targets in real-time 💥
#BullRun#altseason#ETH

H&S formation at 1H chartETH/USDT almost completed formation of H&S patern at 1H chart. If neckline will be broken it's mean Elliot wave completed and we can expect deep correction. Also RSI divergence confirming this reversal

Weekly plan for EthereumLast week, ETH followed our green scenario, breaking through resistance to reach $3,860. Currently, a critical level at $4,116 (higher timeframe) will determine the next major move.
Key Scenarios
If $4,116 holds as resistance:
Expect a Wave E correction within the long-term ABCDE triangle pattern.
Initial downside target: $3,500
Breakdown below $3,500 opens the door to $3,100–$2,900
If $4,116 breaks:
The ABCDE triangle scenario is invalidated
Next major resistance levels open for a potential continuation rally
Current Market Structure
Price remains above the weekly pivot point
However, early signs suggest a correction may have begun
Confirmation of a deeper pullback requires a close below $3,500
As always, manage risk according to key level breaks

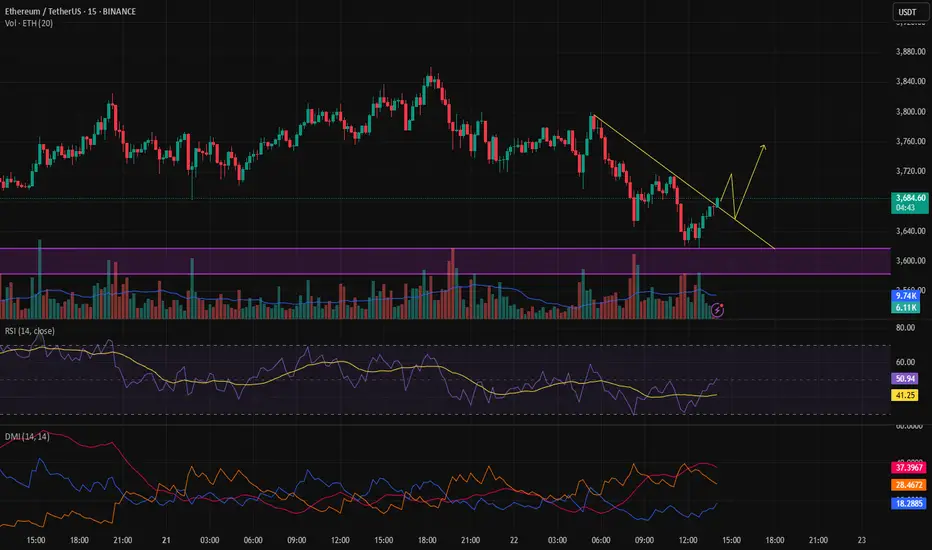
Ethereum 15m Analysis – Waiting for Bullish ConfirmationAfter a step up, Ethereum made a pullback, and a news event released today caused the correction to deepen.
So far, we haven’t received any bullish confirmation.
If the price pulls back to the marked level and gives confirmation on the 15-minute timeframe, we can look for a buy opportunity.
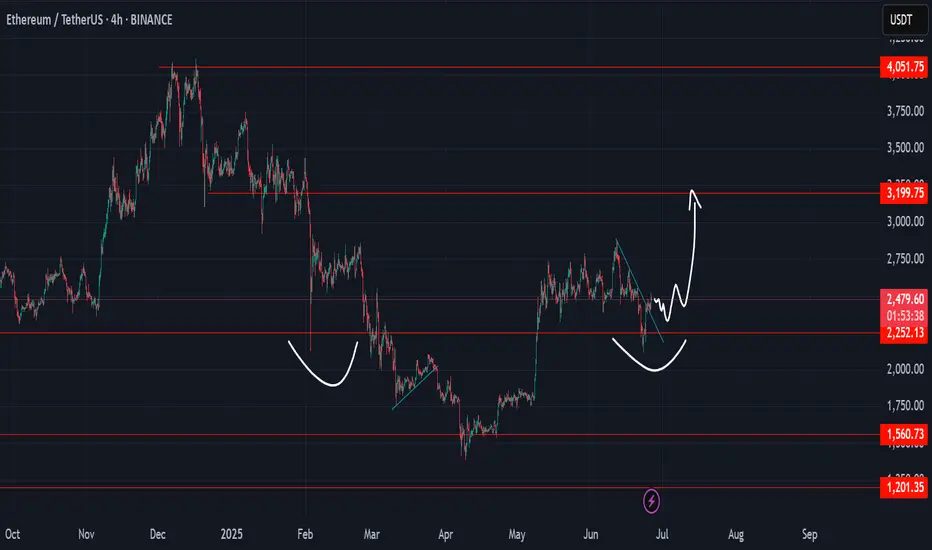
ETH and iHnS SpeculationETH in candle stick mode create iHnS pattern
if we can hold above 2k its still positive if we can retest to 3.2k

Analysis for entering Ethereum after an incomplete correctionSure! Here's the complete and fluent English translation of your text:
---
Ethereum Price Analysis and Buy Strategy for a 3–4 Month Hold (as of July 22, 2025)
When considering Ethereum (ETH) for a medium-term hold of 3 to 4 months, it's important to keep a few key points in mind. The cryptocurrency market is highly volatile, and there's no guarantee of profit. The following information is based on available analysis as of July 22, 2025, and should not be taken as financial advice. Always do your own research and consult a financial advisor if necessary before making any investment.
---
✅ Current Ethereum Price Analysis (as of July 22, 2025):
Current Price: Ethereum is currently trading in the range of $3,750 to $3,800.
Short-Term Trend: ETH has seen a significant rise in recent weeks, climbing from around $2,900 to its current price range. This growth is partly due to increased investor interest in Ethereum spot ETFs, as well as ecosystem developments like Dencun upgrades and the expansion of Layer 2 solutions.
Technical Analysis:
Moving Averages: Most short-term and long-term moving averages (e.g., MA5, MA10, MA20, MA50, MA100, MA200) are signaling a "Buy", indicating a strong bullish trend.
Relative Strength Index (RSI): Ethereum’s RSI is currently high (around 67 to 87), suggesting strong bullish momentum. However, an RSI above 70 also signals a possible overbought condition, which could lead to a short-term price correction.
Key Support & Resistance Levels:
Support: $3,400, $3,200–$3,250, and $2,900–$2,700
Resistance: The psychological barrier at $4,000 is a major resistance level. Breaking above this could open the path toward ETH’s all-time high (ATH) of around $4,878.
Short-Term Forecast (Next 3–4 Months):
Many analysts and forecasting models suggest a positive outlook for Ethereum over the coming months.
Some projections estimate ETH could reach $4,200 to $5,150 (or even higher) by late 2025.
Factors contributing to potential growth include capital inflows into spot ETFs, rising ETH staking, and continued Ethereum network development.
---
📈 Buy Strategy for a 3–4 Month Hold:
For a medium-term hold, Dollar-Cost Averaging (DCA) is a highly recommended strategy. DCA helps reduce exposure to short-term volatility and makes capital management easier both financially and psychologically.
Why DCA Works Well for 3–4 Month Holds:
Mitigates Volatility Risk: Instead of investing your entire capital at once, divide it into smaller amounts and invest at fixed intervals (weekly or biweekly). This way, you buy at both high and low prices, achieving a more balanced average entry point.
Reduces Emotional Pressure: You don’t have to worry about timing the market perfectly. With consistent buying, you reduce the stress of “buying the dip” or “selling at the top.”
Takes Advantage of Dips: If ETH experiences a dip during your holding period, you can buy at lower prices, reducing your average cost.
---
📌 How to Execute the DCA Strategy (Example for 1 ETH Investment):
Assume you want to invest the equivalent of 1 ETH (about $3,750 at current price).
1. Determine Your Total Budget: Decide how much you want to invest—only use funds you can afford to lose. In this case, $3,750.
2. Break the Holding Period into Weeks: Divide the 3–4 month period into weeks:
3 months = 12 weeks → $3,750 / 12 = $312.50 per week
4 months = 16 weeks → $3,750 / 16 = $234.37 per week
3. Set a Fixed Buy Schedule: For example, buy every Monday at 10 AM, regardless of the price at that moment.
Sample DCA Timeline (with hypothetical price movements):
Week 1: Buy $312.50 ETH at $3,750
Week 2: ETH dips to $3,600 → Buy $312.50
Week 3: ETH rises to $3,900 → Buy $312.50
Week 4: ETH falls to $3,500 → Buy $312.50
… Continue this process for the full 3–4 months.
---
🛡️ Additional Tips for a 3–4 Month Hold Strategy:
Know Your Risk Tolerance: ETH is a high-risk asset. Understand your personal risk level before investing.
Stay Informed: Even while holding, monitor ETH-related news, upgrades, and crypto market developments.
Use a Secure Wallet: Store your ETH in a secure wallet (preferably a hardware wallet) to protect against hacks or exchange risks.
Optional Partial Profit-Taking: If ETH experiences an unexpected surge (e.g., above $4,500 or $5,000), you could consider taking partial profits (e.g., sell 10–20% of your holdings) to reduce risk and lock in gains. This is optional and depends on your strategy.
Stop-Loss (if active trading): If you’re only holding passively, you likely won’t set a stop-loss. But if you plan to do active trades later, make sure to use stop-loss orders to protect capital in case of a steep price drop.
Take-Profit (TP) Planning: Even when holding, you can plan price targets. For example:
Sell 25% if ETH reaches $4,500
Sell another 25% if ETH hits $5,000
(Adjust based on your goals.)
---
🔮 Outlook for the Next 3–4 Months:
With Ethereum spot ETFs launching and generating excitement, capital inflow is likely to grow. Continued development of Layer 2 solutions, DeFi applications, and the overall ETH ecosystem may increase demand for ETH. Many analysts are optimistic about ETH’s performance in the second half of 2025, with potential to break above $4,000 and possibly approach or exceed $5,000.
---
✅ Summary:
For a 3–4 month Ethereum hold, DCA (Dollar-Cost Averaging) is the most practical and risk-managed strategy. Decide your total budget, split it into weekly or biweekly investments, and stick to the plan—regardless of daily price fluctuations. This strategy helps reduce emotional decision-making and improves your average entry price. Remember: crypto markets are risky, so never invest more than you can afford to lose.
---
Let me know if you'd like this formatted as a downloadable PDF, infographic, or a Notion-ready summary.

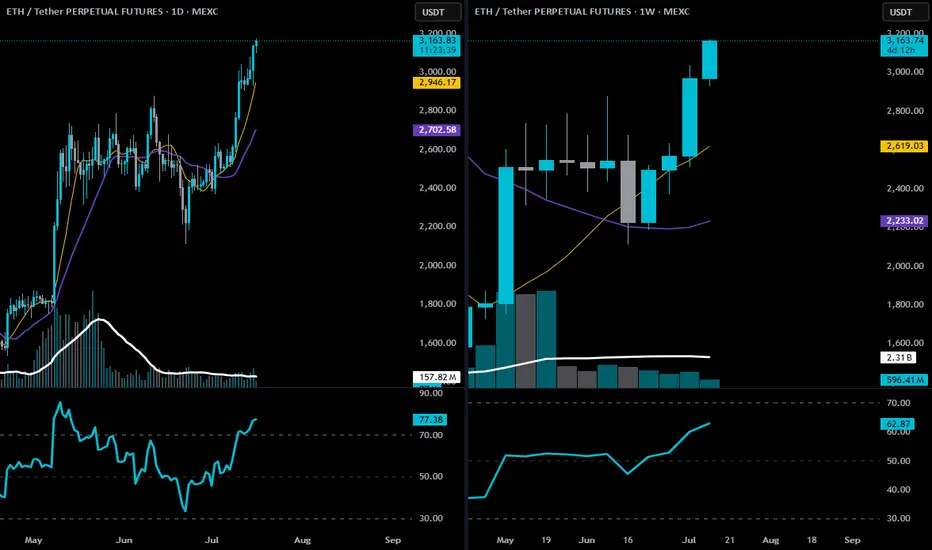
ETH-technical structure, momentum, and confirmation🕐 Daily Chart Analysis
Trend: Clear uptrend. Price is trading well above both the 9 EMA (gold) and 20 EMA (purple), with strong angle and separation.
Price Action: ETH is pressing into multi-month highs with no major resistance between here and the $3,350–$3,500 range.
Volume: Healthy increase in volume on bullish candles; recent bullish expansion looks organic, not low-volume driven.
RSI: At 77.15 — yes, overbought, but in a trending market, this is confirmation, not a sell signal. You want RSI to stay elevated during impulsive legs.
📅 Weekly Chart Analysis
Breakout Structure: This is the second full bullish candle after breaking out of a multi-month base ($2,800 range), following an accumulation period.
9 EMA Just Crossed Over 20 EMA: First time since early 2024 — bullish trend confirmation.
Volume: Large expansion bar from May shows institutional interest; current bar remains strong and building.
RSI: Pushing up to 62.75 — well below overbought, meaning there’s room to run.
🧭 Strategic Trade Plan (Swing Long)
✅ Bias: Long
Targeting $3,300–$3,500 with trailing logic to extend if momentum continues.
THIS IS NOT FINANCIAL ADVICE. Drinkin Smöökëē Whizkee. Edumacational Purpiz Only!
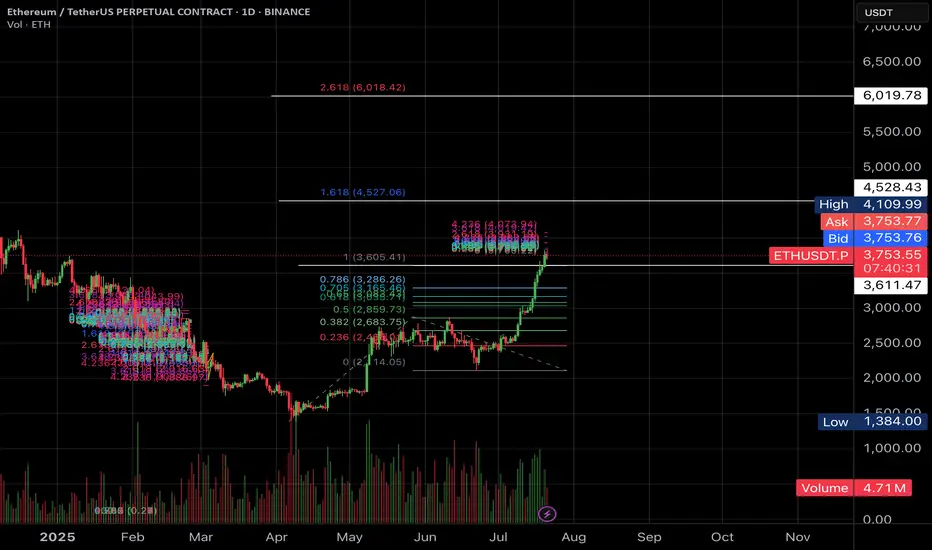
$6000 worth ETH?Hi Padawans,
ETH is showing strong bullish momentum, currently trading around $3,766. If it breaks above the resistance near $4,500–$4,900, the 2.618 Fibonacci extension points to a potential target around $6,000.
Best Regards,
CryptoObi
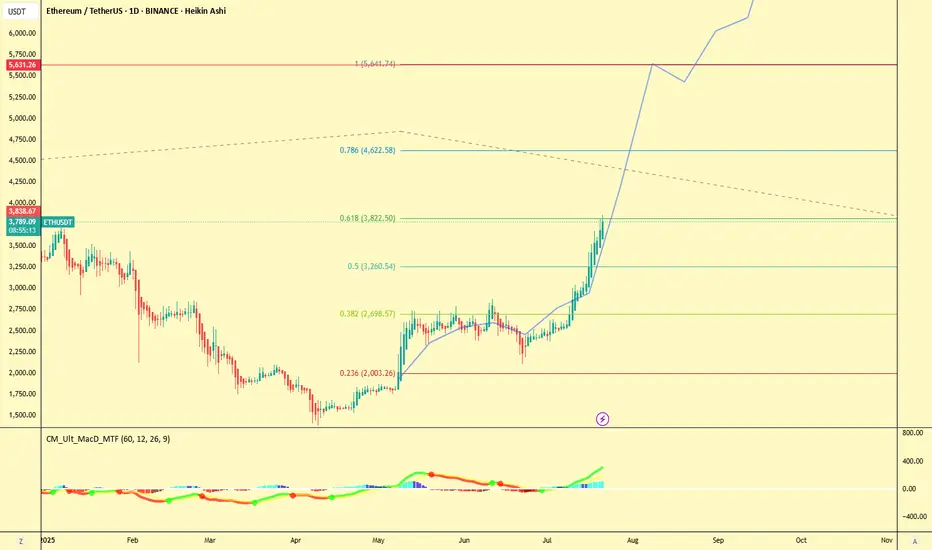
ETH not stopping at 4k > TARGET 5.6KChart displays the next cycle by combining the last cycle's path inside the fib extension tool.
Going to keep it cool and ride the whole wave up.
Good luck everyone
If this plays out, I'll share the 2 other targets.
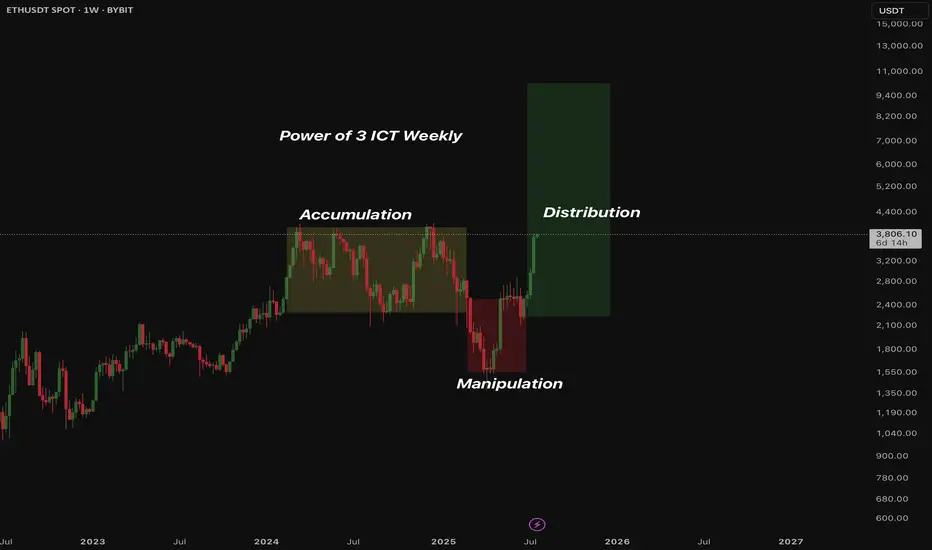
Ethereum LONG The Power of 3!
Letsgooo 10K!
On the daily we've seen a power of 3 ict played out.
Now on the Weekly chart.
ETHUSDTOn the daily time frame, Ethereum is in the last dance and is in the distribution to form its last ceiling.
BINANCE:ETHUSD BINANCE:ETHUSDT
aram pishbin

ETH-----Buy around 3600, target 3660 areaTechnical analysis of ETH contract on July 18:
Today, the large-cycle daily level closed with a small positive line yesterday, the K-line pattern continued to rise, the price was above the moving average, and the attached indicator was running in a golden cross. The general trend of rising is still relatively obvious. Recently, you can see that Ethereum is stronger than the big cake, and the continuous high-breaking prices are getting closer and closer to the previous historical highs. So this month there is a chance to touch or test; the short-cycle hourly chart rose strongly in the morning and broke the previous day's high position. The current price is above the moving average, and the attached indicator is running in a golden cross. The intraday and European sessions still depend on the trend of continuing to break high.
Today's ETH short-term contract trading strategy:
Buy in the 3600 area, stop loss in the 3570 area, and target the 3660 area;

ETH to 5000USDBINANCE:ETHUSDT
Key take away points :
-Ethereum has been uptrending for a long time already.
-We did not break previous ATH yet.
-I believe we are in the alt season, and ethereum is just getting started.
-I expect price to break previous ATH within months, and to potentially reach 5-6K USD.
Weekly ETH candle sitting on 3 lines of resistance.This weekly ETH God candle is fighting with 3 lines of resistance. The white is the 25% discount zone calculated from Ethereums lowest to the highest point. Ethereum is right now roughly 25% below it's ATH. Plus two FIB retracement lines. There are 12 more hours till the end of this week, and unless we see a candle close above the 25% resistance line and a new one open, we may see some retracement. It would also be warranted to see some profit taking on the recent hype over the weekend, particularly with talks of Wall Street making announcements of plans to palce massive ETHEREUM buy orders. I expect some downtime towards the start of the week followed by the continuation of the pump possibly Tuesday or Wednesday.

ETHUSDT - Limited Return PriceEthereum is a reliable network for financial transfers and transactions and can be considered the second most popular digital currency after Bitcoin. Currently, this currency has reached the price range of $2,500 with temporary decreases, but this price is at its lowest level and the probability of liquidity entering this price area is very high. This price level can be used for long-term investment. I specify two targets for this price area: $4,000-5,000.
Sasha Charkhchian

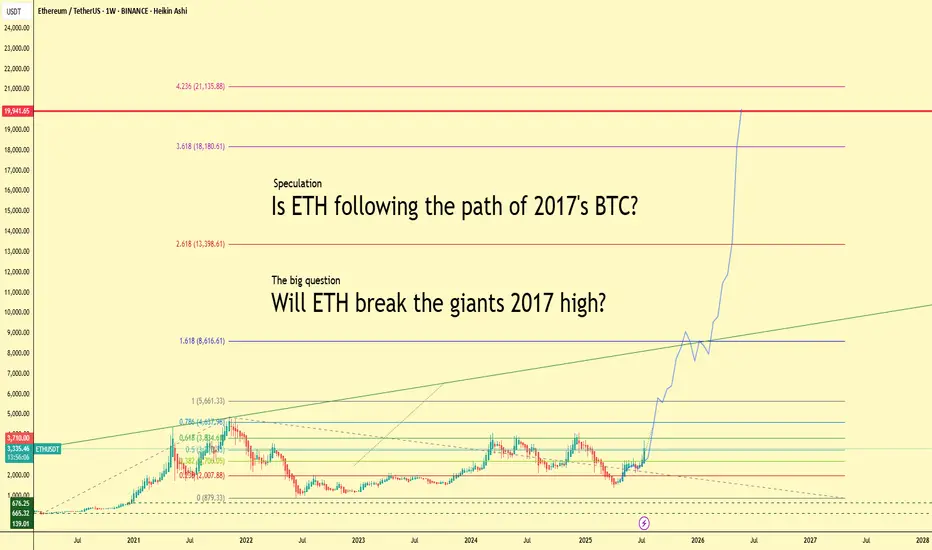
Will ETH Follow BTC’s 2017 Path? $20K in Sight?Ethereum is heating up — up more than 20% this week and currently trading above $3,300. But what if we told you this might just be the beginning?
This chart explores a bold yet exciting speculation:
👉 Is ETH repeating Bitcoin’s legendary 2017 run?
Back then, BTC went from obscurity to global headlines, smashing through $1k, then $5k, then $10k… and eventually peaking just below $20,000. Ethereum might just be lining up for a similar parabolic path.
🚀 Fibonacci Levels Say: Sky’s the Limit
The chart projects Fibonacci extensions up to:
1.618 = $8,600
2.618 = $13,400
3.618 = $18,180
4.236 = $21,135
Notice the key level: $19,941. That’s the legendary BTC high of 2017. Will ETH match or even surpass that milestone?
🧠 The Big Question:
Can ETH become the new “giant”?
While Bitcoin still leads the narrative, Ethereum’s ecosystem, real-world adoption, and institutional attention have never been stronger.
💬 Let’s Talk
Do you believe Ethereum is set to break $20K this cycle? Or is this just hopium and lines? Share your thoughts and let's compare notes.
#Ethereum #ETHUSDT #Crypto #Altseason #BTC2017 #Fibonacci #Bullrun #ETHBreakout #Parabola #CryptoSpeculation
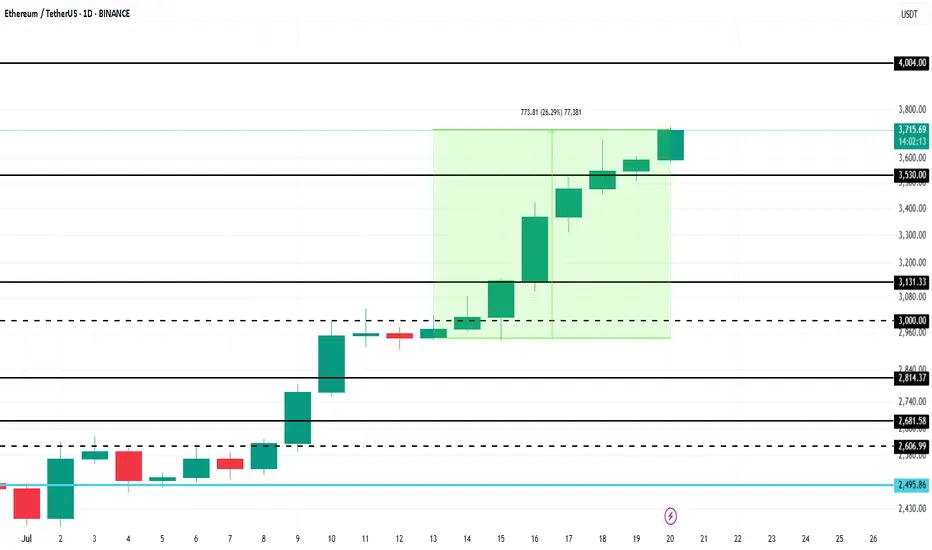
Ethereum Price Hits 6-Month High, Up Next $4,000BINANCE:ETHUSDT has managed to navigate recent market volatility with significant support from investors. As companies increasingly mirror Bitcoin’s corporate treasury use case, Ethereum is gaining traction.
BINANCE:ETHUSDT price surged 26% over the past week , reaching $3,715 and marking a 6-month high. The rally strengthened after ETH formed a Golden Cross last week. With this bullish momentum, Ethereum is now targeting $4,000 in the coming days, benefiting from investor confidence and growing institutional interest.
However, if BINANCE:ETHUSDT bullish momentum weakens and investors opt to sell, the price could decline to $3,131 . This would erase recent gains and invalidate the current bullish outlook.
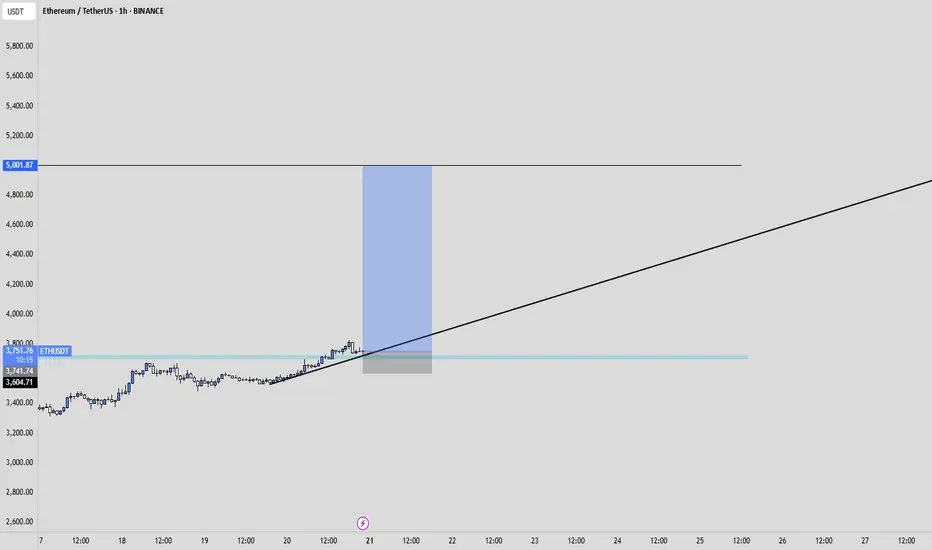
ETHUSDT | Two Opportunities. One Smart Approach.I’ve been closely watching how buyers behave under the green line — and they’re clearly not backing down. But what really catches my eye is the blue box , a clean demand zone I’ve seen act as a launchpad in the past.
You don’t need to jump in blindly.
Depending on your risk appetite, both levels are valid. But if you wait for a 15-minute breakout confirmation on the low timeframe before acting on either, your odds of success increase significantly.
This is how I keep my win rate high, waiting for the market to prove itself first.
“I will not insist on my short idea. If the levels suddenly break upwards and do not give a downward break in the low time frame, I will not evaluate it. If they break upwards with volume and give a retest, I will look long.”
Most traders rush in. You wait smart. That’s the edge.
Choose wisely. Follow closely.
📌I keep my charts clean and simple because I believe clarity leads to better decisions.
📌My approach is built on years of experience and a solid track record. I don’t claim to know it all but I’m confident in my ability to spot high-probability setups.
📌If you would like to learn how to use the heatmap, cumulative volume delta and volume footprint techniques that I use below to determine very accurate demand regions, you can send me a private message. I help anyone who wants it completely free of charge.
🔑I have a long list of my proven technique below:
🎯 ZENUSDT.P: Patience & Profitability | %230 Reaction from the Sniper Entry
🐶 DOGEUSDT.P: Next Move
🎨 RENDERUSDT.P: Opportunity of the Month
💎 ETHUSDT.P: Where to Retrace
🟢 BNBUSDT.P: Potential Surge
📊 BTC Dominance: Reaction Zone
🌊 WAVESUSDT.P: Demand Zone Potential
🟣 UNIUSDT.P: Long-Term Trade
🔵 XRPUSDT.P: Entry Zones
🔗 LINKUSDT.P: Follow The River
📈 BTCUSDT.P: Two Key Demand Zones
🟩 POLUSDT: Bullish Momentum
🌟 PENDLEUSDT.P: Where Opportunity Meets Precision
🔥 BTCUSDT.P: Liquidation of Highly Leveraged Longs
🌊 SOLUSDT.P: SOL's Dip - Your Opportunity
🐸 1000PEPEUSDT.P: Prime Bounce Zone Unlocked
🚀 ETHUSDT.P: Set to Explode - Don't Miss This Game Changer
🤖 IQUSDT: Smart Plan
⚡️ PONDUSDT: A Trade Not Taken Is Better Than a Losing One
💼 STMXUSDT: 2 Buying Areas
🐢 TURBOUSDT: Buy Zones and Buyer Presence
🌍 ICPUSDT.P: Massive Upside Potential | Check the Trade Update For Seeing Results
🟠 IDEXUSDT: Spot Buy Area | %26 Profit if You Trade with MSB
📌 USUALUSDT: Buyers Are Active + %70 Profit in Total
🌟 FORTHUSDT: Sniper Entry +%26 Reaction
🐳 QKCUSDT: Sniper Entry +%57 Reaction
📊 BTC.D: Retest of Key Area Highly Likely
📊 XNOUSDT %80 Reaction with a Simple Blue Box!
📊 BELUSDT Amazing %120 Reaction!
📊 Simple Red Box, Extraordinary Results
I stopped adding to the list because it's kinda tiring to add 5-10 charts in every move but you can check my profile and see that it goes on..

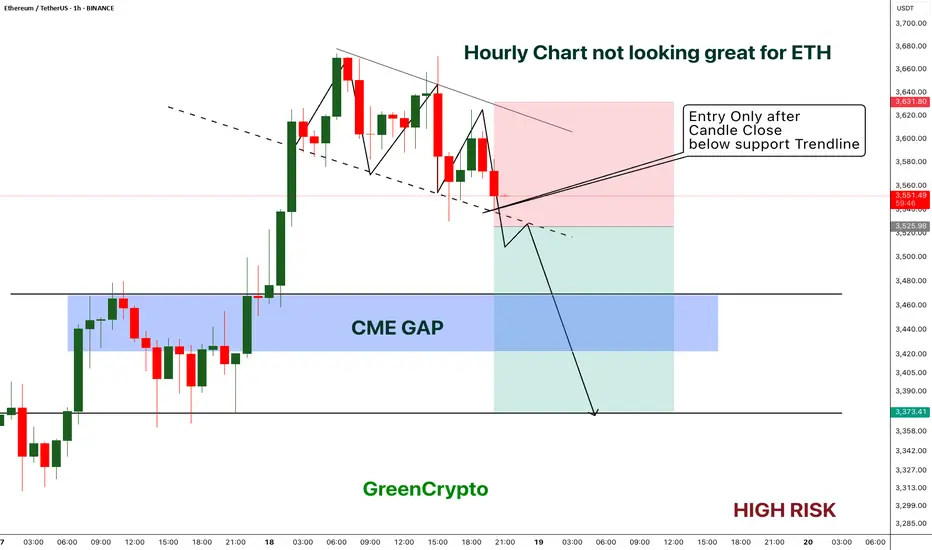
ETH - Short Trade with HIGH RISK- ETH got reject from resistance multiple times on 1H timeframe and now the price is playing near the support.
- I'm expecting overall market to cooldown this weekend, this could push the ETH to break the support
- ETH has CME gap around 3422 - 3467 range, im expecting this CME gap to be filled soon.
Entry Price: Below 3525
Stop Loss: 3631
TP1: 3471.15
TP2: 3381.76
Move SL to breakeven on TP1 hit.
Don't forget to keep stoploss.
Cheers
GreenCrypto