ETH - AnalysisEvery time Ethereum has broken through $2,800,
it triggered a massive move.
Over the past two years, this level has acted as key support or resistance 7 times.
Once we break through and get a clean, sustained close above, the next major rally is likely to follow.
Keep a close eye on this price level — it will be the turning point.
LFG
ETHUST.P trade ideas

ETH LONG TRADE PLAN.ETH long below the liquidity line in demand zone. Below sell side liquidity is our entry zone.

ETHUSED TREND WEAKER Price has been ranging between approximately 2500 and 2900 and the major trend is strongly bearish.Price recently attempted to break above previous highs but got rejected. Price is at a critical support level in a larger range structure. A break below 2500 could lead to a deep correction correction

Eth longSimple idea here, if BTC gets stuck between the weekly range, then maybe ETH gets some traction.
There hasn't been a meaningful pullback since the last move up so we may see that move down soon or we follow BTC and move straight up fairly quickly after a shallow move down to sweep the lows
That whats I'm illustrating here, small sweep of the recent lows and then a move up to previous highs

Ethereum Weekly: Bullish & Bearish ExplainedEthereum has been sideways five weeks straight. Market conditions here are bullish and bearish short-term. Let me explain.
The market has bearish potential because of resistance. Ethereum has been facing resistance and fails to move forward for more than one month, but the bias isn't bearish, this is just a potential based on short-term price action.
The market has bullish potential because of a strong recovery after the 7-April low; because it trades above the August 2024 low and because there is very little retrace since the 5-May break of resistance in the form of EMA34 and MA200.
Ethereum is bullish because it trades above MA200 and remains above this level.
We are seeing bullish consolidation. There was an advance recently and after this advance the market went sideways. This means bullish.
While there can be a retrace short-term, market conditions remain bullish for this pair; ETHUSDT.
The bulls have the upper-hand and the majority of signals are bullish. Ethereum will continue to grow.
There is no scenario where Ethereum moves and closes weekly below its 3-Feb and 24-Feb lows ($2,075). It is simply consolidating before additional growth. It is going to go up, sooner rather than later.
Thanks a lot for your continued support.
Namaste.

Ethereum (ETH) is still looking bullish"Spring" breakout, retest of the range low. Textbook price action on ETH!

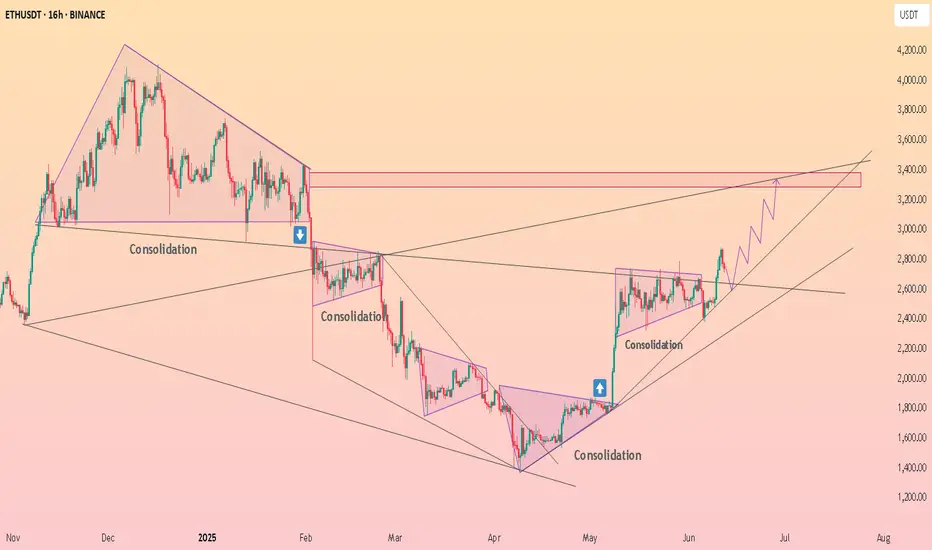
"Bearish Reversal Opportunity Following Supply Zone Rejection"1. Double Top Formation (Resistance Level Identified)
The chart displays a clear double top structure at the 2,760–2,800 USDT level.
This level has acted as a strong supply zone (highlighted in red), where price previously reversed, indicating heavy selling interest.
Current price action has retested this resistance zone and shown signs of rejection.
2. Liquidity Sweeps & False Breakouts
On the left side of the chart, an aggressive downward wick (marked with a blue arrow) suggests a liquidity sweep below a key low before strong bullish momentum returned.
This type of price action indicates smart money involvement, designed to remove weak hands before pushing price higher.
3. Accumulation Phases (Sideways Consolidation)
Multiple accumulation ranges are highlighted with blue rectangles.
These ranges show horizontal consolidation, where price builds up energy before breakout.
The most recent breakout led to a vertical rally toward the resistance zone, signaling an end of the accumulation and a start of distribution.
4. Double Bottom Support Structure
Identified near the 2,480 level, marked by red circles.
This level has historically acted as demand/support, evidenced by multiple bounces from this price zone.
Now highlighted with a grey zone, it is projected to act as the next key support area.
5. Bearish Projection
A large black arrow suggests a forecasted bearish move from the current high (~2,800) back to the support zone (~2,480).
This aligns with the idea of a mean reversion or pullback after a strong bullish impulse.
---
Conclusion & Trade Idea:
🔻 Bias: Bearish (Short-term)
The chart presents a classic reversal pattern with a double top at a well-defined supply zone.
Entry could be considered after confirmation of rejection from this level.
🧠 Trade Plan Suggestion:
Entry: Short near 2,780–2,800 after bearish confirmation (e.g., bearish engulfing candle or break of structure).
Target: 2,480 (support zone).
Stop Loss: Above 2,820 (recent high).
Risk-Reward: Approximately 1:2.5 or better depending on execution.

ETH rang is being respected. ETH is holding strong within range. As long as the price stays in range, a bullish bias is supported. If the price breaks below, there is a volume gap sub 2k. Be ready with the plan.
Full TA: Link in the bio

ETH: Next ATH on the Horizon? My Elliott Wave Analysis Says YESMy latest Elliott Wave count on TradingView points to a significant bullish impulse for ETH, suggesting we're gearing up for a fresh All-Time High! The wave structure looks clean, indicating strong momentum ahead.
Check out my chart and let me know your thoughts on this potential move!
#ETH #ElliottWave #TradingView #ATH #Crypto #MarketAnalysis #Bullish

ETH ANALYSIS📊 #ETH Analysis : Update
✅As we said earlier, #ETH performed same. Now we can see that #ETH is trading in a bullish flag pattern and its a bullish pattern. We could expect around 10% bullish move if it sustain above its major support.
👀Current Price: $2555
🚀 Target Price: $2815
⚡️What to do ?
👀Keep an eye on #ETH price action and volume. We can trade according to the chart and make some profits⚡️⚡️
#ETH #Cryptocurrency #TechnicalAnalysis #DYOR

HolderStat┆ETHUSD above the consolidation zoneCRYPTOCAP:ETH
→ Basing above 2 400 while probing triangle apex
↳ Crack 2 550–2 600 for runway to 2 850–3 150
⇢ Trend guard sits at 2 650 → 2 500
⤴ Close < 2 650 drops Ether back into old range
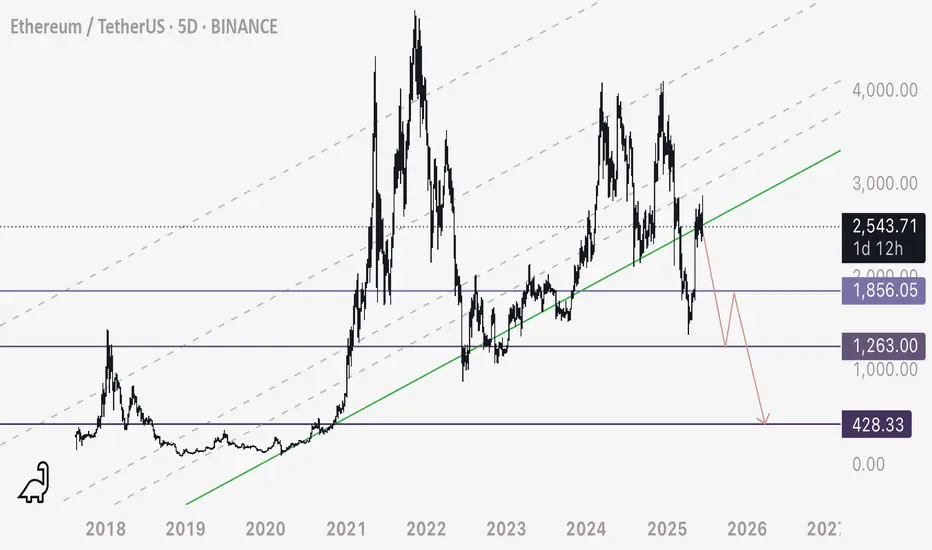
ETH - Another Take - When in Doubt, Zoom OutETH on the multi day time frame appears to have been respecting this ascending series of support / resistances since its inception.
If this resistance holds, this is a major breakdown of ETH’s last support - assuming the chart does work best on these ascending channels (certainly has historically).
Due to this I am shorting ETH at 2550 appx - and my targets are marked on the chart (3 purple levels).
I don’t see why any formation on the chart should be dismissed if it has a strong interaction historically.
Let’s see what happens.
Happy trading
Ethereum (ETH): Back at 200EMA | Buyers Trying To Gain Control A strong selloff happened recently, which led the price to the 200EMA line, where, similar to last time we touched that area, we are seeing some kind of bullish overtake happening.
Now, as markets are very unpredictable currently, we are looking for a full buyside takeover to happen near the current zone, which would then mean that our game plan will remain the same: movement to $3000.
Now, if sellers continue to show dominance, we might be seeing a very nasty drop from here so keep your eyes wide open at the 200EMA line.
Swallow Academy

eth in 45minas you can see we have a bullish trend and strong support for eth.the price will go up and push for orders in higher price.follow me for more....

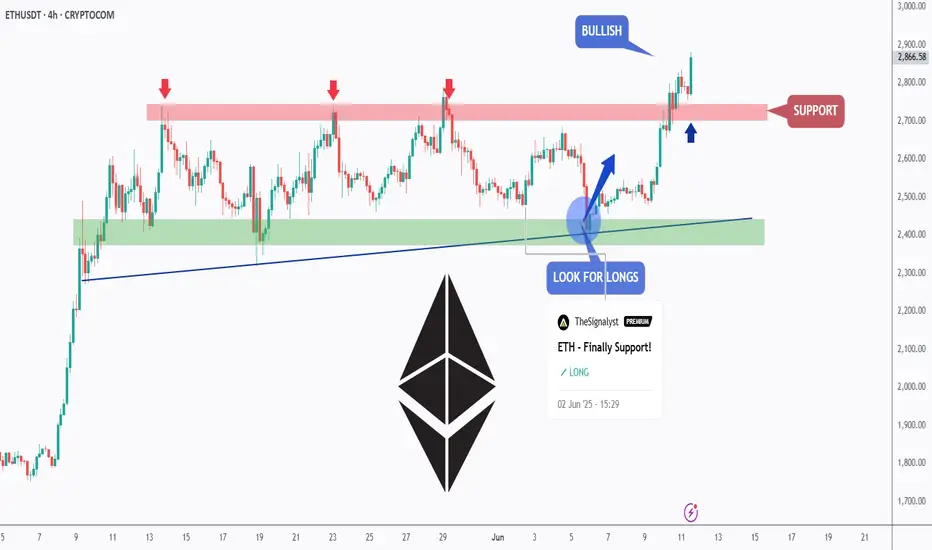
ETH - Medium-Term Bulls Confirmed Control!Hello TradingView Family / Fellow Traders. This is Richard, also known as theSignalyst.
📈 As per our previous ETH analysis (shown on the chart), ETH rejected the green support zone and pushed higher, reaching our target near $2,750.
What’s next?
After breaking above the $2,750 structure marked in red, the bulls have confirmed medium-term control.
🏹 As long as the last major low at $2,700 holds, ETH is expected to remain bullish, with a potential move toward the $3,500 resistance zone.
📚 Always follow your trading plan regarding entry, risk management, and trade management.
Good luck!
All Strategies Are Good; If Managed Properly!
~Rich
Ethereum VS $2800The 20MA on monthly timeframe for Ethereum is still working as a strong resistance, and Ethereum is running out of time to break it.
Maximum June or July..

Ethereum (ETH/USDT) Breakout Watch ! Hello traders here is KingPro's analysis on Ethereum
📈ETH is at the critical resistance level strong closing above it could tiger a bullish move.
Current Price: $2,628
EMA 70 Support: Price is holding above the 70-period EMA ($2,577), showing bullish structure.
Support Zone: The area around $2,320–$2,400 is acting as a strong historical support, confirmed multiple times.
Supply Zone: Consolidation occurred near $2,570–$2,620, but price has broken above it — indicating accumulation.
Critical Resistance Area: Around $2,780–$2,800. This is a key level — a breakout above could lead to strong bullish continuation.
Next Target: $2,782.93 – price may retest this resistance as indicated by the projection arrow.
📊 Trade Idea:
If ETH sustains above $2,620 and breaks the short-term channel resistance, a move toward $2,782+ is likely.
🔒 Risk: A breakdown below the EMA or the supply zone (~$2,570) could invalidate the setup.

ETH 3D – Between Panic and Balance
When panic hits, zoom out and try to find balance.
ETHUSDT on the 3D timeframe just had its strongest rejection from the 200MA in this rejection series that started on May 13—exactly one month ago.
Price is now once again retesting the 0.5 Fib, continuing the same retesting pattern that began on May 13.
Touching the 200MA often triggers profit-taking from traders.
On the macro side, recent events are causing panic and prompting sell-offs.
Now let’s see if hitting the 0.5 Fib will bring buyers back in.
Looking at the volume bars from the past month, buying volume is increasing while selling volume is declining . This could suggest that in this choppy range, sellers are stepping back while buyers are starting to build strength.
MLR = SMA = BB center, confirming the current sideways environment.
The 50MA hasn’t even started to flatten—it’s still pointing down.
Always take profits and manage risk.
Interaction is welcome.

ETHUSDTIt will go to 2000 FVG after consolidating I might go back to 3000.
It probably will not come to 1600. More likely Go to 3000.

Ethereum Set To Continue Lower, How Long?The drop is now confirmed and yet, it is still early...
Good afternoon my fellow traders, all is good when we consider the chart, Ethereum's price and the bigger picture, nothing changes. But we are witnessing a retrace. This retrace will end in a higher low and I am thinking of time now, duration.
Initially I was thinking about the Fed meeting and this event being the catalyst for change, but the Cryptocurrency market is following its own cycle and for it to be super bullish later this year, all bearish action, all weak hands, needs to be removed now, today.
So the bearish action can fluctuate between just a few days, 3-5 days, to 1-2 weeks. That's my analysis based on past history, chart data and experience.
The retrace might not last that long though, market conditions continue to improve and Ethereum might not produce a lower low compared to Bitcoin. Bitcoin is trading pretty high and a correction can develop any day. Since Ethereum is already low compared to its ATH, there is less room for prices to move lower, makes sense?
The downside is always limited, SHORTing is riskier than going LONG. It is wise to wait for a new entry before buying more. Experienced traders are recommended to SHORT. This chart setup will change in a matter of days, and then the market will turn bullish again, long-term.
Thank you for reading.
Namaste.

Bitcoin's Price Action Reveals A Bearish Ethereum—Back To BasicsBitcoin is bearish, top confirmed; we know Ethereum and Bitcoin move together in the exact same way. This means that Ethereum will also move lower.
Here we have a higher high but lacking strength, volume is dropping. There will be a continuation of the retrace.
Consider waiting (SHORT) until after the FED decision result. The market can remain slightly bearish until after the event. The drop will open the doors for new entry prices. Market conditions can always change.
We are live with a 20X SHORT on Bitcoin, Ethereum will do the same. Just a small drop (can be a strong drop) ending in a higher low followed by a new wave of growth. Not all charts/pairs/projects are the same. Some will move down while others move up. Sell at resistance, buy at support.
Namaste.

This isn’t a breakout. It’s a setup.ETH has been coiling under this level for weeks. While most watch for breakout confirmation — I’ve already mapped the reaccumulation narrative.
The structure:
Price delivered cleanly off a Daily OB and is now grinding through prior inefficiencies. Multiple D FVGs stack just beneath the current zone — not noise, not gaps — these are algorithmic footprints.
Below price? A refined Daily Order Block at 2558, paired with stacked inefficiencies all the way to 2392. That’s the reload zone if price wants to run it deeper.
But the key here is this: price is compressing under draw-level FVGs. Every candle is building imbalance. Every wick is a test. This isn't weakness — it's staging.
Scenario 1:
Minor pullback into local D FVG cluster
Hold above 2580–2600
Reprice into 3030 FVG
Final objective: 3434 sweep and delivery into premium inefficiency (3650+)
Scenario 2:
Sweep below 2580 into full OB at 2558
Sharp rejection
Acceleration through D FVGs above
Mindset:
You don’t chase moves. You wait where Smart Money builds. This isn’t about predicting pumps — it’s about positioning before they become obvious.
“Structure doesn’t lie. Price just tells you who’s in control.”
