Ethereum fees drop to five-year lowEthereum network transaction costs have dropped to a five-year low due to reduced on-chain activity. Currently at $0.168 per transaction, the lower fees reflect fewer people sending ETH or interacting with smart contracts. When usage is high, users bid up fees to speed up confirmations, but the reverse happens when activity declines. While low fees might hinder a price rebound, traders seem to be waiting patiently for global economic uncertainties to pass before increasing their trading frequency in Ethereum and altcoins.
ETHUST trade ideas

Ethereum (ETH): Closed Long in BE, Possible $1,400 IncomingWe closed our long on Ethereum in BE, where, due to a lot of uncertainty in the markets, we are going to look now for a decline in the markets, which should send the price to $1,400.
Although we still see the long scenario playing out, we are going to possibly next enter near $1,680, where, once we see buying volume build further from there, we will look for the fill of the CME gap, but as long as we are below those zones, we will be switching to a short position here.
Swallow Academy

ETH idea for longSo we have EQH, now we are in month bisi, have two patten
1. AMD, we are wait manipulation and break structure for long unicorn stetup
2. without manipulation this mean need search SMT with bct and wait 4h bisi
I hear Trump invest buy eth on 200m usd, this good point for long term position

DIRECTIONAL SHORT BIASsince its a daily configuration, I've decided to look for inner trends in the M5, notice there are 2 entries, its because there are 2 possible liquidity areas to be grabbed first and since theres a open H1 Demand block from prrvious swing, its more likely price is interested to go there. DO NOT ENTER YET

ETH swing Long IdeaI have in mind 2023 Lows, there is a weekly OB before it, so could provide some reaction, but ETH respects more high time frame S/R (support and resistance) so can provide a good trade for spot and perps

ETH-----Sell around 1610, target 1550 areaTechnical analysis of ETH contract on April 16:
Today, the large-cycle daily level closed with a small negative line yesterday, and the K-line pattern was a single negative and a single positive, but the price was still below the moving average. The attached indicator dead crosses and the fast and slow lines are golden crosses, but the pressure is below the zero axis. In this way, the current pullback trend can only be regarded as a correction, because the price has not stood on the moving average and has not broken the previous high. It is easy to fall under pressure for the second time when the indicators are not unified; the current K-line pattern of the four-hour chart has fallen continuously, and the attached indicator dead crosses. The price is below the moving average, and the pressure position of the pullback moving average is near the 1610 area. The short-cycle hourly chart was under pressure in the US market yesterday and was corrected in the Asian time today. The trend pattern is still the same, and the correction pullback cannot be large.
Therefore, today's ETH short-term contract trading strategy: sell at the pullback 1610 area, stop loss at the 1640 area, and target the 1550 area;

ETH to ~6k after 1500$ target move is completeETH cycle is similar to 2018-2021
There were 4 movements around Gaussian Channel.
At the movement №4 price dropped back under the Channel.
Since November 2024 after Tripple top formed on ETH it was clear to me that ETH is going to visit 1500$ region.
However don't think that when movement number 4 is complete then we will have another year of bullishness.
Since 2018 bottom to nov. 2021 passed 1064 days. In current cycle since summer 2022 until today already passed 980 days. This cycle clearly is much weaker. We don't have much time left for Ethereum growth.
As soon as movement №4 is complete (around march-april) we see strong and fast growth approx. until summer. This move can bring ETH price to 6k or even higher.

Ethereum (ETH): Buyers Losing Dominance....Might Fall To $1,400Ethereum might see one nasty fall pretty soon with the current dominance that sellers are showing on the markets.
Despite having a HUGE CME gap, we do not see any signs of recovery after yesterday's choppy movement, where price got rejected from 100EMA.
If we see further pressure from sellers just like that, we will see $1400 pretty soon, leaving the CME gap for later.
Swallow Academy

DeGRAM | ETHUSD Breakout of the Downward Wedge📊 Technical Analysis
ETH broke out of a falling wedge and is testing resistance at $1 685. A breakout confirms bullish momentum.
💡 Fundamental Analysis
Staking yields are projected to exceed U.S. interest rates by mid-2025, attracting more investors.
✨ Summary
Technical breakout + rising staking yields = strong upside potential. Watch $1 685 for confirmation.
-------------------
Share your opinion in the comments and support the idea with a like. Thanks for your support!

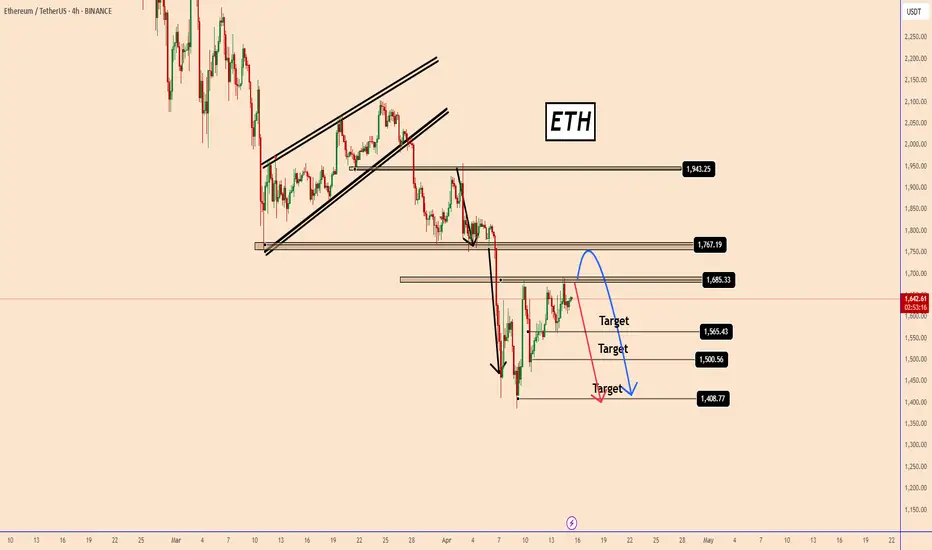
ETH Analysis: Bearish Outlook ETH Analysis: Bearish Outlook
From previous price movements, ETH has shown strong reactions after retesting key structural areas. It tested 1943 before pulling back, and after breaking 1770, the decline accelerated.
Currently, ETH tested 1685 and is expected to move lower again. If it manages to rise slightly, it should not surpass 1770, which serves as a major resistance level. If it reaches this zone, the bearish wave could begin under a second scenario.
Overall, this reversal is taking place within a tight reversal zone, with price shifts limited to about 5% between key levels.
The bearish movement is anticipated to unfold as shown in the chart.
You may find more details in the chart!
Thank you and Good Luck!
❤️PS: Please support with a like or comment if you find this analysis useful for your trading day❤️
ETHUSDT: No Bottom yet, Bears still in control?Hey Realistic Traders, is ETHUSDT just a dead cat bounce, or are we looking at an actual reversal? Let’s dive in...
Since March 26, 2025, ETHUSDT has struggled to break above the EMA100 line, signaling a bearish trend. Additionally, a symmetrical triangle pattern has broken to the downside, further confirming bearish momentum.
The Stochastic indicator has crossed and is moving downward within the neutral zone, confirming that selling pressure may continue.
These signals indicate that Ethereum could drop toward our first target at $1,403. After hitting this level, a short pullback is likely as traders take profits, before the price potentially continues its descent toward a new low around $1,239.
These targets were identified using a combination of Fibonacci ratios and classic support/resistance levels, as shown in the chart.
This outlook remains valid as long as the price moves below the stop-loss level at 1,754.
Support the channel by engaging with the content, using the rocket button, and sharing your opinions in the comments below.
Disclaimer: "Please note that this analysis is solely for educational purposes and should not be considered a recommendation to take a long or short position on Ethereum.

ETH | Position SetupNew safe setup based on fundamentals & market structure.
🧠 Ethereum is still the market’s tech locomotive — accumulating capital, awaiting major updates (ETF, staking, etc.).
Entry: $1,600
DCA: $1,155
Estimated liquidation: ~$790
⚙️ Execution:
30% at market
50% limit buy
20% margin addition
🎯 Take-Profit Strategy:
TP1: $2,066 (+78%) → 20%
TP2: $2,486 (+156%) → 30%
TP3: $3,050 (+263%) → 40%
TP4: open → 10%
⭐️ High R/R setup with max drawdown control and clean 3.3x potential.

ETHUSDT Potential DropHello there,
ETHUSDT appears bearish on the H1. The price has the potential to rise briefly and then turn bearish near or within the area of 1613.84, potentially dropping to 1525.06, with a bias of 1370.56.
Happy trading,
K.
Not a trading advice

ETH Possible breakout pendingIf BTC doesnt screw this up we have a solid chance of breaking out on 4hr TF of ETH/USDT based on:
- Previous retest of the 1680 - 1690 resistance leading to continued higher lows, &
- RSI trending upwards.
- Another retest is coming
Invalidated if:
- We fall off directly from the structure being formed here.
- Retest at resistance (1680) & being unable to penetrate, which imo will lead to accelerated bottom retest.
Important: ETH/BTC is still on command breathing with not many signs of flipping the trend.
Interesting to see how this plays out.

Ethereum (ETH): Seeing Buying Pressure | Buy Entry ActivatedEthereum has broken our buy entry zone and retested it properly, and now we are looking to see further movement to upper zones here, which would lead the price to the 200EMA line.
If all goes as planned, we should see a target of 25% reached; liquidity of BTC has to flow now into ETH.
Swallow Academy

ETHUSDT soon above 2200$AFter huge fall in previous months now the whales are ready to buy back tokens and market and let it rise once again this time pump can continue or it may be short-term but no worries we are opening buy here and set target to close to decrease the risk and even short-term range can hit our target near 2200$.
DISCLAIMER: ((trade based on your own decision))
<<press like👍 if you enjoy💚

ETH Daily AnalysisEthereum Technical Outlook 🧠
ETH is currently in a downtrend on both the daily and 4-hour timeframes 📉.
The $2100–$2150 range, which previously acted as a major support level, has now turned into a key resistance zone 🔄.
Price is moving within an ascending channel 📈 and approaching a supply zone located between $1790–$1820 🟥.
For a confirmed trend reversal, Ethereum must break above the red descending trendline 🔻 and flip the key resistance zone (marked on the chart) into support ✅.
Until then, bearish momentum remains dominant.

Ascending Triangle to 2k or 1.3k! Bears or bulls?! I’m bullish as ever with this ascending wedge! 1.99k target for longs, 1.3kish for bears. Daily and weekly RSI and LSMA levels completely oversold and in a perfect buy zone opportunity!

Are we expecting 73% or 75% Drop for ETH just like before? Just like on march 2020 was drop to 73%, and now we probably expected to drop till next year

ETH/USDT Breaks Uptrend – Key Retracement Zone in PlayETH/USDT has broken its recent uptrend and is now entering a correction phase, approaching a key retracement zone around the $1,630 level. This area has acted as strong support in the past and could become a critical decision point for price action. If the level holds, it may trigger a continuation of the broader bullish trend. However, a breakdown below this zone could open the door for a deeper pullback. Monitoring closely for confirmation and market reaction.
Trade safe, Joe.

ETH is fighting in the support zoneHello everyone, I invite you to review the current situation on ETH. When we enter the one-day interval, we can see how the ETH price moved in a strong downtrend channel. What's more, we can see that the price fell below the main uptrend line.
As we can see, the price is currently fighting to break out on top in the support zone from $ 1690 to $ 1350, in a situation if this zone was broken, we could see another strong drop to the support area at $ 884 at the previous low after the bull run.
On the other hand, if ETH gets wind in its sails again, it must first pass through the resistance zone from $ 1952 to $ 2100, while further on there is a very strong zone from $ 2500 to $ 2740.
However, here, taking into account the one-day interval, the RSI indicator shows a breakout above the top of the border, which may affect the potential end of the current uptrend.

$ETHUSDT Bearish downtrend Analysis:Join our community and start your crypto journey today for:
In-depth market analysis
Accurate trade setups
Early access to trending altcoins
Life-changing profit potential
Let' analyse ETHUSDT:
Ethereum has been consistently respecting a strong descending channel and 21-day EMA since its peak earlier this year. Each lower high has led to a significant drop, creating a pattern of bearish rallies followed by sharp corrections. Let’s break it down:
Bearish Wave Structure:
ETH has seen four major drops off this trendline:
-28.55%
-34.03%
-30.56%
Each time price approached the trendline, it faced heavy resistance, leading to these sharp declines — forming a repeating structure of lower highs and lower lows.
Current Setup:
ETH is now again testing the descending channel and 21 day EMA, mirroring previous price behavior. This is a key decision point.
Technical Observations:
Price is approaching horizontal resistance, 21D EMA, and the channel upper line.
Rejections from this area have historically triggered steep drops.
The downtrend remains intact unless a clean breakout occurs.
What to Watch For:
Rejection Zone: ~$1,750–$1,730 (previous horizontal rejection zones + channel).
Confirmation of Breakout: Daily close outside channel and above 21D EMA with follow-through volume.
Breakdown: Failure to break and bearish engulfing near resistance could signal another wave down.
Conclusion:
ETH is at a critical resistance confluence. While a breakout would be a significant technical shift, the current trend favors caution. Watch closely for confirmation signals before positioning.
If you find this analysis helpful, please hit the like button to support my content! Share your thoughts in the comments, and feel free to request any specific chart analysis you’d like to see.
Happy Trading!!

Head and shoulders on eth?🕰️ Timeframe: 4H
📈 Pattern: Inverse Head & Shoulders (Bullish Reversal Setup)
📍 Current Price: $1,518
📏 Neckline: ~$1,589 (marked in blue)
🧠 Pattern Structure:
Left Shoulder: ~$1,475
Head: ~$1,420
Right Shoulder: ~$1,470
Neckline: ~$1,589
Measured Target: Neckline to bottom = ~$1,589 - $1,420 = $169
→ Breakout Target = $1,589 + 169 = $1,758** — aligns with Fib 0.65 ($1,762)**
🧩 Confluence Factors:
🔹 Fibonacci 0.65 @ $1762 = Target zone of the pattern
🔹 Fibonacci 0.618 @ $1915 = Secondary resistance zone
🔹 Clean neckline retest idea → breakout & retest of $1589 = ideal entry trigger
🔹 RSI divergence (if any) & volume confirmation on breakout = final confidence boost
✅ Strategy Plan:
Entry Idea: Break & retest of $1589
Take-Profit: $1758–1766
Stop-Loss: Below right shoulder ($1465–1470 zone)
Risk/Reward: ~2.5R depending on entry accuracy
Probability: 65/35 bullish continuation if neckline breaks with strong volume
