Possible $ETH shortPossible CRYPTOCAP:ETH short with tight invalidation
Approaching supply levels and forming a symmetrical triangle
ETHUST trade ideas

ETH/USDT what next ? possiblity ? probabilieslets find how to enter in market where are the reclaimed area it can help to to getting in to market with shortterm and profitable entries now advises just for knowledge
ETH USDT Umbrella patternPrediction: an umbrella. Markets sometimes are symmetric, this time it might print an umbrella.

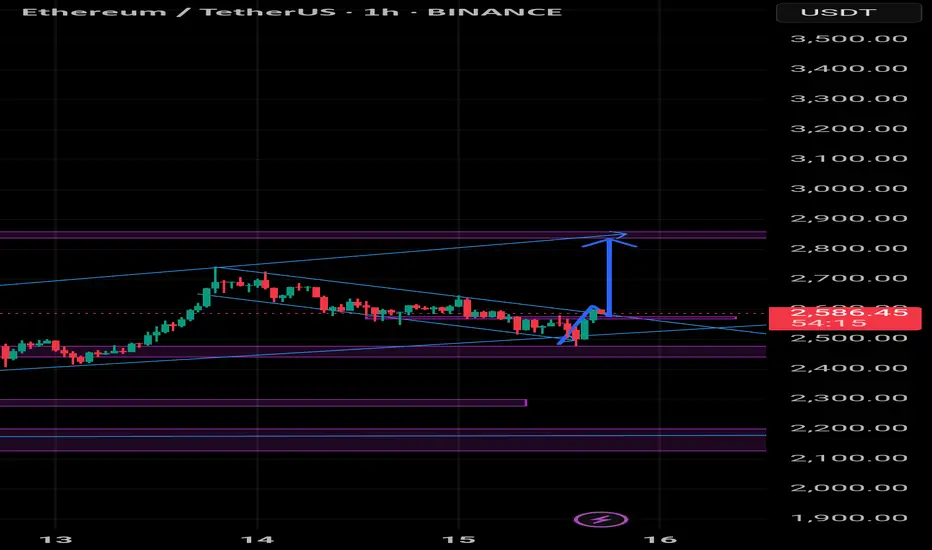
2025.05.18 ETHEREUM Short-term long positionWe are the SeoVereign Trading Team.
With sharp insight and precise analysis, we regularly share trading ideas on Bitcoin and other major assets—always guided by structure, sentiment, and momentum.
🔔 Follow us to never miss a market update.
📈 Ethereum (ETH) Long Position Outlook
Ethereum is currently one of the most difficult assets to predict in terms of direction.
Recently, it has shown frequent irregular movements, which—while unpredictable—can be attractive from a short-term trading perspective due to the increased volatility.
From a technical standpoint, Ethereum appears to have completed its B wave.
When measuring the 5-wave structure using trend-based Fibonacci extension, the B wave concludes near the 0.786 level.
This 0.786 extension is a custom wave ratio developed by the Seovereign team and has shown strong reliability in live trading scenarios.
To avoid visual clutter on the chart, we have chosen to highlight only the most important 0.786 level in this analysis.
All detailed wave counts and ratios have been marked on the chart, so feel free to refer to them for more specifics.
🎯 Target Levels
1st Target: 2,555
2nd Target: 2,589
3rd Target: 2,624
Due to the high volatility, the potential for opportunity is also high—but proper risk management remains essential.
This zone is considered a technically valid entry point for a long position.
Approach the market with flexibility and strategic focus.

ETHUSDT.P~We are In Accumulation To Seek Liquidity SSL/4D Maybe (2314)
~If We are "Respected" Next target Is IPDA 40
~ Maybe To Next Week

Ethereum (ETH): Major Target Reached | Time For Correction |Ethereum did really good movement where we broke the 200EMA mark and also reached our target area. Now that we have reached this area, we are looking for proper rejection from here, which would correct the RSI and give us another opportunity to get back to current zones and break it properly!
Swallow Academy
Bump and Run Reversal Bottom Pattern (BARR)Ethereum on Daily Tim Frame formed a bump and run reversal bottom pattern which is a bullish reversal pattern. During the beginning of the pattern, price often follows a down-sloping trendline that ranges from 0 to 45 degrees or little more in rare cases. Afterwards, a sharp decline in the price of an asset happens that is often followed by a relief bounce till the price touches key resistance level. A breakout above this key resistance level confirms the validity of Bump and Run Reversal Bottom Pattern.
Ethereum broke the key resistance level and we are expecting the price to retest the broken structure and trendline before it continues to upside and the target price measured from Lead In phase. In this scenario Ethereum looks more bullish then ever and all Atl coins will follow suit.
Also Ethereum’s major Pectra upgrade, combining Prague and Electra, went live on May 7, 2025. It introduced 11 key changes to improve speed, cost-efficiency, and usability which helped the price of Ethereum to bump to the upside.

#ETH reaches target zone 📊#ETH reaches target zone ✔️
🧠From a structural point of view, the long structure we built in the daily buy zone has been fully achieved and is about to touch the original upward trend support line (now turned into resistance line). Therefore, there is a possibility of a pullback, so please be cautious in chasing the rise.
➡️If we do not fall back from here and continue to rise, then the next heavy resistance level worth our attention is around 2500.
➡️Today I have sold all 20% of the purchases in March. I will look forward to a pullback. The best case scenario is that the price will return to the daily buy zone again and buy back the positions sold today.
Let's see if the market will give us such an opportunity👀
🤜If you like my analysis, please like💖 and share💬
BITGET:ETHUSDT

ETH/USDT: BULL FLAG BREAKOUT!!🚀 Hey Traders! 👋
If you’re finding value in this analysis, smash that 👍 and hit Follow for high-accuracy trade setups that actually deliver! 💹🔥
🔥 #ETHUSDT UPDATE – Ready for the Next Leg?
ETH surged nearly 48% recently and is now consolidating inside a clean parallel channel. After a healthy sideways move, price is starting to push the upper resistance again — a breakout from here could trigger the next rally phase! 🚀
🔸 Pattern: Bullish Flag/Parallel Channel
🔸 Current Structure: Post-pump consolidation
🔸 Watch for: Break above the upper yellow line for confirmation
🔸 Targets: $2,750 – $2,880+
🔸 Invalidation: Break below channel support and $2,430
📈 If bulls hold this zone, we could witness another explosive move! Keep it on your radar.
💬 What do you think? Is ETH gearing up for a breakout? Drop your thoughts below!
📌 Follow for more high-probability setups!

$ETH Cooled Off After Pump – Healthy Correction Ahead?CRYPTOCAP:ETH pumped hard and touched $2,738 but now it’s pulling back a bit.
If you look at this 6H chart, you’ll notice price didn’t really take a healthy pause on the way up.
It just went straight up.
In my opinion, a pullback toward the $2,100–$2,150 zone would actually be a good thing. That area lines up with multiple supports, EMAs, previous breakout, and trendline, so it’s strong.
This type of dip could reset the momentum and build a base for the next rally.
Stay tuned and follow for more updates!
#Ethereum #ETHUSD #ETHUSDT

ETHUSDT Breakout & Retrace: Watching the $2,200 Buy Zone!Hey Traders,
In today's session, we're keeping a close eye on ETHUSDT for a potential buying opportunity around the $2,200 zone. After trending downward, Ethereum has successfully broken out of its downtrend and is now undergoing a correction. It’s currently approaching a key support/resistance area at $2,200, which could act as a strong retracement level.
As always, trade safe.
Joe

ETH => Shift In Momentum Almost Done!Hello TradingView Family / Fellow Traders. This is Richard, also known as theSignalyst.
📉 Since breaking below its last major low in December 2024, Ethereum (ETH) has been stuck in a bearish trend.
But don’t lose hope, bulls! 🐂
⚠️It’s evident from the last correction phase, marked in blue, that it's larger than the previous ones — a clear sign that the bulls are stronger than ever.
A growing correction phase is often the first signal of an upcoming momentum shift.
This shift will be confirmed once ETH breaks above the last major high marked in red at $2,100.
📈A break above $2,100 would flip ETH’s trend from bearish to bullish, signaling the potential start of the Altcoin season!
Until then, patience is key. 🧘♂️
📚 Always follow your trading plan regarding entry, risk management, and trade management.
Good luck!
All Strategies Are Good; If Managed Properly!
~Rich

Ethereum Ethusdt Elliott wave impulse
Altseason in July
1bearishing all market
2bitcoin season
3altseason
Don't miss Ethereum todayHello friends
Given the good rise we had, you can see that the price has entered a correction and has provided us with a good opportunity to buy in steps, of course with capital and risk management.
*Trade safely with us*

ETH ANALYSIS (12H)This analysis is an update of the analysis you see in the "Related publications" section
Ethereum has finally reached the flip zone.
Pay close attention: Ethereum dominance is sitting on monthly support, which is a level with strong bounce potential.
We have two possible scenarios for Ethereum | either it breaks through the flip zone, or it makes a correction and turns bullish again from around the bottom.
⚠️ What’s clear is that shorting Ethereum is risky and doesn’t make sense!
For risk management, please don't forget stop loss and capital management
When we reach the first target, save some profit and then change the stop to entry
Comment if you have any questions
Thank You

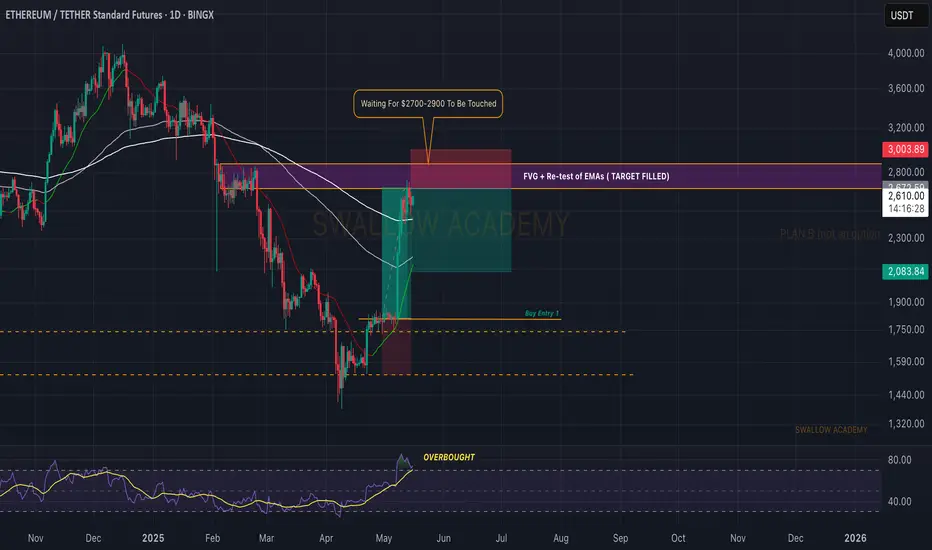
Ethereum (ETH): First Signs of Weakness, We Will Drop SoonEthereum is still showing strong sentiments where, despite smaller corrections, we had buyers overtake current zones again and now are leading to another upward movement, which might possibly fill our target area of $2700.
As long as we are not near this zone, we are going to just wait or if we see another wave of sell-off with proper MSB and retest.
Swallow Academy

Ethereum Trap Play Complete – Time to Pump!Trap + deviation strategy in play!
Price faked out below structure, collected liquidity, and reclaimed trendline.
Expecting ETH to continue bullish inside the rising channel.
Target: $2738 | SL: Below $2500

ETH/USDT – Bullish Momentum into Major ResistanceEthereum continues to show bullish strength, trading above the 200-day moving average. Price action is now approaching a high-confluence resistance zone around $2,800, which could trigger the next major move.
Key Highlights:
Support: 200-day MA continues to hold with 3 daily closes above
Resistance: $2,800 zone = 0.618 Fib + Weekly SR + Value Area High
Structure: Higher highs and higher lows intact on the daily timeframe
Technical Breakdown:
ETH is currently holding strong above the 200MA, confirming bullish structure with a series of higher lows. Immediate resistance lies at the $2,800 zone, which aligns with several key levels, making it a critical decision point. A breakout above this area with strong volume could push ETH toward new local highs.
Conversely, failure to break $2,800 could result in a rotation back toward $2,000, where the last major support and psychological level sits. This would offer a strong “buy-the-dip” opportunity, especially if the trend remains intact.
Bias:
Bullish above 200MA — watching for reaction at $2,800 to confirm continuation or retracement.

Ethereum (ETH): Almost Reached Major Target | $2,700-2,900Ethereum has made an amazing move since the breakout from our buy entry zone. We are almost there, at our major target zone, which is near the upper resistance zone, where we are expecting to see some sort of smaller rejection and correction, which would reset the RSI into sideways movement.
Swallow Academy

ETH IS SHORT TIMEEthereum (ETH) recently enjoyed a strong bullish run, capturing investor excitement and surging in value. However, after the rally, it’s now pausing—consolidating gains and catching its breath. This cooldown is natural and healthy for long-term growth, setting the stage for potential future moves with renewed strength and stability.

ETH Overextended: Eyeing a Retracement from Key Liquidity ZoneTechnical Analysis: ETH/USDT Daily/4H and 30m Chart 🚨
Ethereum (ETH) has experienced a powerful rally, surging from the $1,900 region to above $2,500 in just a few sessions. This explosive move has pushed price into a previous area of significant resistance, where a large liquidity pool is likely sitting. The current daily candle structure shows signs of hesitation, with smaller bodies and wicks indicating potential exhaustion at these highs.
Given the overextended nature of this move 📈 and the fact that ETH is now trading at a premium relative to its recent range, a retracement back toward equilibrium is probable. If price action breaks below the current range low (the most recent swing low on the daily), this could confirm a distribution phase 🏦 and open up a short opportunity.
I'm watching for a clear break and close below the range low to trigger a potential short setup. My expectation is for price to revisit the mid-range or even the origin of the recent rally, where demand may step in again. Until then, patience is key—let the market show its hand before entering.
Key Points:
ETH is overextended and trading into previous highs with heavy liquidity 💧
Signs of exhaustion are emerging at the top of the move
A break below the current range low could confirm distribution and offer a short setup 🔻
Targeting a retracement toward equilibrium, possibly the $2,000–$2,200 zone 🚨

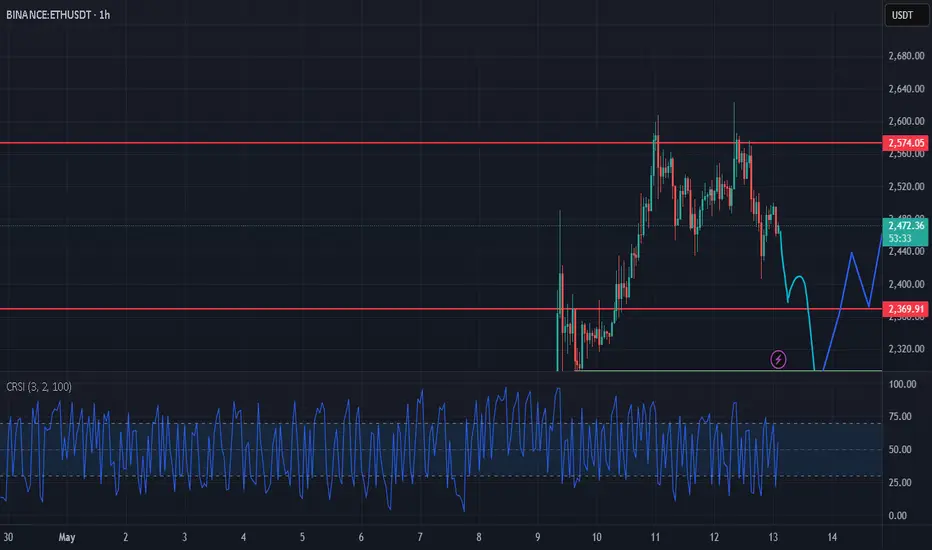
Ethereum (ETH): Targeting Bearish CME Gap | $2,349Ethereum is heading towards our target zone, where we will be looking for another support to form and an upward movement to start from there. We will not try to catch that movement here to downward movement but rather wait for our CME to be filled and then look for a buy entry once again.
Swallow Academy
