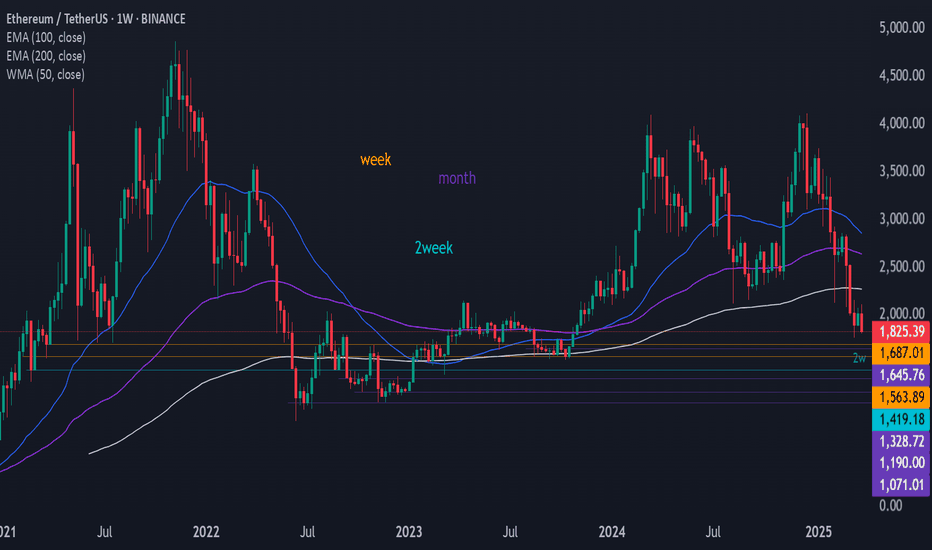
ETH Possible 300% in 2025 but with a short-term turbulenceETH/USD chart looks very bullish at first glance but if you look closer then you might find some bearishness in the short-term
ETH formed double TOP in the spring time and since then it was in down trend.
Current up move for me seems like just retest of July high.
In the upcoming alt-season ETH will lead the market but before that it may drop much lower into 1500-2000$ region.
From that place, while panic on the market ETH can easily make x2-x4
Patience! Wait until good entry point come to you
ETHUST trade ideas
ETH - Bearish Reversal Expected from FVG ZoneIn this 1-hour chart analysis of ETHUSDT on Bybit, we observe a potential price reaction from a Fair Value Gap (FVG) zone. The current downtrend has left an imbalance in the market, and price is retracing towards the 0.618 - 0.65 Fibonacci retracement levels , which align with the FVG area.
Key Observations:
🔹 Market Structure: The price is in a bearish trend, forming lower highs and lower lows.
🔹 FVG & Fibonacci Confluence: A strong resistance zone is marked within the $1,980 - $2,000 range, coinciding with the Golden Pocket (0.618 - 0.65 Fib levels) .
🔹 Expected Price Action:
- A bullish retracement ( green path ) into the FVG zone.
- A rejection from this resistance area, leading to a continuation of the downtrend ( red paths ).
- Potential targets for the drop are around $1,860 - $1,800 , aligning with previous liquidity zones.
Trading Plan:
📌 Short Entry: Around $1,980 - $2,000 if rejection signs appear.
📌 Stop Loss: Above $2,020 to invalidate the bearish setup.
📌 Target: $1,860 - $1,800 based on historical support levels.
This idea is based on market imbalance and liquidity dynamics , so watching for confirmation before entering a trade is crucial. 🚀🔍
#ETHUSDT is showing a reversal pattern📊 BYBIT:ETHUSDT.P is showing a reversal pattern — we expect the uptrend to continue if the breakout level holds!
🕒 Timeframe: 4H
➡️ BYBIT:ETHUSDT.P has formed a potential Double Bottom (Bottom 1 and Bottom 2) around $1,785–$1,809, indicating a possible trend reversal.
➡️ The key trading range (POC — Point of Control) is at $1,881.71, making it a major resistance level.
➡️ The price is also bouncing off the support zone, which aligns with the previous consolidation area.
➡️ Volume is increasing during the bounce, confirming buyers’ interest.
⚡️ Considering a potential long entry
⚡️ Maximum target based on the pattern — $2,522
📍 A breakout and hold above $1,849.71 will confirm the bullish scenario and attract more long liquidity.
📢 If the price drops below $1,785, the setup will be invalidated — high chance of a continued downtrend.
📢 The rise of BYBIT:ETHUSDT.P is possible due to reactions to the strong support zone and the forming Double Bottom pattern.
🕒 Timeframe: 1H
➡️ BYBIT:ETHUSDT.P has formed a Falling Wedge , which is a bullish pattern.
➡️ A second bottom ( Bottom 2 ) has formed, confirming a potential reversal.
➡️ The upper boundary of the wedge has already been broken, accompanied by a spike in volume.
➡️ A strong consolidation zone exists around $1,808–$1,820 — a retest could confirm a long entry.
⚡️ Holding above the wedge breakout is a signal for further upside.
📢 If the price falls back below $1,800 and buying momentum weakens — the scenario should be reconsidered.
📉 LONG BYBIT:ETHUSDT.P from $1851.0
🛡 Stop loss: $1835.00
🕒 Timeframe: 1H
🎯 Targets (TP):
💎 TP 1: $1860.00
💎 TP 2: $1871.00
💎 TP 3: $1882.00
💎 TP 4 (long-term target): $1890.00
🚀 BYBIT:ETHUSDT.P is maintaining a potential reversal pattern — we expect upward movement if volume confirms!
Order block at discount zone for ETHBetween 1850 and 1750 is the discount zone for eth right now. If it fails to hold this zone massive drops will happen.
However a rebound is more likely due to RSI being so low at this time.
4 hour chart broke thru 2 buy zones to his this discount spot and we could see prices ranging from 1850 to 2060
Be are on lower time frames and traps
Good luck
ETH: Possible Scenario!Hello Traders,
Here's a quick update on ETH in the weekly timeframe.
ETH is currently in a downtrend, trading at $1,890. It has already faced a 57% drop, and the trend is likely to continue.
Based on this weekly analysis, I expect ETH to drop to $1,400, where we have a support level. In a worst-case scenario, it could fall to $1,000. A rebound toward $2,200 is possible from the current market price, but it may not sustain for long.
Conclusion:
✅ Potential Accumulation Range: $1,000 - $1,400
✅ Lower Support: $1,000
Note: Always do your own research and analysis before investing.
ETH-----More around 1865 target 1800 areaTechnical analysis of ETH contract on March 30: Today, the large-cycle daily level closed with a small negative line yesterday, the K-line pattern continued to fall, the price was below the moving average, and the attached indicator was running with a golden cross and shrinking volume. The big trend was still very obvious, but I would like to remind you that the current price deviates from the moving average, and if there is a rebound trend in the future, it is also a correction trend. Don't be misled; the short-cycle hourly chart showed that the European market fell and the US market continued to break the low yesterday, and the morning support rebounded and corrected. The current K-line pattern continued to rise, and the attached indicator was running with a golden cross, so it still needs to be corrected within the day, and the high point of the US market correction yesterday was in the 1865 area.
Today's ETH short-term contract trading strategy: sell at the rebound 1865 area, stop loss in the 1895 area, and target the 1800 area;
ETH as well in a big opportunity as btc eth is in a big ascendant channel, where is formed a big falling wedge inside the channel, we are now on the support of the channel and of the wedge, so should be a nice level hard to let it down, there is even fib retracement to fill the gap formed, so i expect eth a nice move of 20/30% if trump doesnt say shit as every day of his life !!! trade safe and open a max leverage of 10x
ETH USDT NEXT MOVESell after bearish candle stick pattern, buy after bullish candle stick pattern....
Best bullish pattern , engulfing candle or green hammer
Best bearish pattern , engulfing candle or red shooting star
NOTE: IF YOU CAN'T SEE ANY OF TOP PATTERN IN THE ZONE DO NOT ENTER
Stop lost before pattern
R/R %1/%3
Trade in 5 Min Timeframe, use signals for scalping
ETHUSDT NEXT MOVESell after bearish candle stick pattern, buy after bullish candle stick pattern....
Best bullish pattern , engulfing candle or green hammer
Best bearish pattern , engulfing candle or red shooting star
NOTE: IF YOU CAN'T SEE ANY OF TOP PATTERN IN THE ZONE DO NOT ENTER
Stop lost before pattern
R/R %1/%3
Trade in 5 Min Timeframe, use signals for scalping
ETH(20250329) market analysis and operationTechnical analysis of Ethereum (ETH) contract on March 29: Today, the large-cycle daily level closed with a medium-yin line yesterday, the K-line pattern continued to be negative, the price was below the moving average, and the attached indicator was golden cross and running with shrinking volume. The decline in the general trend was still relatively obvious. The previous corrective rise was also to lay the foundation for the second decline. This point is very clear, so we are still firmly bearish in the direction; the support position below that needs to be paid attention to is near the 1750 area; the short-cycle hourly chart yesterday's price fell and broke through the previous low position, and the morning support rebounded and corrected. The current K-line pattern is continuous and positive, and the attached indicator is running with a golden cross. It needs to be corrected during the day, and the correction high pressure position is near the 1920 area.
Today's ETH short-term contract trading strategy: sell at the rebound 1920 area, stop loss at the 1850 area, and target the 1860 area;
ETH - Nice Prediction I was expecting a drop. The drop was forming as "3 Fan Principle". The perfect FP didn't happen but the drop was expected. BOOM the drop.
Almost 7% an going on ... 🎯 👌
Original TA here:
Follow for more ideas/Signals. 💲
Look at my other ideas 😉
Just donate some of your profit to Animal rights and rescue or other charity :)✌️
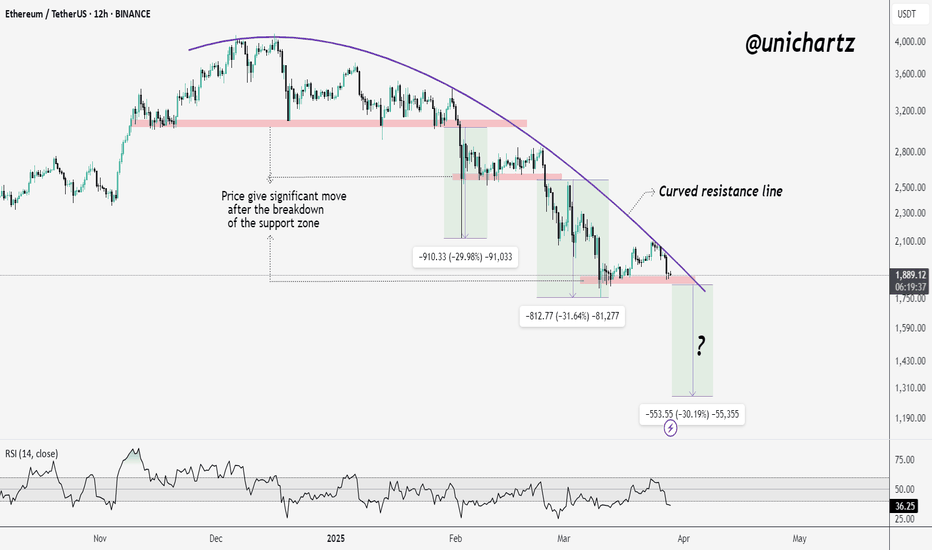
Will Ethereum Survive This Critical Level?Ethereum (ETH/USDT) on the 12-hour timeframe is currently displaying a strong downtrend structure, highlighted by a well-defined rounded top pattern and a descending arc acting as dynamic resistance. Since reaching its peak above $4,000, ETH has consistently printed lower highs and lower lows, respecting this curved resistance line.
The price is currently trading around $1,887, testing a significant horizontal support zone near $1,880–$1,900. This level has held multiple times in the past and now serves as a crucial line in the sand for bulls. If this support fails to hold, Ethereum could see further downside toward the next demand zones around $1,700 or even $1,600.
The RSI indicator stands at 36.11, which suggests that momentum is weak and the asset is nearing oversold territory. While this can often lead to short-term relief bounces, the overall trend remains bearish unless ETH breaks above the descending arc and reclaims key resistance levels near $2,050. A bullish scenario would require strong buying volume and a structure shift to higher highs
ETH USDT Critical Support Under PressureThe analysis for ETHUSDT on the 4-hour timeframe indicates significant bearish pressure as the price approaches a well-defined support zone, where a potential bullish reversal reaction from buyers can be anticipated. Scenarios include either a bounce from the support level with subsequent growth towards the upper resistance zone or a breakdown below, which could signal further trend weakening.
Ethereum Wave Analysis – 28 March 2025
- Ethereum reversed from the resistance level 2120.00
- Likely to fall to support level 1800.00
Ethereum cryptocurrency recently reversed down from the resistance level 2120.00 (former multi-month support from August and February) standing near the 38.2% Fibonacci correction of the downward impulse from February.
The downward reversal from the resistance level 2120.00 stopped the previous ABC correction ii.
Given the strong daily downtrend, Ethereum cryptocurrency can be expected to fall to the next support level 1800.00 (which stopped the previous impulse wave i).


