ETHUSDT 1D AnalysisETH ~ 1D Analysis
#ETH Buy gradually after retesting this support block with a short term target of at least 10%+ from here.
ETHUST trade ideas

2 possible scenariosEthereum may continue to rise after correction waves. I showed 2 possible scenarios on the chart. If you zoom in a little bit more on the graph you can see the ABCDE waves more clearly. I think at least these waves will be completed.
* The purpose of my graphic drawings is purely educational.
* What i write here is not an investment advice. Please do your own research before investing in any asset.
* Never take my personal opinions as investment advice, you may lose your money.

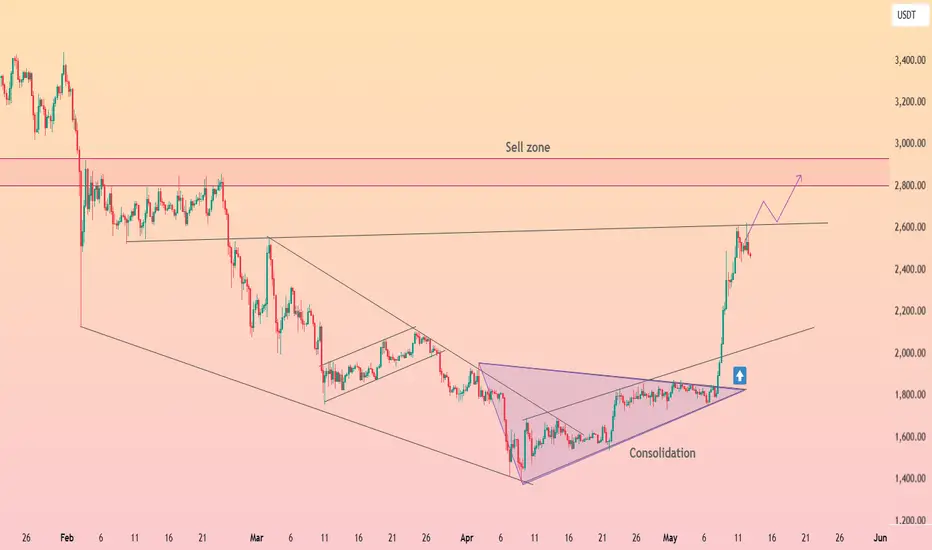
HolderStat┆ETHUSD retest $2500 After months locked inside a broad falling wedge, ETH erupted in early May, blasting through both the wedge roof and an internal consolidation triangle. The vertical thrust carried price from 1.8 k straight to 2.6 k, where a key horizontal lid now tests bulls’ resolve. Short‑term dips back toward the broken trendline or 2.2 k support would look constructive while momentum targets the well‑flagged 2.8‑3 k sell zone overhead. 🎯
Ethereum Approaching Key Resistance – Breakout or Rejection?Ethereum ( CRYPTOCAP:ETH ) has been on a strong upward trend since bouncing from the $1500 zone, and it’s currently trading around $2372. All eyes are now on the next major resistance area between $2600 and $2900.
So what’s next—breakout or pullback?
If ETH can push through this resistance with strong momentum and volume, we could see a continuation toward $3000 and beyond.
A rejection from this level could lead to a dip back toward the $1900–$1700 support range.
My Take: The trend is bullish, but this resistance zone is a key test. A strong close above $2900 would confirm a breakout. Until then, caution and close observation are crucial.
What do you think? Will ETH break through or bounce down from here?
Share your thoughts below!
Kindly support this idea with a LIKE👍 if you find it useful🥳
Happy Trading💰🥳🤗

Don't overlook the buying opportunities that may arise.Hello friends.
The growth that Ethereum has had in the past few days can be up to the range it is currently in.
If you are left with the profit that Ethereum has made in the past few days, you can make your purchases in case of correction.
How long can this correction last?
If Ethereum corrects, you can complete your purchases below the $2,000 range for fair purchases.
Is it possible that it will correct further?
Yes, it is possible that it will correct further, so you can divide the amount of capital you want to buy into two parts, so that the second step is lower in case of correction.

ETHUSDT Breakout & Retrace: Watching the $2,200 Buy Zone!Hey Traders,
In today's session, we're keeping a close eye on ETHUSDT for a potential buying opportunity around the $2,200 zone. After trending downward, Ethereum has successfully broken out of its downtrend and is now undergoing a correction. It’s currently approaching a key support/resistance area at $2,200, which could act as a strong retracement level.
As always, trade safe.
Joe

eth/usdt.30mEthereum analysis on the half-hour timeframe
The analysis relies on trend analysis and support and resistance.
We have three scenarios with conditions.

2025.05.15 ETHEREUMWe are the SeoVereign Trading Team.
With sharp insight and precise analysis, we regularly share trading ideas on Bitcoin and other major assets—always guided by structure, sentiment, and momentum.
🔔 Follow us to never miss a market update.
The progression up to Wave B has been confirmed, and the current technical structure indicates a high probability of entering Wave C.
Accordingly, a short-term long (buy) bias is suggested.
Projected Wave C Targets (Short-Term):
1st Target: 2,599
2nd Target: 2,626
3rd Target: 2,653
Proper risk management is essential upon entry. Monitor closely for potential selling pressure near each target level.
It is also recommended to confirm directional alignment with macro trends and supporting technical indicators.

Is Now the Time for Ethereum to Be Re-evaluated?We are the SeoVereign Trading Team.
With sharp insight and precise analysis, we regularly share trading ideas on Bitcoin and other major assets—always guided by structure, sentiment, and momentum.
🔔 Follow us to never miss a market update.
🔥 As Bitcoin reclaims the 100K narrative, Ethereum is waking up.
In the wake of Bitcoin’s bullish momentum, Ethereum is flashing strong reversal signals.
After a prolonged period of undervaluation and market hesitation, it’s finally time for ETH to be re-evaluated for what it’s truly worth.
At SeoVereign, we’re positioning strategically long on Ethereum, aligning with both technical setups and market sentiment.
This isn't just a short-term bounce—it's potentially the start of a mid-term trend reversal.
🎯 Target 1: 2,566 — Breaking near-term resistance
🎯 Target 2: 2,598 — Key mid-structure objective
📊 Right now, the market is split between the hesitant and the proactive.
We're choosing to be ahead of the curve.
🚀 The SeoVereign Team is here to catch this wave—
Now is the time to ride the ETH long setup.

DeGRAM | ETHUSD the best score among the tops📊 Technical Analysis
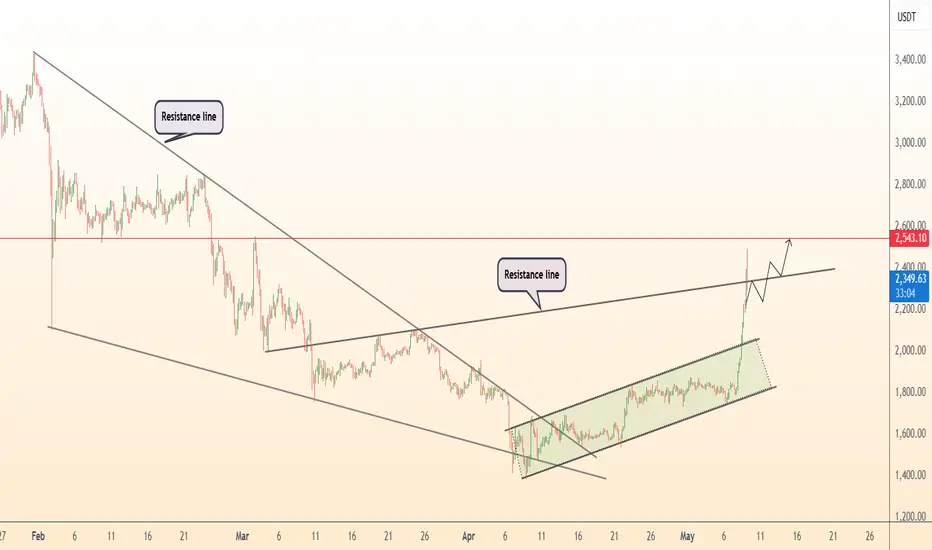
● ETH blasted above the long‑term resistance line of the descending wedge, flipping it to support and signalling trend reversal.
● Price is riding a new rising channel; holding the mid‑channel support level (~$2 300) sets sights on the marked resistance level at $2 540 – 2 600.
✨ Summary
Wedge breakout + renewed ETF optimism favour a short‑term long: objectives $2 540 → $2 600+; strategy invalidated on a sustained drop below $2 200.
-------------------
Share your opinion in the comments and support the idea with like. Thanks for your support!
A bullish divergence on the 1-hour (1H) time frame for ETH (EthePrice chart: ETH has made lower lows over the past few hours.
RSI: RSI shows higher lows during the same period.

ETH/USDTAlt Market on Watch — All Eyes on ETH ⚠️
Despite a strong start to the week, some red flags are starting to show up on the horizon.
The spotlight is on ETH — it’s the key to what’s next for the altcoin market.
In the last update, I shared altcoin levels to work from,
but right now ETH should be your primary reference.
📍 $2400 is a major zone — I’m watching for a reaction there to get aggressive on alt entries.
❌ If that zone doesn’t hold, we’re likely heading down to $2200–2100, possibly even $1900.
No need to overexpose — I’m sitting mostly in cash, waiting for clear signals.
🚫 And most importantly — this is not a short setup (yet).
Let’s wait for the new weekly open before making any big moves.

Ethereum - Sell at high, take long after Sl huntEthereum - Sell at high, take long after Sl hunt
Key zone for short $1869
Key zone for long $1697 or $1581

ETHUSD NEXT MOVE?etherium currently trading at 1800 around and we are looking for buy here and target are 2042

Ethereum's Uptrend Confirmed: Bulls Take ControlEthereum's Uptrend Confirmed: Bulls Take Control
After the FOMC meeting yesterday, ETH started a strong upward move, gaining nearly 8%.
The chances of further growth are increasing.
ETH has already broken out of a solid bullish pattern, signaling more potential upside.
The setup looks promising, and the price is approaching our first target.
You may watch the analysis for further details!
Thank you!

ETH Distribution Playing Out After Clean Accumulation Target HitThis is a follow-up to my last ETH idea, where I called for accumulation and a breakout from the falling wedge — price hit the exact target I mapped out, and since then, the behavior has shifted.
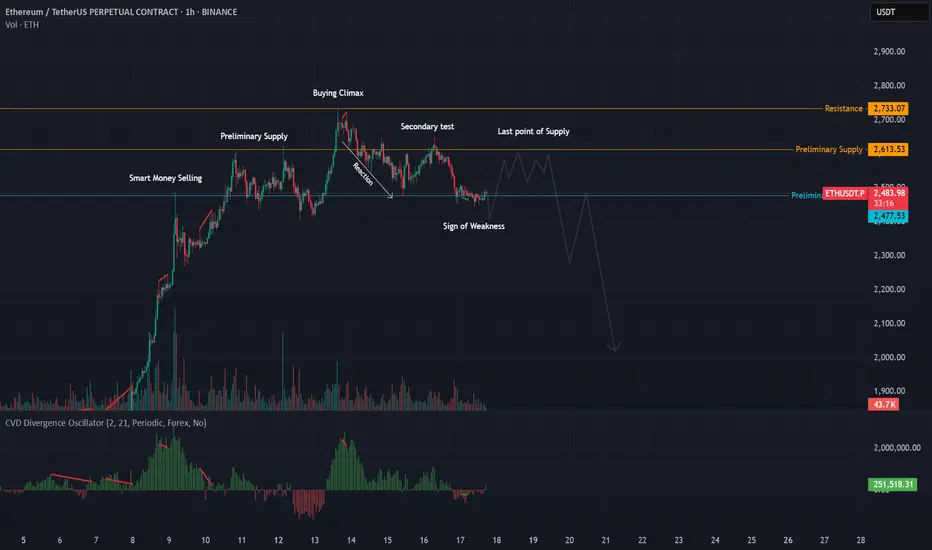
We are now seeing the classic signs of distribution forming. It began with smart money stepping in selling into strength, which led into preliminary supply . That was followed by a strong climatic volume push into a buying climax , the heavy volume came in right at the top, and since then, we’ve seen a reaction down, a weak bounce ( secondary test ), and now a potential sign of weakness.
The delta has been confirming the distribution as well. It showed bearish divergence at the buying climax , showing aggressive selling happening even as price pushed up. Now with this move down, we’re seeing increasing negative delta confirming supply is in control. Volume is also heavier on the drops, confirming distribution rather than re-accumulation.
After a sign of weakness like this, we usually get one more push up into a last point of supply — a weaker rally that gets sold into before the real markdown begins. Be aware of a possible trap move above the secondary test or buying climax , but the structure suggests the highs are likely in for now.
Whether this plays out clean or gets messy with one more fakeout, the context has seemd to shift. Smart money appears to be offloading, and delta continues to confirm it. Bias flips bearish until proven otherwise.
Overall, I believe the recent up move was a stop hunt and ETH has much more downside ahead.
Short trade
1Hr TF overview
🟥 Sellside Trade Log
📉 Pair: ETH/USD
🏷️ Type: Intraday | Tokyo Session PM
🧠 Setup: Breakout (Shelf Method)
🆔 Trade ID: #ETHUSD-0514A
📅 Date: Wednesday, 14th May 2025
🕘 Time: 9:00 PM
🔹 Entry Price: 2,585.17
🔹 Profit Target: 2,456.05 (-4.99%)
🔹 Stop Loss: 2,600.06 (+0.58%)
🔹 Risk-Reward Ratio: 8.67
🔍 Reasoning:
A sellside breakout trade was initiated after the price broke decisively below a key horizontal shelf support level, confirming bearish continuation. The shelf method was used to identify price consolidation just above support, followed by a sharp breakdown, signalling a shift in directional bias. Order flow and structure supported a downside expansion, with the entry positioned to exploit clean inefficiency beneath the base.

Going Short on EthereumBINANCE:ETHUSDT
Ethereum has moved up strongly in the last 6 weeks to a key resistance level, which is the 50% Fibonacci Retracement, leaving a huge Fair Value Gap between the $2,400 USDT and the $1,900 USDT level. Most Fair Value Gaps get filled, and I expect it to be the case this time. The Gap closes at around $1,900 USDT.
I also see this move overextended in the short term and do for a correction, so I am going short here.
I hope you find this interesting.
Good luck to you

Test of new trading pattern strategy: ETHStarted using my own new favorite method of charting, it went well with previous coin (almost spot on), so testing it here with ETH with my LONG idea. No more words here, lets just watch the results first.

possible target estimationPrice at the moment looks more bullish.
we should consider we are moving into downtrend channel in a bigger time charts yet.
so if the price could hold the base area at my chart has big chance to break out that channel.
at this scenario the closest target is around 2100$ for short term.
if price could manage to break up the channel we could consider our main trend changed to
bull trend.
Enjoy the market

ETHUSDT | Long Bias | Reversal Building on Weekly | (May 12, 20ETHUSDT | Long Bias | Reversal Building on Weekly + 4H Confluence | (May 12, 2025)
1️⃣ Short Insight Summary:
Ethereum has been climbing out of a long downtrend, with the weekly chart showing a strong shift from downside pressure to upside momentum. We're now watching a key area for re-entry and potential compounding long positions.
2️⃣ Trade Parameters:
Bias: Long
Entry Zone: $2,232–$2,224
Stop Loss: Below $1,800 (combined risk zone)
TP1: $2,500
TP2: $3,000
Final TP (Optional): $5,000+ if momentum continues
Partial Exits: Recommended at each take-profit level, especially around round numbers and prior highs
3️⃣ Key Notes:
✅ Weekly chart structure shows a macro reversal from $1.5K toward the EUROTLX:4K region—potential for large moves.
✅ On the 4H timeframe, the $2,232 area is showing confluence as a strong re-entry zone.
✅ Already taken two partial profits from earlier longs; now looking to re-enter or compound on pullback.
✅ This area could be a "crazy long" zone if confirmed by price action—watch for bullish reactions or strong volume spikes.
❌ Be cautious and wait for confirmation—don’t blindly long into weakness.
4️⃣ Optional Follow-up Note:
Will continue monitoring this zone and provide updates if the structure strengthens or invalidates.
Please LIKE 👍, FOLLOW ✅, SHARE 🙌 and COMMENT ✍ if you enjoy this idea! Also share your ideas and charts in the comments section below! This is best way to keep it relevant, support us, keep the content here free and allow the idea to reach as many people as possible.
Disclaimer: This is not financial advice. Always conduct your own research. This content may include enhancements made using AI.

Short term bull for Eth Not a financial advice and just for learning purposes
If you can please review and let me know what you think!

Next step for ETHThere is a ending diagonal formed from five overlapping waves and now it is preparing to break the bottom of the first wave and then decline again.
*In principle, I am not a supporter of any direction, but I am only giving my point of view, which may be right or wrong. If the analysis helps you, then this is for you. If you do not like this analysis, there is no problem. Just ignore it. My goal is to spread the benefit. I am not one of the founders of the currency.
