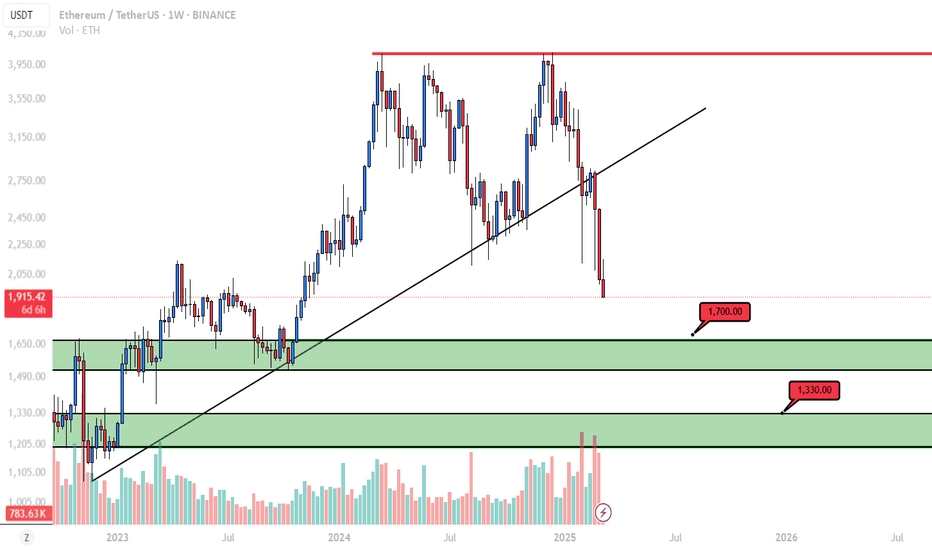
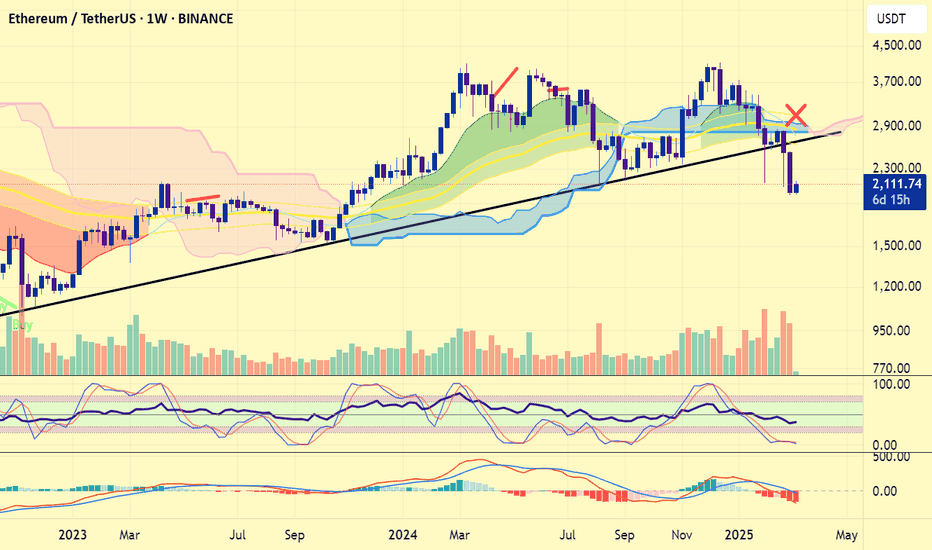
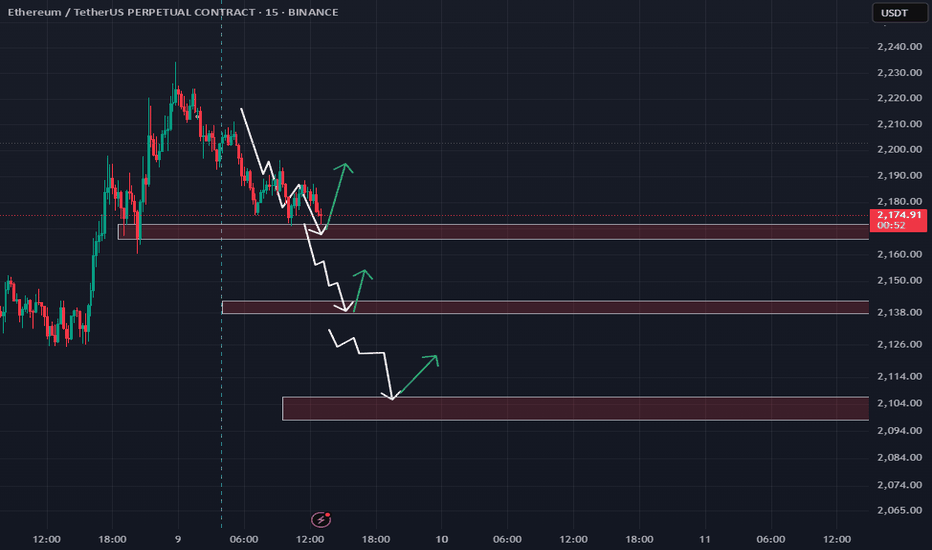
Positive days coming? ETH Crypto MarketWill Ethereum end its downtrend? Ethereum has been quite weak for a long time and is currently at an important support level. If it breaks down further, a sharp decline may continue, but if it holds the support, the upcoming period could be more positive.
Many cryptocurrency dominance charts, as well as Nasdaq and stock charts too, showing the same pattern. Is the reversal starting?
We’ll see.
This is not investment advice. Please do your own research.
Wishing you best.
-YusufDeli
ETHUST trade ideas
ETH/USDT Analysis – Weekly ChartEthereum has been consolidating within a massive symmetrical triangle pattern on the weekly timeframe. The current price action is testing the lower trendline support around $1,850, which has held strong multiple times before.
🔹 Trendline Support – The long-term ascending trendline (blue) has been tested numerous times and remains intact, indicating strong buying pressure at lower levels.
🔹 Symmetrical Triangle – ETH is nearing the apex of the triangle, suggesting an imminent breakout. Historically, symmetrical triangles break in the direction of the preceding trend, which in this case is bullish.
🔹 Potential Upside Move – If bulls manage to hold the support and push higher, the next major resistance lies at $4,000, followed by a potential breakout towards $6,000+.
🔹 Fakeout Risk – A breakdown below the trendline could trigger a deeper correction, possibly down to $1,200 or even $800 if selling pressure intensifies.
🚀 Scenario Analysis
Bullish Breakout (60%): Price holds support, bounces towards $4,000, and targets $6,000+ after a confirmed breakout.
Fakeout & Breakdown (40%): Price fails to hold the trendline, breaking down to $1,200 and potentially lower.
Let's see if bulls can defend this critical support or if bears will take control! 💥
ETH next move revealed ! fasten your seatbelt....Hello Traders! 🐺
I've been in this market for the past six years, and if there's one thing I've learned, it's this: The bull market is just getting started! 🚀
We haven't seen any real signs of a bear market yet. I know some of you might be thinking, "Come on, this was the top!"—but hold on! Stay with me until the end, and I’ll break it all down for you in detail. Let’s dive in! 🔥
Before we begin, let’s recall an old but powerful market narrative:
"The market is designed to take the most money from the most people, most of the time!"
But what does this really mean? And more importantly, how can we use this to our advantage in our trading strategy? 🤔
Stick around—I’m about to break it down! 🔥🚀
In the world of trading, many people chase quick gains—but let’s be real, the only "free money" is found in a mousetrap! 🐭💸
Whales and big players understand this mindset. That’s why, before any major move, they shake out weak hands—but why?
The answer is simple:
1️⃣ If weak hands don’t get shaken out, they’ll likely sell too early in pursuit of short-term profits, creating selling pressure that prevents the price from rising.
2️⃣ Whales need to buy at lower prices, and as we all know—one trader’s loss is another trader’s gain! 💰
Let’s dive into the ETH chart—because that’s why you’re here, right? 😉
Looking at the chart, we’re currently in the final dip before the real pump, according to the Wyckoff method. In my opinion, this presents a great opportunity to buy the dip and position yourself for solid gains. 💰🚀
Are you ready for what’s coming?
also don't forgot to like and follow 😎🙏
🐺 KIU_COIN 🐺
Ethereum — March 2025 Edition. The Lord Giveth and Taketh AwayWe have discovered already at @PandorraResearch Team a month ago or so in earlier published idea , that Donald Trump's recent policies and statements have generated significant negative sentiment towards Ethereum and the broader cryptocurrency market. As he resumes the presidency, his administration's approach to cryptocurrencies is expected to be more regulatory and cautious, which could impact Ethereum investors.
Donald Trump's actions and announcements have had a negative influence on Ethereum prices through several mechanisms.
Disappointment Over Strategic Bitcoin Reserve Order.
Trump's executive order to establish a Strategic Bitcoin Reserve was initially seen as a positive move, but it did not lead to immediate government purchases of cryptocurrencies. Instead, it focused on creating a budget-neutral strategy, which meant no taxpayer funds would be used for spot purchases in the short term. This lack of immediate action led to disappointment and selling in the market, affecting Ethereum's price.
"Pump & Dump" Effect.
Trump's rhetoric and announcements often create a "Pump & Dump" effect in the cryptocurrency market. This phenomenon involves a brief surge in prices followed by a sharp decline as investors realize there is no concrete action behind the rhetoric. Ethereum, along with other cryptocurrencies, experienced this volatility after Trump's statements about including Ethereum in a crypto reserve.
Trade Tensions and Tariffs.
Trump's tariff announcements have exacerbated global trade tensions, which negatively impact the broader financial markets, including cryptocurrencies. Ethereum has been particularly sensitive to these developments, experiencing significant price drops in response to tariff threats against major trading partners like Canada, Mexico, and China.
Market Volatility and Uncertainty.
Trump's unpredictable policies and statements contribute to market volatility and uncertainty. This environment can deter investors and lead to price fluctuations in Ethereum and other cryptocurrencies. The lack of clear regulatory guidance under his administration adds to the uncertainty, affecting investor confidence and Ethereum's price stability.
Technical challenge.
The main technical graph for Ethereum BITSTAMP:ETHUSD indicates on further Bearish trend in development (since mid-December 2024) with acceleration occurred a day before Mr. Trump entered the White House.
Previous key supports were considered as 100-week SMA (near $2550 per Ethereum), $2200 flat multi bottom and 5-years SMA (near $2100 per Ethereum), so all of them are broken to this time. That is why we believe (in this case of multi breakthrough), it could lead the Ethereum price much lower, as it described on the chart.
Conclusion.
Overall, Trump's influence on Ethereum prices is characterized by disappointment over unfulfilled expectations, market volatility driven by his rhetoric, and negative impacts from trade tensions and regulatory uncertainty.
--
Best 'Trump & Dump' wishes,
@PandorraResearch Team 😎
ETH roadmapWe will see ETH below 1500 $??!!!!
I think yes.
According to the market trend, Ethereum and the crypto market in general will experience another decline that will cause the exit of small buyers. After that, the market growth will start slowly with fear for small buyers and big profits for big buyers, which will start in about the next 3-4 months.
ETH: Bullish Harmonic PatternETH: Bullish Harmonic Pattern
ETH has completed a bullish harmonic pattern and subsequently moved down to test the $2,000 price zone, which is a significant psychological level for Ethereum.
ETH is expected to recover as long as the price remains above $2,000. In the short term, I anticipate a possible retest of $2,195 and $2,280.
However, a movement below $2,000 could initiate a larger bearish wave, making this level crucial to watch.
You may find more details in the chart!
Thank you and Good Luck!
❤️PS: Please support with a like or comment if you find this analysis useful for your trading day❤️
ETHEREUM price is alarming...#ethereum price has closed a weekly candle below 3 years of trendline for the first time!.. This is the one negative only. The other fact is, #eth price has already declined from the weekly ichimoku cloud and lost support. These must not be underestimated. I' ve warned you about CRYPTOCAP:ETH price structure weakness weeks ago.
What' ll be next? Allrigt. ETH has took support this zone and is now testing 2000 usd support zone. To avoid this sign of "major weakness", #eth price must immediately reclaim 3000 usd and above with monthly candle close. With this weekly close, it' s now getting harder to shelter the trend reversal. For now 2000 usd moderate and 1450 usd are now strong support zones for #ethusd .Otherwise, things will get more serious in mid term. Not financial advice. DYOR.
Ethereum (ETH): $2000 Is Crucial Zone For Us!Ethereum is showing some sort of bullish momentum near the current zone of $2000.
There is not much to say or look at on Ethereum but we are bullish on that coin, the one coin that has not yet reached it's full potential during this cycle so we still have some room to grow.
We are looking for price to establish a strong bounce zone here, which then would give us a proper upward momentum and a trend switch, but if we see a break of $2K, then we are going to look for the next proper support zone.
Swallow Team
Ethereum (ETH): Sellers Broke Major Trend + 200EMAWell, our long ride on Ethereum has ended in some way for now.
Sellers took over fully the trend zone and broke the local 200EMA, where now we are going to need to find some proper support zone from where we could bounce off.
For now our eyes are on $2000 and $1500 (if $2000 will not hold it's ground). So if we see a bounce from either of those zones, then we are going to look for a market structure break in order to have a proper trend switch!
Swallow Team
$ETH Bullish Setup: Trade with leverage 400x Crazy Trade ETH Bullish Setup: Trade with leverage 400x Crazy Trade at the Second LQ Zone!
Hey traders, I’ve been analyzing Ethereum ( CRYPTOCAP:ETH ) on the W timeframe, and here’s a high-risk, high-reward setup I’m watching closely:
◈ Current Situation: We’ve already hit the first downside liquidity zone (LQ) and took a trade with a small stop-loss, but it didn’t perform as expected. Now, we’re approaching the second LQ zone, which has a strong order block (OB) forming—a key support/resistance area.
◈ Technical Analysis: The weekly candle is closing soon, and the new candle is expected to test the low of this week’s candle. This setup aligns with a potential bullish reversal, driven by the OB acting as a magnet for price action . Despite market uncertainty and scams , CRYPTOCAP:ETH shows strong potential for an upside move after this zone.
◈ Key Indicators: I’m using my indicator to confirm the LQ and OB, along with RSI to ensure we’re not overextended. The price is consolidating near the OB, setting up for a breakout.
◈ Bullish Target: If we reach the second LQ zone and the price respects the OB, I’m planning a CRAZY 400x leverage trade on MEXC , targeting a massive upside move. I expect CRYPTOCAP:ETH to rally toward $3,000+ .
◈ Risk Management: I’ll use a tight stop-loss below the OB to manage the extreme risk of 400x leverage.
◈ Trade Plan: I’ll enter long when the 15 MIN candle confirms the OB at the second LQ zone, aiming for the weekly low test and then a bullish breakout. Watch for the weekly candle close tonight
This is a high-stakes trade, so follow me for updates and be ready to see this CRAZY trade unfold! Like , comment below with your thoughts, or share this idea if you’re as excited as I am. Stay sharp—scams and volatility are everywhere , but the reward could be massive!
#ETHUSDT 1W MACD Divergence as a Potential Lifeline
Ethereum currently faces challenging conditions, with its recovery hinging on the bullish divergence observed in the MACD oscillator (as highlighted in the chart). A failure to stabilize above the green support zone would likely trigger prolonged downside pressure, dimming near-term prospects.
Key Observations:
Bullish Divergence Signal : The MACD’s positive divergence suggests weakening bearish momentum, offering a glimmer of hope for a reversal.
Critical Support Test : Sustained trading below the green box (support zone) would invalidate recovery prospects and open the door to deeper corrections.
Volatility Alert : Ethereum’s price action reflects heightened sensitivity to macro liquidity conditions and risk sentiment.
Strategic Recommendation:
Short-Term Traders : Avoid counter-trend entries unless the MACD divergence confirms a bullish breakout above the green zone.
Long-Term Investors : Monitor for a weekly close above the green support to re-evaluate accumulation opportunities.
ETH Daily Trade I’m planning to take a long position here. We recently swept liquidity on the downside, and now I believe we’re on track to take liquidity on the upside. I’ve already confirmed this setup using my indicator on the (1MIN) timeframe. The trade offers a 1:14 risk-to-reward (RR) ratio. Let’s see how it plays out!
ETHUSD NEXT MOVESell after bearish candle stick pattern, buy after bullish candle stick pattern....
Best bullish pattern , engulfing candle or green hammer
Best bearish pattern , engulfing candle or red shooting star
NOTE: IF YOU CAN'T SEE ANY OF TOP PATTERN IN THE ZONE DO NOT ENTER
Stop lost before pattern
R/R %1/%3
Trade in 5 Min Timeframe, use signals for scalping


