Last year Nov ETH $ETH VibesIf we See a $2800 Zone Breakout it will be Huge Week for Alts Ethereum
Will history repeat itself?
ETHUST trade ideas

Eth Short ScalpEth is wanting to start it's b wave correction, so am expecting price to head lower than my Profitzone, so will update the idea as it progresses.
Idea includes:
Entry - Stop Loss - Conformation - Profit Zone
Not Trading Advice. Not Always Worth Ignoring.

Ethereum Has Bearish DivergenceI was looking for a local top in Ethereum and altcoins, and somehow forgot to mention this yesterday. Ethereum has bearish divergence with over bought RSI on every time frame from the daily down. This was a great topping signal, but also should indicate a bit more downside. The difference now is that I am looking to buy dips, not sell rips on altcoins.

#ETH is hitting a major resistance next target $4000! Here's Why#ETH is back inside the legendary 1,883-day trendline, a massive bullish signal for altcoins.
Meanwhile, BTC Dominance is getting rejected from the top, adding fuel to the altcoin momentum.
But there's one key confirmation still needed before we talk about new ATHs for ETH, BTC, and the broader altcoin market:
The 200-Week EMA.
Currently sitting around $2,237, this level needs to be claimed with a strong weekly close. ETH is trading above it right now, but the next 2 days and 4 hours are crucial.
A confirmed breakout here would signal a major shift in ETH's 200-week momentum a structural change that could trigger the next big leg up.
I believe it’s only a matter of time before ETH closes above this level. Once that happens, the next target for CRYPTOCAP:ETH would be $2980, $3488 and $4000!
What do you think?
Drop your thoughts in the comments and hit the like button if you found this valuable.
#PEACE ✌️

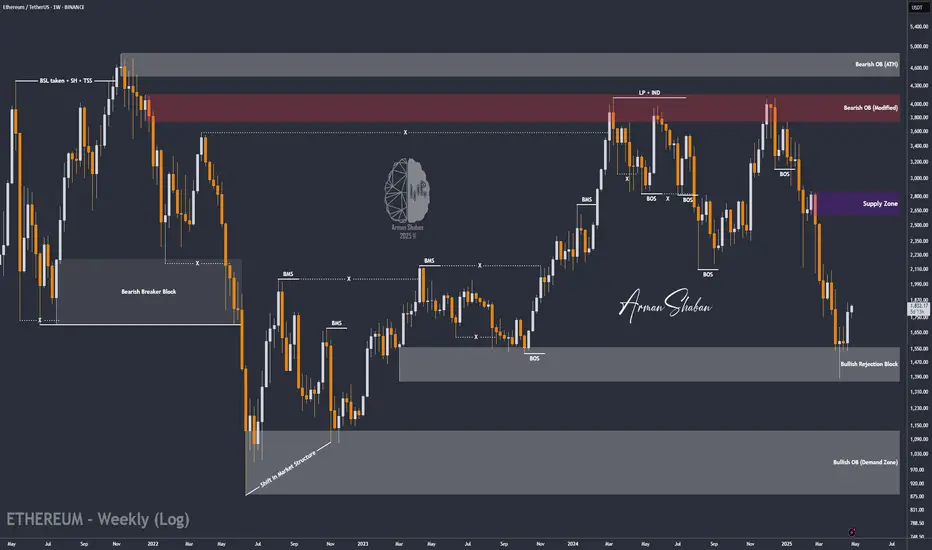
ETH/USDT : Bulls are coming back? (READ THE CAPTION)By analyzing the #Ethereum chart on the weekly (logarithmic) timeframe, we can see that after reaching the demand zone between $1400 and $1550, buying pressure increased significantly. Currently, Ethereum is trading around $1800, and I expect to see the next bullish wave soon. The potential upside targets are $1990, $2500, and $2600. This analysis will be updated accordingly!
Please support me with your likes and comments to motivate me to share more analysis with you and share your opinion about the possible trend of this chart with me !
Best Regards , Arman Shaban
Eth Whales Poised to Sell at $2,700: What It Means for Market?The potential for Ethereum (Shark)whales to sell at $2,700 underscores the importance of tracking large holders' behavior in the crypto market.
While such moves can create short-term volatility, they are also a natural part of market cycles. By staying informed and adopting a strategic approach, we can navigate these fluctuations effectively and make decisions aligned with their long-term goals using Candles Patterns .


Ethereum (ETH): Time For Ethereum To Shine | Buyers DominatingBuyers are heavily dominating Ethereum right now, pushing us into the second stage of the upcoming bull market. As many of you know, the money flow usually starts with BTC, then moves into ETH, followed by large caps, mid caps, and finally low caps.
At this point, we’re clearly in stage two—Ethereum still has room to grow. First target already hit, two more to go!
Swallow Academy

ETH Short setupETH showing some weakness, manual SL if 4hrs candle closes above the mentioned point then must close the trade don't hold and wait for the new setup.

Short trade 🟥 Sellside Trade Log
📉 Pair: ETH/USD
🏷️ Type: Intraday | NY Session PM
🧠 Setup: Breakout (Downside)
📅 Date: Tuesday, 13th May 2025
🕕 Time: 6:20 PM
🔹 Entry Price: 2,702.20
🔹 Profit Target: 2,654.27 (-1.77%)
🔹 Stop Loss: 2,710.31 (+0.30%)
🔹 Risk-Reward Ratio: 5.91
🔍 Reasoning:
Sellside breakout trade assumes a clear momentum-driven directional bias during the NY PM session. The move was reinforced by forming a Fair Value Gap (FVG) on the lower timeframe (5min), indicating institutional selling pressure and inefficiency. Price broke below a key structural level and continued into the FVG, confirming bearish intent. Entry was taken with confluence from the gap, targeting the next liquidity pool while maintaining tight stop control above the invalidation zone.
5min TF entry

$ETH quick longWe have in a demand zone while we are on a weekend, so I expect a push to test the trendline
Targets in chart.
It's just one lineSimplicity meets precision.
This single line captures every major support and resistance level on the ETH/USDT chart — no clutter, just clarity.
Whether you're a breakout trader or range hunter, this level tells the whole story. Watch closely how price respects it.
#ETH #Ethereum #Crypto #SupportResistance #TradingView #CryptoAnalysis #PriceAction

ETH: The moment looks goodEthereum is trying to show strength. The price is surging and it's important for ETH to not loose the 2350 level. This is an important support zone, loosing it will probably lead the price to $1900-1950
Ethereum (ETH): We Reached Our Major Target | Possible DropWe reached our major target zone where ETH touched the $2,700 area (where we caught the movement from $1,950 to $2,700). We had a good upward movement and now it is time for a smaller correctional movement before another BOS and bullish movement.
Now we also might not see the correctional movement that would fill the bearish CME gap (but it would be an ideal buy zone for us). The other scenario would be seeing a proper BOS on smaller timeframes with a successful retest.
Swallow Academy

HOW: TradeAgent Pro Technical Analysis FrameworkWelcome to our technical analysis community! This comprehensive guide explores advanced trading concepts and systematic risk management approaches.
SYSTEM OVERVIEW
TradeAgent Pro combines multiple technical analysis tools into an educational framework for market analysis and risk management.
KEY FEATURES:
1. Advanced Market Analysis
• Multi-Timeframe Integration
- Long-term trend identification (EMA/SMA)
- Short-term momentum signals
- Market structure validation
• Visual Confirmation System
- Strong trends: Green/Red signals
- Moderate trends: Yellow/Orange indicators
- Multiple confirmation points
2. Risk Management Suite
• Dynamic Stop Loss Technology
- ATR-based volatility adaptation
- Multiple timeframe validation
- Automatic adjustment system
• Strategic Take Profit Framework
- Multiple TP levels
- Position scaling methodology
- Risk-reward optimization
• Intelligent Trailing System
- Dynamic trailing activation
- Position-based adjustments
- Momentum-driven modifications
3. Professional Tools
• Entry Management
- Systematic confirmation signals
- Risk-adjusted sizing
- Market structure analysis
• Exit Framework
- Multiple exit strategies
- Risk reduction system
- Position adjustment logic
EDUCATIONAL RESOURCES:
• Regular technical analysis updates
• Community trading discussions
• Educational content sharing
• Risk management concepts
IMPLEMENTATION GUIDE:
1. Study the framework thoroughly
2. Practice in demo environment
3. Document your observations
4. Adapt to market conditions
5. Focus on risk management first
IMPORTANT DISCLAIMERS:
• Educational content only
• Not financial advice
• Requires extensive testing
• Trading involves significant risk
• Past performance isn't indicative
JOIN OUR COMMUNITY:
1. Send private message
2. Include:
- Trading experience
- Preferred markets
- Analysis timeframes
3. Await verification
No public access requests.
Stay updated with our latest educational content and technical analysis discussions.

** ETH/USDT Update: Key Levels & Reversal Watch** Hello everyone, this is Dark Analysis.
### **📌 Latest Technical Outlook**
1. **Previous Analysis Hit Target**:
- Support at **$2,435.32** held as expected, and the target was achieved.
- Break above **$2,513.43** has shifted bias to **bullish**.
2. **Current Price Action**:
- **Bullish Scenario**: Price is likely to hunt liquidity in the demand zone near **$2,463.45**.
- *Entry (Long)*: Only if a **reversal pattern** (e.g., Bullish Engulfing, Hammer) forms here.
- *Stop Loss*: **$2,449.44** (below recent swing low).
- **Caution**: No long trades if price approaches the zone with **weak bullish momentum**.
3. **Bearish Invalidation**:
- Shorts are **off the table** unless:
- A new **supply zone** forms.
- Price shows **weakness after retesting highs** (e.g., lower high + RSI divergence).
---
### **🎯 Trade Plan (If Setup Triggers)**
- **Entry Zone**: **$2,463.45** (Demand Area)
- **Confirmation**: Reversal candle + volume spike.
- **Target**: Previous high (**$2,513.43**) → **$2,550** (next liquidity zone).
- **Stop Loss**: **$2,449.44** (tight risk management).
---
### **📊 Key Chart Levels**
- **Support**: $2,463.45 (Demand Zone) → $2,435.32 (Strong Base)
- **Resistance**: $2,513.43 (Breakout Confirmation) → $2,550 (Next Target)
---
### **⚠️ Critical Reminders**
- **No Longs on Strong Momentum Dips** (Wait for structured pullbacks).
- **Avoid Shorts Unless New Supply Forms** (Trend is bullish above $2,513.43).
- **Always Use Stops** (Protect capital in volatile moves).
---
**📌 Final Note**: *"Trade the structure, not the noise!"* Updates will follow if the scenario changes.
**🔍 Follow for real-time insights!**

ETH/usdtreclaimed area it can help you for your knowlege how to get enter in market for to make your trading for short time period and earn profit

ETH Trendline breakdownTrendline breakdown and going to retest, very heavy volume needed to ETH to fuel it upto 2800 but according to me it will happy to test it's support 2250 then it will decide to go further down to 1800 zone or 2800, but in short time of frame 2250 is important zone, this is not financial advise, do your own research (DYOR)

ETH | 4 hour long taking a long from here based a corrective bull flag tapping into the 4hr 50 EMA. in line with the 23.6 fib retrace level.

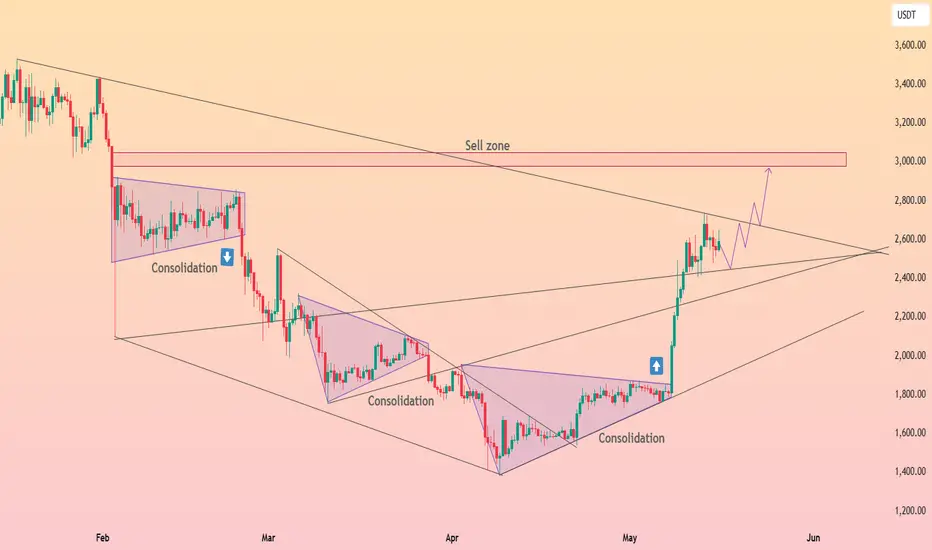
HolderStat┆ETHUSD wedge liftoff eyes 3 k sell zoneCRYPTOCAP:ETH blasted out of a multi-month falling wedge, erupting from 1.8 k to 2.7 k in one vertical burst. Price is now hovering above the broken wedge roof and an intersecting long-term trend line at roughly 2.55-2.60 k. If this freshly minted support holds, the pattern’s measured move directs attention to the 2.9-3.1 k sell zone in red. A dip under 2.45 k would simply delay, not negate, the bullish structure while the broader trend stays up-sloping.
ETH-----Sell around 2600-2630, target 2550-2580 areaTechnical analysis of ETH contract on May 16:
Today, the large-cycle daily level closed with a small negative line yesterday, and the K-line pattern was a single positive line with continuous negative lines. The price was consolidating at a high level. The attached indicator golden cross was running with a shrinking volume. Although the current trend signal of Ethereum is not as obvious as that of the big cake, we can see that the price rebounded yesterday and did not break upward, which shows that the price is still suppressed to a certain extent; the current pressure position of the short-term hourly chart is near the 2650 area, and the low point support is in the 2425 area. In terms of trend rules, the high point on the 11th was under pressure in the 2630 area, and the 12th was also under pressure in the 2630 area. Although the current price is at a high level, it does not continue the trend of breaking high, so it is easy to be under pressure and retreat.
Therefore, today's ETH short-term contract trading strategy: short in the 2600-2630 area, stop loss in the 2660 area, and target the 2550-2580 area;

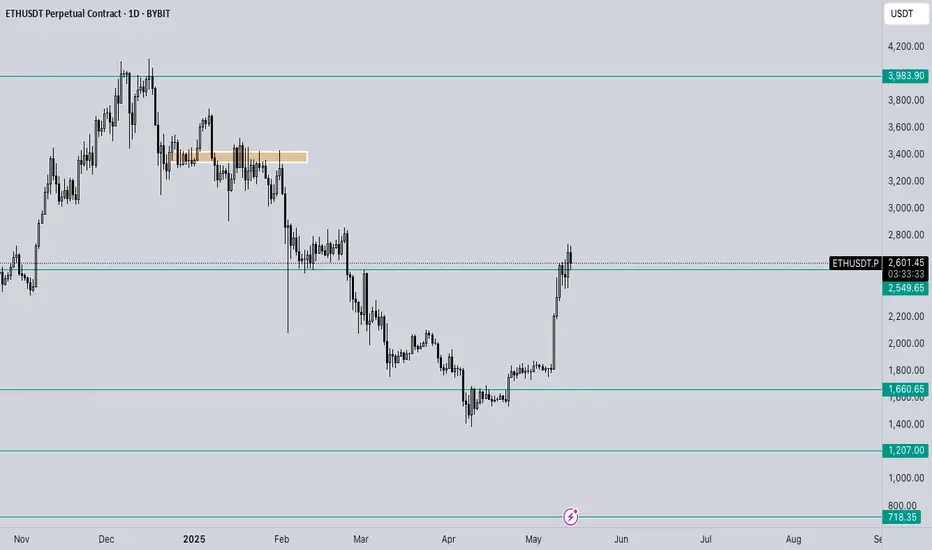
ETH - Ranges overview Let's have a look at how ETH is currently trading.
From a monthly (1 month) perspective we have deviated the sellside and have started to regain 2.5K.
IF we hold 2550 expect us to push back up towards the buyside liquidity sitting around 3.4K and 4K as second target IF the market holds.
IF we get a clean break below 2.2K expect us to retrace towards 1.8K.
BE PATIENT...WAIT FOR THE MARKET...TRADE WITH IT.
As always in crypto...keep an eye on BTC who will be the main indicator.
For those who have been trading ETH for more than 5 years you'll fully understand the importance of 2.5K.
For the rest...TRUST YOUR SYSTEM and WAIT FOR THE MARKET TO SHOW YOU ITS HAND.
Stay safe and never risk more than 1-5% of your capital per trade. The following analysis is merely a price action based analysis and does not constitute financial advice in any form.
I see ETH break the trend lineETH owner buy enough coin in their wallet with breaking the descend line.
