ethusd 1400 EOY then bull run to ATH 4500Huge Triangle pattern of ethereum.
If 1400 till end of year will hold could be as simple as in 2023 the start of bull run in 2026 to new ATH at 4500
ETHUST trade ideas

ETH/USDT – Waiting for Retracement After Strong Impulse MoveEthereum has shown a strong impulsive rally from the $1,750 zone, breaking through key resistance levels. Now, price is approaching a major supply zone and resistance between $2,450–$2,600, suggesting a potential pullback.
🔹 Technical Highlights:
The current move is a clean vertical impulse leg with little consolidation — a retracement is likely before continuation.
Key Fibonacci retracement levels are drawn from the recent swing low to high:
0.382 Fib: $2,218
0.5 Fib: $2,125 (Buy Zone)
0.618 Fib: $2,067
A support block and potential bullish reaction zone is aligned with the 0.5 Fib level, marked as a “Buy Here” zone.
RSI is deeply overbought (~86), increasing the likelihood of a temporary correction.
🟢 Trade Plan Summary:
Scenario : Price rejects from $2,450–$2,600 resistance, pulls back to the 0.5–0.618 Fib zone, and then resumes bullish momentum.
Buy Zone: Around $2,125, with confluence from Fib, structure, and trendline support.
Buy Zone: Around $2,125, with confluence from Fib 0.5, structure, and support.
Target: New highs above $2,600, possibly heading toward $3,000+ in the medium term.
📌 Outlook: Bullish on confirmation of pullback support — waiting for healthy retracement for re-entry.

ETHUSDT: Progressing Well 01/05/2025 UPDATEThe ETHUSDT price is moving well, currently trading above the 1700$ area. We anticipate a continuous rise, potentially reaching $2400 first and then $3000. Our swing target remains at $4500. The current price behaviour and momentum suggest an extremely bullish outlook.
Good luck and trade safely!
Thank you for your unwavering support! 😊
If you’d like to contribute, here are a few ways you can help us:
- Like our ideas
- Comment on our ideas
- Share our ideas
Team Setupsfx_
❤️🚀

Buy Trade Strategy for ETH: Powering the Future of Web3 and DeFiDescription:
This trading idea centers on ETH (Ethereum), the second-largest cryptocurrency by market cap and the backbone of the decentralized application (dApp) ecosystem. ETH is not just a digital currency, but a programmable blockchain supporting smart contracts, DeFi platforms, NFTs, DAOs, and much more. With the successful transition to Proof of Stake through the Ethereum 2.0 upgrade, the network has significantly improved its scalability and energy efficiency, reinforcing its long-term viability. Institutional interest, widespread developer activity, and real-world utility make ETH a cornerstone asset in the blockchain space, especially as Web3 adoption accelerates globally.
Despite its strong fundamentals, the crypto market remains highly volatile and susceptible to macroeconomic trends, technological developments, and regulatory changes. Therefore, even well-established assets like ETH carry risks that investors should carefully consider.
Disclaimer:
This trading idea is provided for educational purposes only and does not constitute financial advice. Trading or investing in cryptocurrencies like ETH involves substantial risk, including the potential for complete loss of capital. Always conduct your own research, evaluate your financial situation, and consult a licensed financial advisor before making investment decisions. Past performance is not indicative of future results.

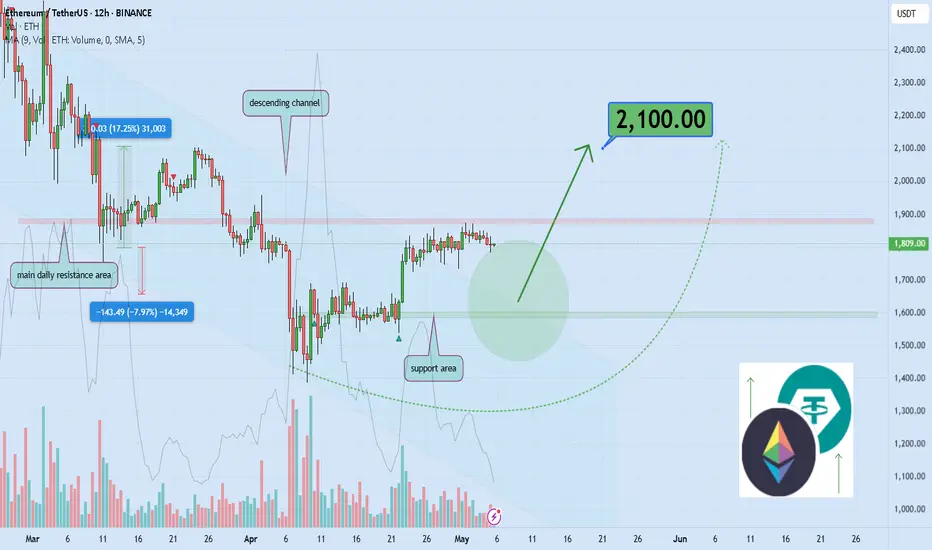
Can Ethereum Break $2,000 and Surge 16% to $2,100?Hello and greetings to all the crypto enthusiasts, ✌
All previous targets were nailed ✅! Now, let’s dive into a full analysis of the upcoming price potential for Ethereum 🔍📈.
Ethereum has recently broken out of its descending channel to the upside, indicating a potential for at least a 16% price increase. The price is approaching a key resistance zone, with the psychological \$2,000 level in sight. My primary target is \$2,100, but a retest of the channel's upper boundary is also a likely scenario. 🚀📊
🧨 Our team's main opinion is: 🧨
Ethereum broke its descending channel, targeting a 16% rise to \$2,100, with key resistance at \$2,000. 🚀
Give me some energy !!
✨We invest hours crafting valuable ideas, and your support means everything—feel free to ask questions in the comments! 😊💬
Cheers, Mad Whale. 🐋
$eth tl breakoutBINANCE:ETHUSDT about to break a multi month trendline, paying close attention to a 4h/12h/1d close above it
fibs as tps with previous highs as confluence, pretty straightforward setup
invalidation on a failed breakout

Ethereum Breakout After 64% Crash | Big Moves Ahead!After capturing a massive 60% fall in ETH, we are now spotting the first clear breakout sign on the daily chart!
ETH is currently trading around $1,794 and looks ready to rally towards the $2,100–$2,150 zone soon With a SL of $1,600 . 📈
Big institutional players have already started accumulating BTC and ETH heavily — the smart money is moving, and the impact will be visible very soon!
Stay tuned — the next few weeks could be a game changer for crypto!
🔹 #ETHUSDT #Ethereum #CryptoBreakout #iSparkIndicator #CryptoTrading #Bitcoin #CryptoAnalysis #TradingView

Understanding Liquidity: Where Big Players Hunt Stops
Understanding Liquidity: Where Big Players Hunt Stops
Ever wondered why price suddenly spikes through your stop-loss and reverses moments later? That’s not a coincidence—it’s liquidity at play. This article will teach you how liquidity zones work, why stop hunts happen, and how to avoid getting trapped like the crowd.
🔵 What Is Liquidity in Trading?
Liquidity refers to how easily an asset can be bought or sold without drastically affecting its price. But in practical trading, liquidity is more than just volume—it’s where traders *place* their money.
Large players—institutions, market makers, or big accounts—need liquidity to fill orders.
They target areas where many retail stop-losses or pending orders are stacked.
These areas are often just above resistance or below support—classic stop-loss zones.
To move large positions without slippage, smart money uses stop hunts to trigger retail orders and create the liquidity they need.
🔵 Where Do Liquidity Zones Form?
Liquidity often builds up in predictable areas:
Above resistance: Where shorts place stop-losses.
Below support: Where longs place stop-losses.
Swing highs/lows: Obvious turning points everyone sees.
Round numbers: e.g., 1000, 10,000, 50,000.
Breakout zones: Where breakout traders place entries or stops.
These zones act like magnets. When price approaches them, it accelerates—seeking the liquidity pool behind the level.
🔵 What Is a Stop Hunt?
A stop hunt happens when price moves just far enough to trigger stop-losses before reversing. This isn’t market noise—it’s an intentional move by big players to:
Trigger a flood of stop orders (buy or sell).
Fill their own large positions using that liquidity.
Reverse price back to fair value or the prior trend.
Example: Price breaks above resistance → stops get hit → institutions sell into that liquidity → price drops sharply.
🔵 Signs You’re in a Liquidity Grab
Look for these clues:
Fast spike beyond key levels followed by rejection.
Wick-heavy candles near highs/lows.
Price touches a level, then sharply reverses.
High volume on failed breakouts or fakeouts.
These are signs of a liquidity event—not a real breakout.
🔵 How to Trade Around Liquidity Zones
You can use liquidity traps to your advantage instead of becoming their victim.
Avoid obvious stops: Don’t place stops directly below support or above resistance. Instead, use ATR-based or structure-based stops.
Wait for confirmation: Don’t chase breakouts. Let price break, reject, then re-enter inside the range.
Watch for wick rejections: If price quickly returns after a level is breached, it's often a trap.
Use higher timeframe confluence: Liquidity grabs are more powerful when they align with HTF reversals or zones.
🔵 Real Example: Liquidity Sweep Before Reversal
In this chart, we see a textbook liquidity grab:
Price breaks below support.
Longs get stopped out.
Candle prints a long wick.
Market reverses into an uptrend.
This is where smart traders enter— after the trap is set, not during.
🔵 Final Thoughts
Liquidity is the invisible hand of the market. Stop hunts aren’t personal—they’re structural. Big players simply go where the orders are. As retail traders, the best thing we can do is:
Understand where traps are set.
Avoid being part of the crowd.
Trade the reaction, not the initial breakout.
By thinking like the smart money, you can stop getting hunted—and start hunting for better trades.

Ethereum (ETH): Targeting $2,700 | Strong Bull MovementEthereum is finally shining after such a hard time we had on it. The price is breaking new highs and is not showing any remorse to sellers.
Despite us looking for upward movement, we have to be careful of any quick downward correctional movement or candles so if you hold a long position on ETH, set your last targets to $2,700, while if you are looking to enter, do not enter with big leverage (due to big liquidity hunting that might happen).
RSI is overbought so that's what we will be looking at as well
Swallow Academy
Ethereum ETH price analysisThe #Ethereum network has successfully activated the #Pectra update, one of the factors that JPMorgan previously called a bullish driver for CRYPTOCAP:ETH
The update contains 11 improvements, including: support for smart contracts in wallets (simplified use and recovery, payment of fees in different tokens), an increase in the staking limit to 2048 ETH, optimization of validators and management of withdrawals through smart contracts.
All of this should make #Ethereum more convenient, scalable, and accessible.
📊 If we look at the OKX:ETHUSDT chart, I want to believe that the price will not go below $1500-1600 and this will be the “last carriage” buying zone
📈 And then - a smooth “acceleration of a heavy locomotive”, which, let's hope, will reach the $3800 “station” already in 2025.
_____________________
Did you like our analysis? Leave a comment, like, and follow to get more

#ETH Breakout is incoming!$ETH/USDT – Breakout Watch
Ethereum is currently retesting a key descending resistance line after an extended period of consolidation. The structure suggests growing bullish momentum.
🟢 A successful breakout and daily close above the $1,900–$2,000 zone could trigger a move toward $2,200–$2,400 in the coming sessions.
Watch for confirmation with volume expansion and retest behavior. Rejection at this level could delay the move, but the pressure is clearly building.
Key Levels:
Resistance: $1,900–$2,000
Target: $2,200–$2,400
Support: $1,800
Chart looks clean breakout potential is real.
DYOR NAF
BINANCE:ETHUSDT BITSTAMP:ETHUSD

ETH vs USDT Crypto Heist - Bullish Breakout Plan!🔥 Thief Trading Style: ETH/USD Bullish Heist Plan 🔥
Dear Money Makers & Market Robbers 🤑,
Ready to pull off a master heist in the Ethereum vs. U.S. Dollar (ETH/USD) crypto market? 📈 Using Thief Trading Style’s technical and fundamental analysis, here’s our strategic plan to ride the bullish wave and escape near the dangerous MA zone. Follow the chart, stick to the plan, and let’s secure those profits! 💪🎯
---
📊 Trade Setup: The Heist Blueprint
- Market: ETH/USD (Crypto) 🌐
- Bias: Bullish Breakout 🌟
- Timeframe: 1D (Swing Trade) ⏰
Entry 📈:
- Breakout Entry: Wait for a confirmed breakout above the Moving Average (MA) at 2500. Set Buy Stop orders just above 2500 to catch the momentum. 🚀
- Pullback Entry: For safer entries, place Buy Limit orders at the most recent 15M/30M swing low (e.g., 2450-2475) for pullback opportunities. 📍
- Pro Tip: Set an alert on TradingView for the 2500 breakout to never miss the move! 🔔
Stop Loss 🛑:
- Breakout Traders: Place your Stop Loss below the recent 1D swing low at 2000 after the breakout confirms. This protects against false moves. ⚠️
- Pullback Traders: Adjust Stop Loss based on your risk tolerance (e.g., 1-2% of account per trade). Use lot size and multiple orders wisely. 📏
- Risk Warning: This is a high-risk heist! Manage your position size and stick to your risk plan. 🔥
Target 🎯:
- Aim for 2900 (near the dangerous MA zone, a risky overbought level with potential consolidation or reversal). 🏴☠️
- Escape Plan: Consider taking profits early if bearish signals (e.g., reversal patterns, high volume) appear near 2900. 💸
Scalpers 👀:
- Focus on Long-side scalps using tight trailing stops. Join swing traders for the full heist or scalp quick moves with high leverage (if your capital allows). 💰
---
📡 Why This Heist Could Work
The ETH/USD market is currently neutral with bullish potential, driven by:
- Technical Signals: Breakout above the 2500 MA signals strong bullish momentum, supported by higher lows on the 1D chart. 📊
- Fundamentals: Positive sentiment in crypto markets, fueled by macroeconomic trends and institutional interest (check COT reports for positioning). 📰
- Seasonal Factors: Crypto often sees Q2 bullish runs, aligning with our setup. 📅
- Intermarket Analysis: Bitcoin’s strength and USD weakness could propel ETH higher. 🌎
For deeper insights, review COT Reports, Geopolitical News, and Sentiment Analysis on platforms like Bloomberg or Cointelegraph. 🔗
---
⚠️ Risk Management: Protect Your Loot
- News Alerts: Avoid new trades during high-impact news (e.g., FOMC, CPI releases) to dodge volatility spikes. 🗞️
- Trailing Stops: Use trailing Stop Loss to lock in profits as price approaches 2900. 🔒
- Position Sizing: Never risk more than 1-2% of your account per trade. Stay disciplined! 🚨
---
💥 Boost the Heist! 💥
Support our Thief Trading Style by liking, commenting, and following for more high-octane trade plans! 🚀 Every boost strengthens our robbery crew, helping us conquer the markets together. 🤝 Let’s make money with ease and style! 🏆🎉

Support and Resistance Zone: 2273.58-2359.35
Hello, traders.
If you "Follow", you can always get new information quickly.
Please click "Boost" as well.
Have a nice day today.
-------------------------------------
(ETHUSDT 1M chart)
In order to turn upward on the 1M chart, the price must rise to the Fibonacci ratio range of 0.382 (2674.80) ~ 0.382 (2723.46) and maintain it.
Before that, the key is whether it can rise above the M-Signal indicator on the 1M chart.
-
(1W chart)
The key is whether the price can be maintained and rise above the M-Signal indicator of the 1W chart.
To do so, we need to check whether the price is maintained by rising near the right Fibonacci ratio 0.5 (2295.84).
In order to continue the uptrend in the medium to long term, the price must be maintained above the M-Signal indicator of the 1M chart.
Accordingly, the key is whether the price can rise above the M-Signal indicator of the 1M chart when the price is maintained by rising near the right Fibonacci ratio 0.5 (2295.84).
Therefore, it is expected that a breakout trade will be possible when the right Fibonacci ratio 0.5 (2295.84) is broken upward.
However, since the StochRSI indicator is showing signs of entering the overbought zone, the increase may be limited.
-
(1D chart)
It showed a big rise as it broke through the A section, that is, the 1861.57 point.
In any case, since it is currently below the M-Signal indicator of the 1M chart, we can see that there is still time to buy.
Therefore, as I mentioned earlier, we should focus on finding a buying point when the price rises above the M-Signal indicator of the 1M chart and maintains the price, or when it rises to the Fibonacci ratio range of 0.382 (2674.80) ~ 0.382 (2723.46) and maintains the price.
ETH is in a typical reverse arrangement (M-Signal of the 1M chart > M-Signal of the 1W chart > M-Signal of the 1D chart).
Therefore, we should focus on finding a buying point while watching the situation with a relaxed mind.
If it continues to rise like this,
1st: 2273.58-2359.35
2nd: 2627.18
3rd: 2921.73
We need to check if it can rise with support near the 1st-3rd above.
If not, if it falls, we need to check if it can support near 1861.57.
-
Thank you for reading to the end.
I hope you have a successful trade.
--------------------------------------------------
- This is an explanation of the big picture.
I used TradingView's INDEX chart to check the entire range of BTC.
I rewrote it to update the previous chart while touching the Fibonacci ratio range of 1.902(101875.70) ~ 2(106275.10).
(Previous BTCUSD 12M chart)
Looking at the big picture, it seems to have been following a pattern since 2015.
In other words, it is a pattern that maintains a 3-year bull market and faces a 1-year bear market.
Accordingly, the bull market is expected to continue until 2025.
-
(Current BTCUSD 12M chart)
Based on the currently written Fibonacci ratio, it is displayed up to 3.618 (178910.15).
It is expected that it will not fall again below the Fibonacci ratio of 0.618 (44234.54).
(BTCUSDT 12M chart)
I think it is around 42283.58 when looking at the BTCUSDT chart.
-
I will explain it again with the BTCUSD chart.
The Fibonacci ratio ranges marked in the light green boxes, 1.902 (101875.70) ~ 2 (106275.10) and 3 (151166.97) ~ 3.14 (157451.83), are expected to be important support and resistance ranges.
In other words, it seems likely to act as a volume profile range.
Therefore, in order to break through this section upward, I think the point to watch is whether it can rise with support near the Fibonacci ratios of 1.618 (89126.41) and 2.618 (134018.28).
Therefore, the maximum rising section in 2025 is expected to be the 3 (151166.97) ~ 3.14 (157451.83) section.
To do that, we need to look at whether it can rise with support near 2.618 (134018.28).
If it falls after the bull market in 2025, we don't know how far it will fall, but considering the previous decline, we expect it to fall by about -60% to -70%.
So, if the decline starts near the Fibonacci ratio 3.14 (157451.83), it seems likely that it will fall to around Fibonacci 0.618 (44234.54).
I will explain more details when the downtrend starts.
------------------------------------------------------

Ethereum 6X Lev. Full PREMIUM Trade-Numbers —2nd Entry—PP: 1806%This is a second entry for a long-term leveraged chart setup for ETHUSDT (Ether).
This is truly the last chance to get Ethereum at low prices before a major bullish impulse, the biggest one in a long time.
The chart structure is perfect. The low conditions look very similar to June 2022, very similar.
We have long-term higher lows blah blah blah... By now, you already know all these things as I read this chart a million times.
I don't have much to say other than remain calm, whatever happens. Sleep easy because Crypto is going up. It is as simple as that. It will grow, soon.
Full trade-numbers below:
_____
LONG ETHUSDT
Leverage: 6X
Entry levels:
1) $1,900
2) $1,825
3) $1,630
Targets:
1) $2,125
2) $2,405
3) $3,347
4) $4,017
5) $4,871
6) $6,000
7) $7,337
Stop-loss:
Close weekly below $1,600
Potential profits: 1806%
Capital allocation: 3%
_____
I would like to thank you again for reading. Your support is appreciated.
I know it is a lot of content but this is meant for many different people all across the world.
If you like what you see make sure to follow.
If you want to see more, leave a comment and boost to show your support.
This is the big one.
Namaste.

Ethereum Bear Market Over! $10,000 Before 2026 Confirmed!People were badmouthing Ethereum but look what is happening, more than 20% growth in a single day. Awesome right? But this is only the start, the last high will be reached and conquered easily, that I know for certain for sure it is true just watch.
In a previous analysis I mentioned that ETHUSDT was trading within a tight range support buy-zone, marked blue on this chart. This is also a higher low and consolidation was happening before what happened today. Bullish action confirmed. Real bullish action I should say because this action is coupled with really high volume. Confirming a very strong high in the coming weeks and days.
Here is what will happen, Ethereum will grow daily non-stop for months. Now, saying it (reading it) is one thing, experiencing will be something completely different, the market will become euphoric as everything grows.
Hundreds of billions worth of USD will be injected into the market, we already have 30 billions that came in recently but only some 10-15 billions are already in-play. This means that the whales still have 15 billion USD ready to buy, and they will continue to buy long-term. As this capital dries up, more and more players will get involved. Notice how the sentiment is still low. People know we are bullish but that is only the usual market participants, those that are part of the industry, the rest, the mass, they are not in yet. When the masses wake up, that will be very close to the top of the first bullish wave. 250 B$ coming in will change not only the Cryptocurrency market forever but also the global financial landscape.
Ethereum breaking bullish is just step one, there is more to come. Prepare for Ethereum to trade at around $10,000 before this year ends. Would you like to bet? I don't think so, we already won because we've been bullish since before 7-April, now it is time to enjoy the ride nothing more.
Adapt and change. The market always fluctuates from bullish to bearish, from bearish to sideways, from sideways to bullish and bullish the market will stay long-term.
Thank you for reading.
"Buy like it's the end of the world. —Master Ananda"
You can't go wrong when prices are low.
Thanks a lot for your continued support.
Namaste.

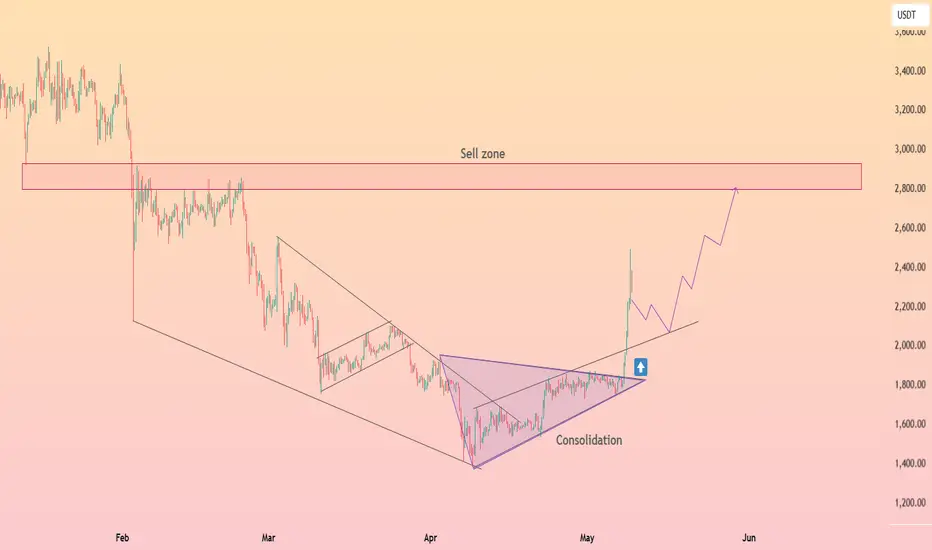
HolderStat┆ETHUSD breakout toward key resistanceAfter weeks of consolidation inside a symmetrical triangle, ETH has confirmed a bullish breakout with strong momentum. Price is now aiming for the $2800–$3000 sell zone, a key level from previous distribution. The breakout suggests increased buying pressure and a potential mid-term rally continuation.
💡 If ETH holds above the $1800 breakout zone, we could see a gradual climb toward $2800 in the coming weeks.
DeGRAM | ETHUSD keeping the demand zone📊 Technical Analysis
● ETH printed a higher low at the green $1 750‑1 900 demand zone and is now moving along the support line.
● A close above minor trend resistance at $1 900 should trigger a run toward $2 100; downside risk contained at $1 650.
💡 Fundamental Analysis
● SEC cleared options trading on spot‑ETH ETFs, and analysts see staking approval as early as May—fresh catalysts for institutional inflows.
✨ Summary
Trend‑break plus ETF momentum backs a short‑term long stance: targets $1 900 → $2 100; invalidate below $1 700.
-------------------
Share your opinion in the comments and support the idea with like. Thanks for your support!

$ETHUSDT - Major Breakout Alert! CRYPTOCAP:ETH has officially broken out of a long-standing descending parallel channel on the daily chart — a key structural shift in market sentiment. This breakout is further supported by a successful close above the 50 EMA, which had acted as dynamic resistance throughout the downtrend.
Key Technical Developments:
- Broke out of a descending parallel channel
- Closed above 50 EMA for the first time in weeks
- Strong daily candle with 8% gain confirms momentum shift
Immediate Support: $1,790 (former resistance zone turned support)
Next Major Resistance: $2,393
This is the mid-zone before ETH challenges the broader supply area around $2,550–2,850.
This breakout mirrors Ethereum's typical behavior during previous cycle expansions — grinding accumulation followed by aggressive breakout moves. The confluence of the EMA breakout and channel structure suggests we could be looking at the beginning of a broader trend reversal.
Trading Plan:
Retests towards $1,850–$1,790 can offer high R:R entries.
Watch for continuation patterns or consolidation above $2,000 for the next push.
CRYPTOCAP:ETH is reclaiming momentum — if BTC remains stable, this move could expand quickly.
If you find this analysis helpful, please hit the like button to support my content! Share your thoughts in the comments, and feel free to request any specific chart analysis you’d like to see.

ETH: A Perfect Rebound!ETH Update:
As analyzed in our previous update, ETH has shown a promising rebound from support. It made an impressive move from $1,400 to the current market price of $2,000, marking an outstanding 45% rally.
With the RSI gradually gaining bullish momentum, ETH looks strong and could potentially rally back to the $3,000–$3,500 range.
Regards,
Dexter

ETH to $2100 Looks like the bulls are starting to dominate again, traders! Ethereum has started to rise, Lips crossed the Jaw on Alligator, and AO confirms the bullish sentiment. On top is the Order Block, which acts as a magnet for the price.
BINANCE:ETHUSDT

$ETH Surprised $2.4K Price Mega Big pumping & touch to $3K ✨ CRYPTOCAP:ETH Surprised $2.4K Price Mega Big pumping & Trying to $3K Milestone again.
💫 From Breaking News:
• Ethereum Foundation Invests $32.65M in Ecosystem Growth
• Ethereum To Expand Network Capacity with Gas Limit Increase
Ethereum blockchain is preparing for a major upgrade that could make its network faster, cheaper, and more efficient. Developers have proposed raising the gas limit by 66% in a new development, from 36 million to 60 million units.
This change aims to improve the number of transactions the network can handle per block. This is to help users and developers enjoy smoother and more affordable activity on the blockchain.
Developer Says Testing Success Leads to Mainnet Rollout
Ethereum core developer Parithosh Jayanthi recently confirmed that the upgrade had passed early tests and is now ready for broader use. The new gas limit was successfully tested on the Sepolia and Holesky testnets. According to Jayanthi, the final rollout to Ethereum’s mainnet will begin shortly.
This is the second time Ethereum has raised its gas limit in 2025. The first increase happened in February, when the limit increased from 30 million to 36 million. These changes came after there hadn’t been any gas increase on the network since 2021.
#Write2Earn #ETH #BinanceSquareFamily #MarketRebound #SUBROOFFICIAL
Disclaimer: This article is for informational purposes only and does not constitute financial advice. Always conduct your own research before making any investment decisions. Digital asset prices are subject to high market risk and price volatility. The value of your investment may go down or up, and you may not get back the amount invested.

ETH/USDT 15-Min Chart Analysis – Bullish Setup with Trade PlanThis chart shows a bullish scenario for ETH/USDT on the 15-minute timeframe. Price is consolidating above a key support zone, indicating potential for a strong upward move.
📈 Trade Idea (Long Setup):
Entry Zone: $2,300 – $2,310 (red support zone)
Stop-Loss: Below $2,280
Targets:
🎯 Target 1: $2,388.70
🎯 Target 2: $2,428.47
🎯 Target 3: $2,492.75
🟢 Bias: Bullish (if price respects the support zone and forms reversal confirmation)
Note: Wait for a bullish confirmation candle or bullish divergence before entering. This setup is based on potential support reaction.

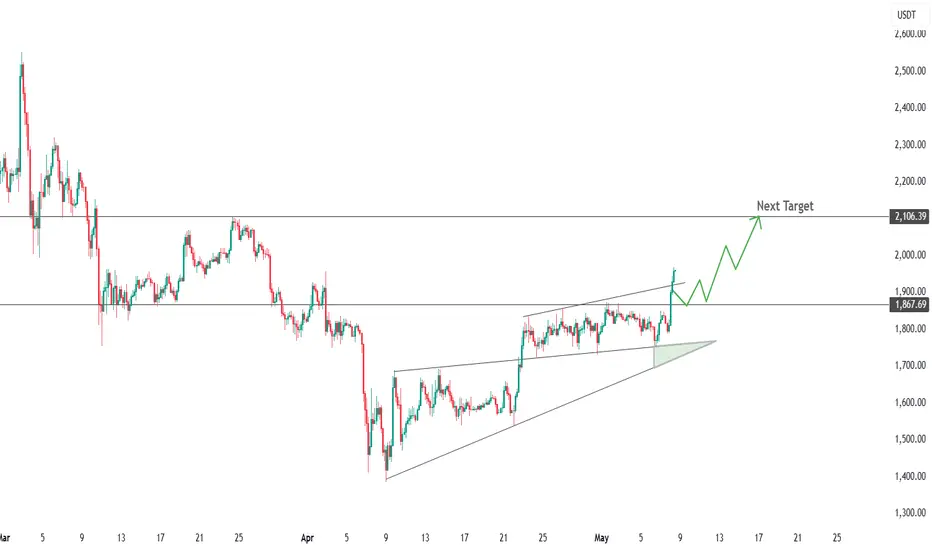
Broke the resistance levelCRYPTOCAP:ETH - wedge broken, target 2,100 USDT
After a three-week contraction, the price broke above the upper boundary of the ascending wedge and the 1,870 USDT horizontal, confirming a change of momentum in favor of the bulls.
📌 Levels
- S1 1 870 USDT - top of the wedge, retest zone
- S2 1,800-1,820 USDT - base of the formation
- R1 1 900-1 920 USDT - local obstacle near trend lines
- R2 2,106 USDT - calculated wedge height target and March supply area
📈 Scenario
Holding S1 opens the way to R1; a consolidation above 1,920 activates the march to 2,100 USDT. A run-up to 2,200 is not ruled out with strong volume.
⚠️ Risks
A failure ⇩ 1,870 would indicate a false breakout; a move below 1,800 would bring the price back to the wedge and increase the chance of a test of 1,740.