After a 37% Surge, Is Ethereum Still a Buy...?Ethereum Breaks Key Resistance, Signaling Potential Trend Reversal
Ethereum has delivered two significant technical signals indicating a potential trend reversal. The first is a breakout above the longstanding downtrend line, and the second is the breach of the critical \$2,100 resistance level. These developments suggest growing bullish momentum in the market.
With both confirmation signals in place, Ethereum appears poised for further upside. Traders may now look for a potential pullback or retest around the \$2,100 level, which could serve as a strategic entry point for long positions.
If this level holds as new support, the next target to watch is the \$2,800 mark, aligning with broader market expectations and previous price structure zones.
As always, traders should monitor price action closely and manage risk accordingly in case of volatility around key levels.
ETHUST trade ideas

GREAT OPPORTUNITY TO BUY ETHAfter several rejections trying to break past the indicated resistance, today, we have a breakthrough on BINANCE:ETHUSDT.P , It would be valid to buy ETH at the retest of the previous resistance that as just been broken, we also have both 50and200 EMAS as our shield to add as extra confluence on this very trading ideas. All the best.

Has the alt season started?After hitting the $2200 area with a strong candle, corrections are worth buying.
These purchases could be the best or last chance to buy for those who missed out on the market.
Good days will begin with a little patience.

ETH is finally showing some sign of lifeETH after being bearish for so long is finally seen some inflow of money towards it, meaning ALT season is starting to show little glimpses here and there.
ETH Long term looks really good, if everything continues as smooth as it is currently then I will expect ETH to do great, the current targets I have going up 2.4k if the price hold those levels then 3.4k will be a walk to the park.
if it goes down to the 1900 even the 1700 area, I will just buy more.
Always put stop loses the current economy is showing no mercy, neither should we.

ETH Bulls Waking Up – But Can They Break This One Last Barrier ?Hello Traders 🐺
As the old man said: "Those who survive the dump, deserve the pump." 😂😉
I hope you're doing well — and if you're still here after the last few weeks, you're already ahead of the crowd.
Let’s break down the current ETH situation and see why this could be the beginning of a major shift:
🔹 Daily Chart Overview :
ETH is testing the top of a descending channel. If we see a breakout here, the road toward $2100 is wide open — that’s a +23% move and could signal the start of a full trend reversal toward $4000.
But why am I so confident? Let's dive deeper:
🔹 Market Sentiment & On-Chain Signals
ETH is heavily oversold
Fear & Greed Index is at extreme fear
Altseason Index near historic lows
ETH/BTC is sitting on long-term support
🔹 ETH/BTC Monthly Chart:
ETH is at a key monthly demand zone against BTC. Historically, this area has triggered ETH dominance and massive altcoin rallies.
🔹 BTC.D vs ETH:
BTC Dominance (BTC.D) is showing signs of topping out at key resistance, while ETH/BTC is forming a bullish divergence — a classic setup for rotation from BTC to ETH and altcoins.
🟢 Weekly ETH Chart ETH is sitting right on a major support zone. This is where reversals begin. If it holds, this could be the last dip before a major breakout.
💬 Final Thought:
Let me know your thoughts in the comments. Are you loading ETH or still waiting for confirmation?
And as always:
🐺 Discipline is rarely enjoyable, but almost always profitable 🐺
🐺 KIU_COIN 🐺

Ethereum one-month analysis resultThe strong rise of Ethereum will indicate a continued rise in the crypto market, this analysis is 100% accurate and without any price drops.
Sasha Charkhchian

ETH/USDT 15-Min Chart Analysis – Bullish Setup with Trade PlanThis chart shows a bullish scenario for ETH/USDT on the 15-minute timeframe. Price is consolidating above a key support zone, indicating potential for a strong upward move.
📈 Trade Idea (Long Setup):
Entry Zone: $2,300 – $2,310 (red support zone)
Stop-Loss: Below $2,280
Targets:
🎯 Target 1: $2,388.70
🎯 Target 2: $2,428.47
🎯 Target 3: $2,492.75
🟢 Bias: Bullish (if price respects the support zone and forms reversal confirmation)
Note: Wait for a bullish confirmation candle or bullish divergence before entering. This setup is based on potential support reaction.

Ethereum price increaseThe influx of liquidity and increased demand for Ethereum has caused the price of Ethereum to increase in various technical analysis models. In previous analyses, I had identified the Ethereum price resistance area, according to which the price increased at the specified time, and for a short-term weekly or daily target, we can consider a price of $2,000 per Ethereum unit, but it should be taken into account that this increase is likely to ultimately cause a new price record for this currency in the crypto market.
Sasha Charkhchian

ETHEREUM 2025.05.01***Follow SEOVEREIGN to receive alerts.
**Boosts help SEOVEREIGN analyze more assets.
**Our team regularly publishes analysis reports on the cryptocurrency market.
Asset Overview – Ethereum (ETH)
🎯 Target 1: 1,820
🎯 Target 2: 1,787
Ethereum has currently confirmed the 1.13 Bat Pattern,
indicating a potential short-term downside move.
This may offer an opportunity to consider a short position for futures traders.
Of course, from a long-term perspective, we continue to expect upward momentum for Ethereum.
However, a short-term technical correction is possible, so please take this into account in your trading decisions.
This also serves as a good example for those interested in trading strategies based on harmonic patterns.

Ethereum Future: Limited Upside Ahead?Ethereum price dropped roughly 25% since April 2 due to an overall market crash following Trump’s tariffs implementation.
Compared to the almost 40% drop back in February after the first tariff announcement, this time the correction wasn’t as harsh or brutal.
So what can we expect next from Ethereum in the coming weeks?
The main hope for ETH price remains the upcoming Pectra upgrade.
Historically, major Ethereum upgrades have acted as bullish catalysts — for example, ETH roughly doubled in price ahead of both the Merge and the Shanghai upgrade.
If history rhymes, we could see a similar pre-upgrade pump this time too.
However, even if that rally materializes, I expect it to be limited to the $3,000–$3,400 range. The market lacks the kind of momentum or macro tailwinds needed to push ETH beyond 4k in this cycle — unless there’s a major shift in sentiment.
Overall, I remain cautious. The broader crypto market seems to be rolling over, and Ethereum hasn't even reclaimed its ATH.
With the next bear cycle approaching, long-term bullish targets might need to be revised — at least for now.
Short-term bounce possible thanks to Pectra hype, but don’t expect miracles. ETH likely capped below 3.4k unless something big changes.

$eth tl breakoutBINANCE:ETHUSDT about to break a multi month trendline, paying close attention to a 4h/12h/1d close above it
fibs as tps with previous highs as confluence, pretty straightforward setup
invalidation on a failed breakout

ETH TRADE PLANETHUSDT trend bullish now after CHoCH, currently respected FVG and going up but this is not my entry zone I will enter from lower FVG that caused CHoCH ( After confirmation).

$Ethereum Weekly Outlook Ethereum Weekly Outlook 🔥
CRYPTOCAP:ETH just bounced hard from the macro trendline key demand zone
- Now reclaiming the $2,350 level is a strong bullish signal.
- The next major resistance sits at $4,800.
- The path looks bullish if we hold this zone.
Accumulate smart.

ETHUSDT Daily : READY For Ethereum ATH Hi guys ,
So let's see if Ethereum finally gets its turn. The chart has heavy nodes for growth but I think we could see Ethereum at $4,000 again.
SecondChanceCrypto
⏰ 9/May/26
⛔️DYOR

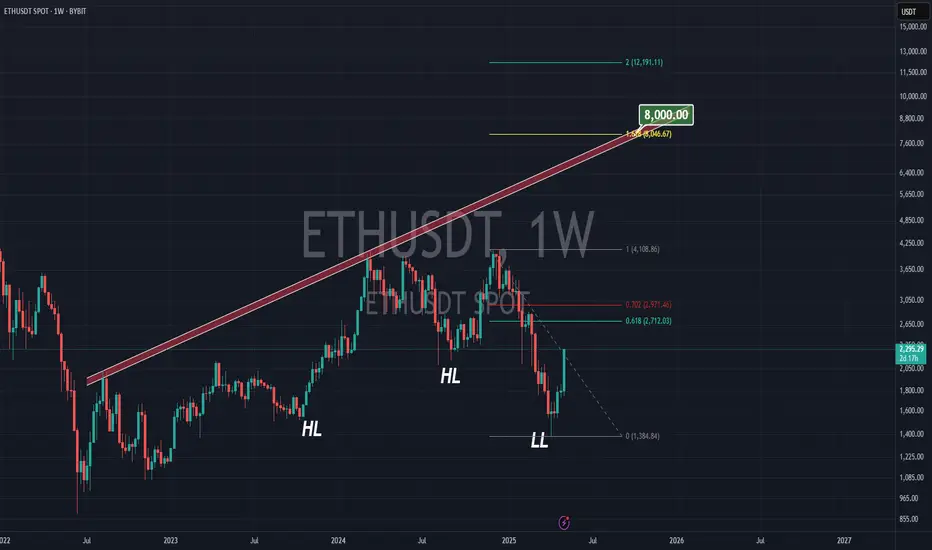
ETHEREUM TO $8000According to the previous tops we have for Ethereum on big time frames, we have a strong & long-term trend-line which gives us $7000 in summer and $8000 in October time.
On the other hand the 161.8% Fibonacci from the previous top the bottom we just saw (about $1500 ) is at $8000 .
Is this a coincident?! I don't think so
ETH/USDT – Weekly Chart AnalysisETH/USDT Unique Technical Structure: Large Accumulation + Recovery Setup
This chart shows Ethereum’s price action over the past few years, highlighting key support and resistance areas. A strong visual signal (blue arrow) indicates bullish potential.
Chart Pattern Implications:
The pattern on this chart is not a classical shape (e.g., cup and handle), but it does show a Wyckoff-style accumulation phase followed by a failed breakout and reaccumulation:
Strong base formed between $1,000-$1,400
A series of lower highs and a range-bound structure after the 2022 peak
The bullish projection illustrated by the arrows shows a potential recovery towards the ATH again
This setup suggests that Ethereum is at a critical juncture – either:
It retests current support and begins a new uptrend.
Or it risks another test of the $1,400-$1,050 range before a breakout.
Risk-Reward: Current levels ($1,796) offer attractive long-term entries if you’re bullish.
Caution Zone: If ETH breaks below $1,400 with volume, $1,050 becomes the next key defense.
If you found this analysis helpful, hit the Like button and share your thoughts or questions in the comments below. Your feedback matters!
Thanks for your support!
DYOR. NFA

ethusdt
After testing $1680 in Ethereum, targets of 1960-2100 and 2260 are expected in order. If a daily close occurs below $1600, a stop may be required.

ETH Short (Short term)ETH has just completed manipulation on weekly time frame which just closed earlier (2 hours ago from writing). Expecting down move to 50% of the weekly range ($1695) before continuing it's overall bullish trend to higher prices.
Able to position a short from $1818 to $1720 (range low).
$1816 is the opening of the 4 hour fair value gap.
Reference to ICT peoples 1W-> 4H.
Will write another idea on the overall long position.

Long trade ETHUSDT (Buy Side)
🗓 Date: Monday, 5th May 2025
⏰ Time: 9:30 AM
📍 Session: London AM
🪙 Pair: ETH/USDT
📈 Direction: Long (Buy Side)
🔹 Entry Details:
Entry Price: 1797.34
Take Profit: 1830.55 (+1.85%)
Stop Loss: 1793.65 (−0.21%)
Risk-Reward Ratio: 8.98
🔹 Trade Context:
Executed during the London AM session, often characterised by clean intraday price action and strong directional intent. Entry followed clear buyside pressure confirmation, with price consistently breaking highs.

Ethereum Wave Analysis – 8 May 2025- Ethereum broke the resistance zone
- Likely to rise to resistance level 2100,00
Ethereum cryptocurrency recently broke the resistance area between the major resistance level 1935,00 (former monthly top from April) and the 50% Fibonacci correction of the downward impulse from March.
The breakout of this resistance zone accelerated the active short-term ABC correction ii from the start of April.
Given the strongly bullish sentiment seen across the cryptocurrency markets, Ethereum cryptocurrency can be expected to rise to the next resistance level 2100,00 (top of the previous correction iv).

ETH TO OUTPERFORM?Ethereum printed a textbook bullish reversal candle on the monthly chart - a strong signal that buyers may finally be stepping in with conviction. After a prolonged downtrend and a brutal April close below the 50-month moving average, this kind of recovery is exactly what bulls were hoping for.
The candle itself is notable: a long lower wick and a solid body closing near the highs of the month, which indicates strong demand at lower prices and rejection of further downside. This type of price action at support often marks a key inflection point in market structure.
It’s still early in the month, but this bounce from the ~$1,600 zone, paired with the potential reclaim of the 50-month moving average, could set the stage for a sustained move higher - especially if macro tailwinds return or sentiment improves across the broader market.
Momentum has been weak for months, and ETH has severely underperformed BTC. But reversals don’t start with euphoria - they begin when few are paying attention, and this chart is quietly showing signs of life.

Ethereum (ETH): Strong Breakout From EMAs | Buyers DominatingA strong breakout happened on Ethereum, where we broke out from the local resistance zone on smaller timeframes and now we also have a very strong bounce from EMAs.
This might be the start of Ethereum's bull run, where most of the money inflow will now be into this one. We have 2 possible moves here where ideally we would need a smaller correction to secure that lower breakout zone so we are looking mainly for this area there.
As long as we are above that area, we will be looking for a bullish outcome (despite the fact that yesterday we had one short position on ETH).
Swallow Academy

ETHUSDT Breakout — Reclaiming Structure, 1940 Next?📈 Ethereum breaks downtrend with strong daily candle reclaiming key structure at $1,679.
🔥 Volume confirms the move, and price now targets the next resistance levels:
TP1: $1,754
TP2: $1,846
TP3: $1,941
A retest of $1,679 would be healthy before continuation.
🚨 If bulls hold this level, we may be seeing early signs of a broader recovery.
Thoughts? Are you long ETH here or waiting for confirmation?
#ETH #Ethereum #Breakout #Trendline #Crypto #TechnicalAnalysis #Altcoins #PriceAction #SupportResistance #ChartPatterns
