ETH - LIQUIDATION OF A FRIENDif you like the idea, please "Like" it. This is the best "Thanks!" for the author 😊 P.S. Always do your own analysis before a trade. Put a stop loss. Fix profits in installments. Withdraw profits in fiat and please yourself and your friends.
ETHUST trade ideas


Ethereum (ETH): Reached Sideways Channel's Resistance LineEthereum is back at the resistance zone where sellers failed to show a proper breakdown, which would have triggered our sell entry yesterday.
Now that we've reached the resistance zone, this is the area we are looking for rejection now, which would give us similar movement to what we had each time we reached the resistance zone. As always, wait for MSB on smaller timeframes and once we see it short position can be taken!
Swallow Academy

ETH Summer BearishA potential path for ETH before resuming a bullish major trend, is drawn with a purple arrow.
I don't think the FED will cut rates today. In fact, maybe in September. Maybe. If the FED cut rates, then the target scenario (green box in the chart) would not play out, we would shift to a bullish movement. I wish for that, but I don't think is near yet.
That being said, the current potential risk, I calculated it to -30% from current levels. Exact prices are impossible to predict, rather I focus on target areas.
DISCLAIMER:
Do Your Own Research, don't use mine to invest! This is not a financial advice, it is only a mere opinion of mine. I own several cryptocurrencies, including ETH.

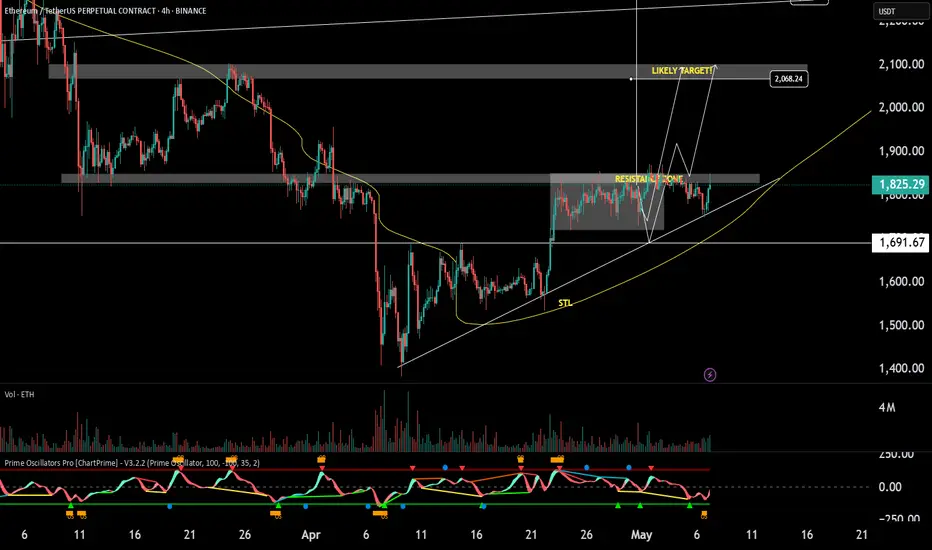
$ETH Bullish!CRYPTOCAP:ETH continues to hold strong at support — a breakout is likely.
Target remains at $2,000.
This is the 6th attempt to break the same resistance zone — remember, every touch weakens it.
We still have higher lows plus bullish divergence forms on the oscillator. (bias - BULLISH!)
Be patient....Most investors are in big losses these days, and some are disappointed with the growth of this popular currency.
The area where it is now is considered a cheap area for this cryptocurrency, which personally attracts investors for a buying step.
You can have a buying step with your own decision and with your strategy, you can add the next buying step to it if it is confirmed for growth or at low prices.
In the end, you are the main decision maker.

ETH Rejects from 0.618 Fibonacci — $1,540 in Sight?Ethereum has rejected from a key resistance cluster around the 0.618 Fibonacci level. With price slipping below the point of control, downside continuation toward $1,540 looks increasingly probable — unless bulls step in soon.
Key Highlights:
Confluence Resistance Zone: 0.618 Fib, daily resistance, and descending VWAP capped recent price action.
POC Lost: The local point of control has broken down, showing sellers are dominating the short-term range.
Lower Structure Forming: Ethereum is setting lower highs, with $1,540 as the next key support and potential draw for price.
Full Analysis:
ETH/USD has stalled under a strong resistance zone combining the 0.618 Fibonacci retracement, daily structure, and a descending VWAP from the prior lower high. After multiple failed attempts to break higher, price is rolling over — and has now lost the local volume point of control (POC).
This breakdown suggests that value is no longer being accepted at this level, and we may see a rotation lower. Ethereum is also forming a short-term bearish structure — with lower highs and weak attempts at reclaiming lost levels. The next key support sits at $1,540, which also aligns with unfilled inefficiencies and resting liquidity from previous upside moves.
If ETH loses the recent swing low, a move toward $1,540 becomes increasingly likely. However, a reclaim of the POC could indicate this is just a fakeout before buyers attempt another breakout.
What to Watch Next:
Hold above current swing low = potential bounce.
Break below = opens path to $1,540.
Reclaim of POC = short-term bullish invalidation.

ETH (Ethereum)–High-Risk, High-Reward Setup Near Fair Value GapEthereum is showing early bullish signals within a broader downtrend, and a pullback toward the $1,700 zone—where it meets the underside fair value gap and 21-day moving average—may set the stage for a higher low and potential trend reversal.
🔹 Entry Zone:
$1,700
🎯 Take Profit Levels:
🥇 $2,000
🥈 $2,200
🥉 $2,400
🛑 Stop Loss:
$1,550 (below structure and invalidation point)

Ethereum Prepares for Major Pectra UpgradeEthereum—the second-largest cryptocurrency by market capitalization—is set to undergo a major upgrade in May 2025, known as “Pectra.” This update promises to significantly improve scalability, performance, and user experience. But what exactly does it entail?
Pectra follows the groundbreaking "Merge" event of 2022, which shifted Ethereum from proof-of-work to proof-of-stake consensus. With that transition complete, developers have now turned their focus to making the network faster, cheaper, and more user-friendly.
The upgrade includes several Ethereum Improvement Proposals (EIPs), targeting transaction processing, wallet functionality, and validator operations. Some key highlights are improvements in staking, partial withdrawals, adaptive fee structures, and better client compatibility.
Most notably, Pectra enhances staking mechanics, allowing validators to partially withdraw funds—something that was previously restricted. This change is expected to attract more participants to Ethereum’s staking ecosystem.
Transaction efficiency is also a central focus. The upgrade aims to reduce network congestion and lower gas fees, which have long been a pain point for users of decentralized finance (DeFi) platforms and NFT marketplaces.
Investor sentiment is cautiously optimistic. Though ETH price action remains relatively stable, trading volumes have increased as traders position themselves ahead of the upgrade. Analysts suggest that a successful implementation could trigger a rally in Ethereum’s price, especially if the changes deliver on promised performance gains.
Ethereum continues to dominate the smart contract space despite increasing competition from blockchains like Solana and Avalanche. Pectra could further solidify Ethereum’s lead, especially if it improves network speed and lowers costs without compromising decentralization.
This upgrade isn’t just a technical patch—it’s a strategic move to future-proof the Ethereum ecosystem in the Web3 era. With Pectra, Ethereum reinforces its role as the foundational infrastructure for decentralized applications.

#ETH retests the support channel, can it hold?📊#ETH retests the support channel, can it hold?
🧠From a structural point of view, the highs are gradually falling, and the bullish potential is weakening. We can only usher in a surge after we strongly break through the suppression of the blue downward trend line and stabilize the 4h blue resistance zone, and the resistance zone turns into a support zone.
➡️This is the fourth time we have tested the support near 1750. If the support is tested multiple times, the support effect will weaken. We should be wary of further callbacks after breaking the support, so if we want to participate in new long transactions, we need to find lower support, so the support points worth our attention are around 1660 and 1570.
🤜If you like my analysis, please like 💖 and share 💬
BITGET:ETHUSDT.P

Ethereum (ETH): Rejection Inside Sideways Channel | Short SetupSellers showed strong dominance near the upper resistance zone, where, after multiple attempts to break out from this channel, buyers failed, and the price is declining now, leading it towards our supportive area and closer to our entry zone as well.
As we also recently broke the 200EMA line, we are now aiming to see the price drop at least to that lower sideways channel zone, where we expect to see some liquidation hunting and eventually a clean breakdown, which would then open us an opportunity to move even lower.
Swallow Academy

Ethereum (ETH): This Might Be Breakout Point For Us | Buy ZoneEthereum might start a good rally soon if buyers manage to secure current zones and form a break of structure here.
We are not going to rush here as today is just the beginning of the week and we might see bloody monday so waiting for proper BOS before entering into a long position here!
Swallow Academy

Ethereum (ETH): Waiting For Dominance By Buyers At $1,900Ethereum has formed a proper foundation from where we might see a good upward movement coming pretty soon; all we need is just to secure the $1,900, which then might send the price towards our target zones.
There is nothing much to talk about rather than waiting for the resistance zone and once we see that buyers will overtake that zone we are going to look for long positions here!
Swallow Academy

$ETH Support + weeklyCRYPTOCAP:ETH is bouncing off a key trendline support + weekly demand zone
A strong reclaim above $2,350 green zone could trigger a clean move toward $4,800 resistance
Watch for retests and bullish structure forming 🧠

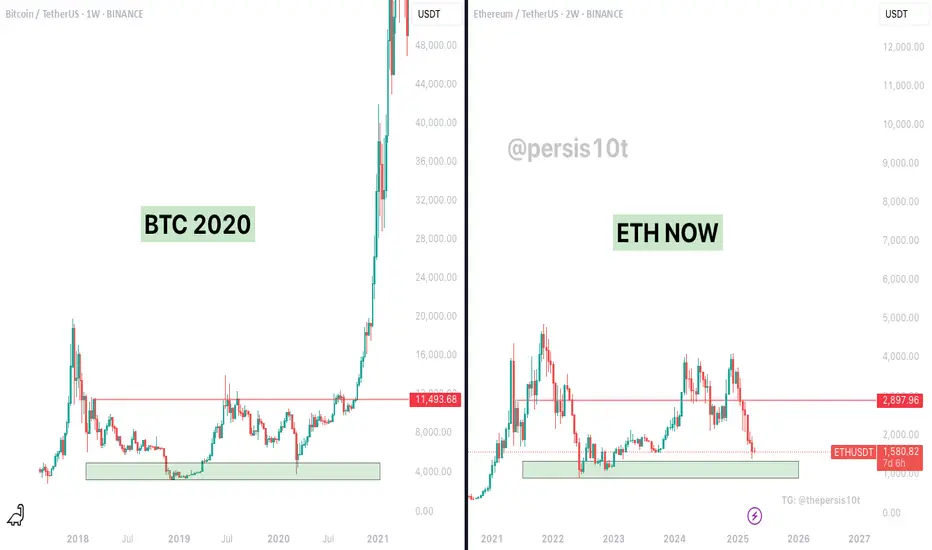
History Doesn’t Repeat, But It Often Rhymes – ETH = BTC 2020?On the left: BTC in 2020 before it exploded from ~$11K to $ 60 K+
On the right: ETH now, sitting on a similar macro support zone and showing a similar multi-year accumulation range.
This Chart Suggests:
BTC (2020) consolidated for years in a tight range between $3K and $ 12K before blasting off.
ETH has now spent over two years ranging between ~ $ 1K and $3K, forming a strong base at support just like BTC did.
The current ETH structure mirrors BTC's pre-bull breakout — clean support retest, fakeouts, and suppressed volatility.
If ETH follows a similar path, the next parabolic expansion could be approaching.
This isn't just about pattern recognition — it's about timing cycles, sentiment shifts, and institutional patience.
“The best trades often feel the most uncomfortable.”
While many are panicking, ETH is printing a macro setup that resembles the beginning of Bitcoin’s strongest run in history.
Are you prepared if ETH goes full BTC 2020 mode?
ETH LONG (Longer Timeframe)ETH is bullish, just like many other alts in the long term. Expected price drop to around $1690-$1720 range for entry long.
From my charts we can see that using PO3, manipulation happened the previous month, closing within range low. now price will seek to gather liquidity end from range high, closing above and around $2555.
Entry on fair value gap after bounce in $1690-$1720 range.

Ethereum rising as we expectedEthereum rising as we expected
new long in a case of Big OI rise
Sell better to take at key zone in a case of bullish absorption

Ethereum: Sell Or Hold? Panic Buy, Panic Sell or Panic Hold?If I were you in this situation, what would you do?
What would you do if you were not you in this situation?
Ethereum hit bottom on the 9th of April and the bottom is confirmed based on the same candle. It ended full green and with really high volume.
The action moved back above support on 22-April when the 3-Feb. low resistance was conquered. Ethereum now trades within a tight price range.
This range's support has been tested four times and it holds, Ethereum now trades higher but what will happen next? What would you do if I were me?
Market conditions can change in a day. Two days green, two days red it is all sideways, nothing changes and nothing has changed.
If you are still wondering if you should panic sell or panic hold right now all you have to do is panic buy because Ethereum is going up.
Ignore the short-term nothing because this chart isn't showing even noise. It is the consolidation of the higher low before additional growth.
Ethereum's chart looks very different to Bitcoin, it is incredible. Ethereum is no longer "#2" but more like an Altcoin, Bitcoin has its own chart while Ethereum has the chart of a medium sized Cryptocurrency pair. This is good, it tells us that Ethereum is about to grow really strong and will produce a new All-Time High in 2025. This All-Time High will be higher than 2021 because while this isn't Bitcoin it is still a very strong chart. Expect lower no more, panic buy followed by panic hold while you rest easy and relaxed because there is no panic when the market grows.
The only panic right now is on the short side because the bottom is in and the bears are gone.
Rest easy, do not let go of your coins. Hold strong.
Never ever use a stop-loss. Think long-term and the market will bless you with amazing results.
Namaste.

possible short entry reversal point!Levels to keep an eye on for BOS for a high possibility short entry. In order to reach the higher levels a ABC structure is vital. looking for trendline break for confirmation.

Breakout trading point: 1861.57
Hello, traders.
If you "Follow", you can always get new information quickly.
Please click "Boost" as well.
Have a nice day today.
-------------------------------------
(ETHUSDT 1D chart)
The 1861.57 point is the HA-Low indicator point on the 1W chart.
The key is whether it can receive support and rise around the A section, that is, 1861.57.
Since the HA-Low indicator on the 1D chart is formed at the 1647.06 point, it is important whether it can receive support and rise in the 1647.06-1861.57 section.
If it shows support in the 1647.06-1861.57 section, it is a time to buy.
-
If it falls from 1647.06, there is a possibility that a stepwise downtrend will continue, so you should also consider a response plan for this.
In the case of a decline, the Fibonacci ratio section of 0 (1190.57) ~ 0.786 (1259.39) is expected to be an important support and resistance section.
-
Since the price is located below the M-Signal indicator on the 1M chart, it is recommended to conduct trading from a day trading or short-term trading perspective.
When it breaks through the 1861.57 point, a breakout trade is possible, but as I mentioned earlier, trading requires a short and quick response.
-
If the StochRSI indicator is above the midpoint, it is recommended to focus on finding a time to sell, and if it is below the midpoint, it is recommended to focus on finding a time to buy.
When creating a trading strategy by referring to the movement of these auxiliary indicators, you must check whether there is support at the support and resistance points drawn on the 1M, 1W, and 1D charts.
-
Thank you for reading to the end.
I hope you have a successful trade.
--------------------------------------------------
- Here is an explanation of the big picture.
I used TradingView's INDEX chart to check the entire range of BTC.
I rewrote the previous chart to update it while touching the Fibonacci ratio range of 1.902 (101875.70) ~ 2 (106275.10).
(Previous BTCUSD 12M chart)
Looking at the big picture, it seems to have been maintaining an upward trend following a pattern since 2015.
In other words, it is a pattern that maintains a 3-year bull market and faces a 1-year bear market.
Accordingly, the upward trend is expected to continue until 2025.
-
(Current BTCUSD 12M chart)
Based on the currently written Fibonacci ratio, it is displayed up to 3.618 (178910.15).
It is expected that it will not fall again below the Fibonacci ratio of 0.618 (44234.54).
(BTCUSDT 12M chart)
Based on the BTCUSDT chart, I think it is around 42283.58.
-
I will explain it again with the BTCUSD chart.
The Fibonacci ratio ranges marked in the green boxes, 1.902 (101875.70) ~ 2 (106275.10) and 3 (151166.97) ~ 3.14 (157451.83), are expected to be important support and resistance ranges.
In other words, it seems likely that they will act as volume profile ranges.
Therefore, in order to break through these ranges upward, I think the point to watch is whether they can receive support and rise near the Fibonacci ratios of 1.618 (89126.41) and 2.618 (134018.28).
Therefore, the maximum rising range in 2025 is expected to be the 3 (151166.97) ~ 3.14 (157451.83) range.
In order to do that, we need to see if it is supported and rises near 2.618 (134018.28).
If it falls after the bull market in 2025, we don't know how far it will fall, but based on the previous decline, we expect it to fall by about -60% to -70%.
Therefore, if it starts to fall near the Fibonacci ratio 3.14 (157451.83), it seems likely that it will fall to around Fibonacci 0.618 (44234.54).
I will explain more details when the bear market starts.
------------------------------------------------------

Ethereum is Nearing The Daily TrendHey Traders, in today's trading session we are monitoring ETH/USDT for a selling opportunity around 2,000 zone, Ethereum is trading a downtrend and currently is in a correction phase in which it is approaching the trend at 2,000 support and resistance area.
Trade safe, Joe.

ETH found a bottom at the 2018 All Time High IMO
#ETH RSI also hit the bottom levels🧐
As I said many times 'not accumulating CRYPTOCAP:ETH below $2k' is such a mistake❗️
#Ethereum still the bottom levels, now it's setting for the rally do not miss🚀
@VIPROSE

Ethereum: +80% in a Month — What’s Next?Hey traders and investors!
The price of ETH has surged by more than 80% over the past 30 days, but the momentum is starting to slow.
To understand the current position, we’re using the magic of timeframe switching and focusing on the 15-day chart.
Key Observations
1️⃣ A sideways range (consolidation) has formed on the 15D chart, with anchor points 1–6 (see chart).
2️⃣ The last major initiative came from sellers (move from point 5 to 6), and it includes some key features:
The initiative pushed below the lower boundary of the range — $2111.
The highest volume occurred on the last bar of this move (IKC bar).
The IKC bar absorbed liquidity not only below point 4 of the range but also below point 0 — the origin of the price move that preceded the formation of the range.
3️⃣ Buyers began developing their initiative by absorbing the sellers’ IKC bar, pushing price back into the range, and forming a buyer zone (blue rectangle on the chart, with the upper boundary at $1957).
4️⃣ Buyers have already reached the first target — $2717 (point 1 level).
What Does It Mean?
The rapid rally may slow down — the market likely needs some consolidation or a pullback.
A correction toward $2111 or even $1957 is possible. Both zones are attractive for medium-term long setups.
The medium-term bullish scenario remains valid as long as price stays above $2111.
Trade Outlook
📈 Long zones: $2111, $1957, or after a breakout and hold above $2717
🎯 Targets: $3744, then $4100
📉 Shorts are currently not justified — sellers show no real strength
Be ready for a potential “pause” in the rally and watch buyer activity — they currently hold the initiative (!).
This analysis is based on the Initiative Analysis concept (IA).
Wishing you profitable trades!
